
Ethereum Price Forecast: ETH retests $4,100 as investors buy the dip after $490 million leverage flush
Ethereum price today: $4,160
- Ethereum's recent decline washed over $490 million in long liquidations, among the largest in 2025.
- Dip-buying has outweighed distribution, suggesting investors view the decline as an accumulation opportunity.
- ETH continues to test the support level near $4,100 as the Stochastic Oscillator hits oversold conditions.
Ethereum (ETH) is trading lower on Tuesday on the back of $490 million in long liquidations. The decline comes despite ETH accumulation outweighing distribution over the past 24 hours.
Ethereum's leverage-driven decline attracts dip buyers
Following a 7% decline on Monday, Ethereum recorded over $490 million in long liquidations — one of its largest in 2025 — surpassing that of Bitcoin (BTC), as funding rates flashed negative, according to Coinglass data.
Due to underreporting practices from several exchanges and delays in the APIs of data aggregators, the liquidation size could be understated.
"Such a cascade typically happens when crowded long positions amplify small price declines into larger drawdowns," wrote Shawn Young, Chief Analyst at crypto exchange MEXC, in a Tuesday note shared with FXStreet.
For Ethereum, the liquidation marked the culmination of a sharp weekend rise in leverage, as open interest — the total value of unsettled futures contracts — jumped by 890K ETH between Friday and Saturday. The decline over the past three days has wiped out nearly the entire figure.
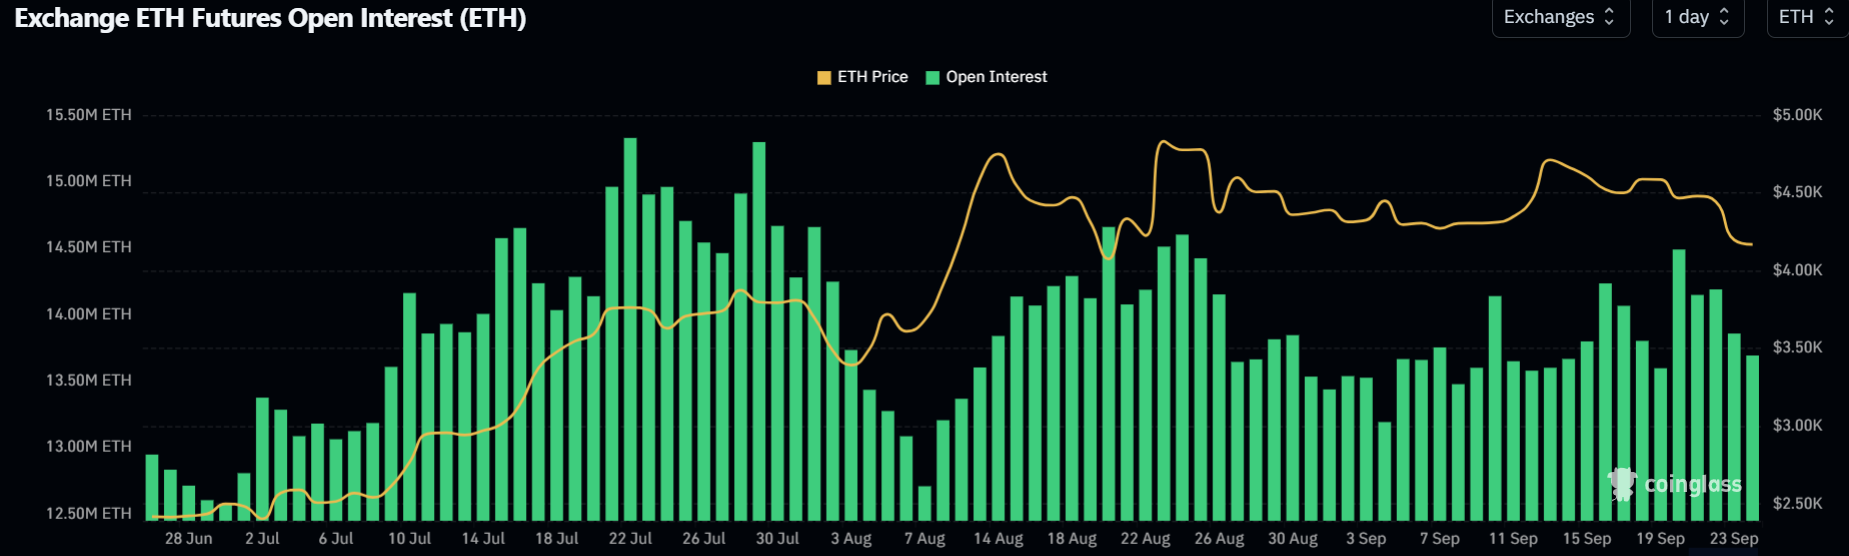
ETH Open Interest. Source: Coinglass
"While liquidation events are not ideal, these kinds of resets are not uncommon in crypto's market structural cycles. They often help to clear excess leverage fumes from the market and create a cleaner base for renewed price discovery movements," Young said.
Although the leverage-driven decline also triggered bearish sentiments across the spot market, dip-buying outweighed distribution, with ETH seeing exchange net outflows of over 288,000 ETH on Monday, according to CryptoQuant's data.
 - All Exchanges (11)-1758655804360-1758655804361.png)
ETH Exchange Net Outflows. Source: CryptoQuant
"Many market participants are treating the pullback as a prime accumulation opportunity rather than the beginning of market capitulation."
Exchange net outflows signal a dominant buying activity and vice versa for net inflows.
Ethereum Price Forecast: Bears continue to test support near $4,100 amid oversold conditions
Ethereum saw $55.4 million in futures liquidations over the past 24 hours, comprising $39.3 million and $16.1 million in long and short liquidations, per Coinglass data.
ETH retested the support level near $4,100 on Tuesday. Bears continue to retain control of the short-term trend with ETH trading below the 50-day Simple Moving Average (SMA).
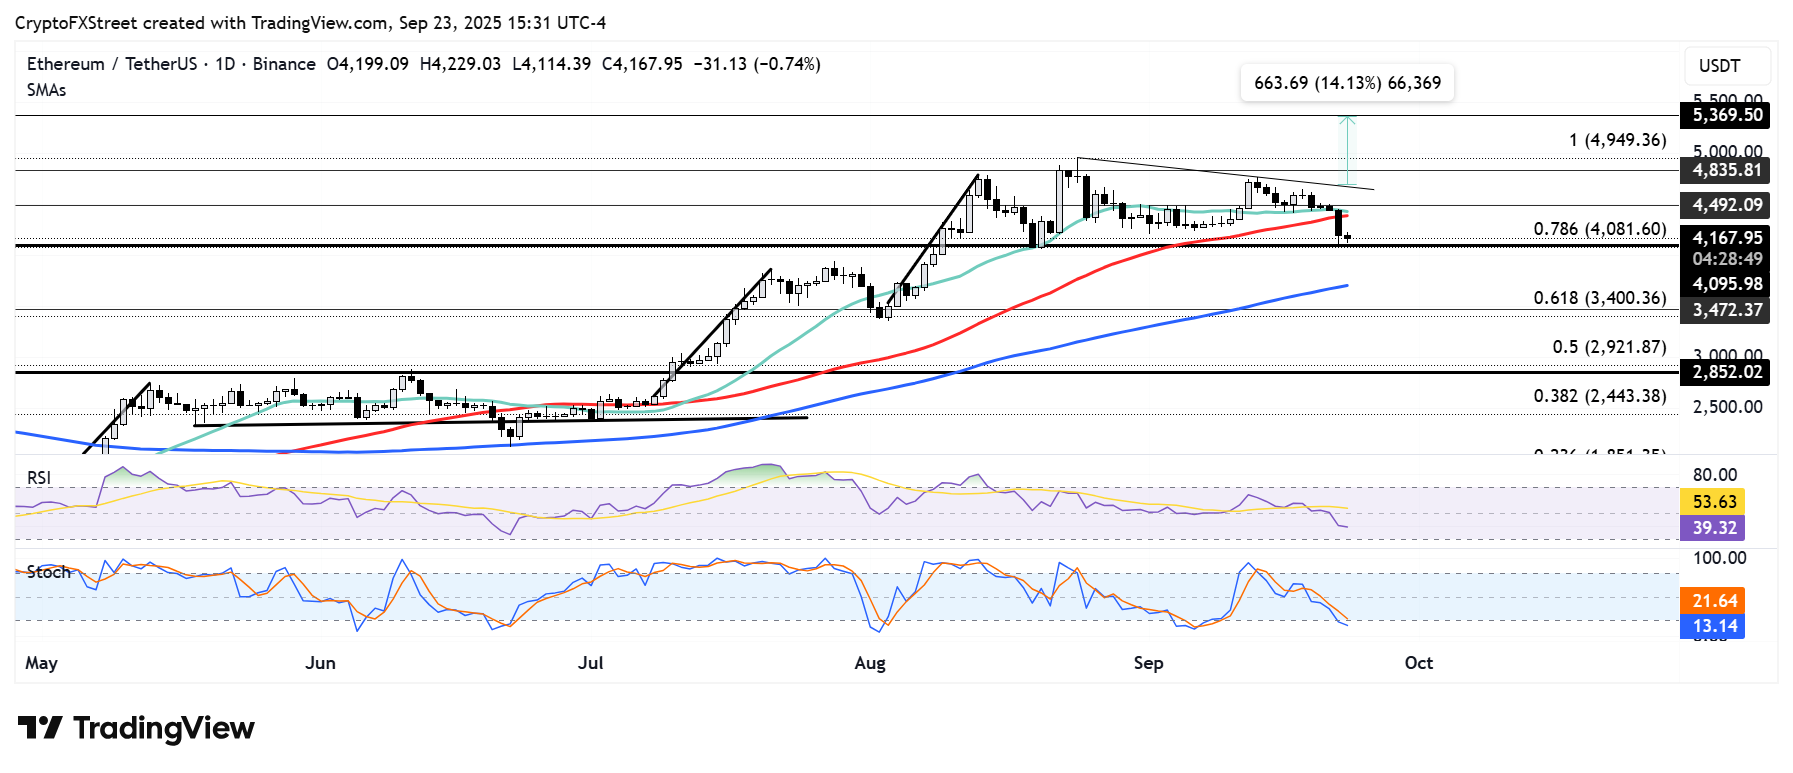
ETH/USDT daily chart
The top altcoin risks a decline toward the 100-day SMA near $3,600 if the $4,000 support fails. However, a recovery of the 50 and 20-day SMAs could push ETH above the $4,500 key level.
The Relative Strength Index (RSI) is below its neutral level, while the Stochastic Oscillator (Stoch) has entered its oversold region, indicating a dominant bearish momentum. On the flip side, oversold conditions in the Stoch often precede a market recovery.
บทความแนะนำ


