
Solana Price Forecast: SOL tests breakout zone as DeFi TVL surges $1.8 billion in a month
- Solana price regains bullish momentum, targeting two key levels at $220 and $250.
- Solana DeFi TVL grows by an additional $1.8 billion to $11.7 billion, underscoring investors' confidence.
- Solana active addresses remain significantly below the 2 million peak level reached in June, indicating a decline in on-chain activity.
Solana (SOL) is offering subtle bullish signals, trading above $205 on Friday, mirroring a risk-on sentiment after the release of key United States (US) economic data, including the Unemployment Rate and Nonfarm Payrolls (NFP).
The increase in the price of Solana follows in Bitcoin's (BTC) footsteps, which has reclaimed the position above the $112,000 support.
Interest in Solana remains relatively high despite the futures Open Interest (OI) retreating from $13.68 billion, the highest level on record. CoinGlass data indicates that OI, representing the notional value of outstanding futures contracts, averaged $12.39 billion at the time of writing. It is worth mentioning that healthy reversals are normal in bull markets as they provide investors with fresh entry opportunities before SOL regains bullish momentum.
Therefore, traders should closely monitor the OI to gauge market sentiment, especially since September is historically a bearish month in the crypto market. Other key indicators, such as demand for staking and platform revenue, could help shape the outlook for SOL over the coming weeks.
Solana DeFi TVL near record highs
The Solana Decentralized Finance (DeFi) Total Value Locked (TVL), which tracks the cumulative value of all coins held in smart contracts across protocols on the chain, has sustained an overall uptrend since April.
DefiLlama data shows that the Solana blockchain has a TVL of $11.67 billion, up from $9.86 billion posted on August 8. In other words, investors have locked over $1.8 billion across smart contracts on the protocol in a month, underlining their conviction in SOL's ability to extend the uptrend.
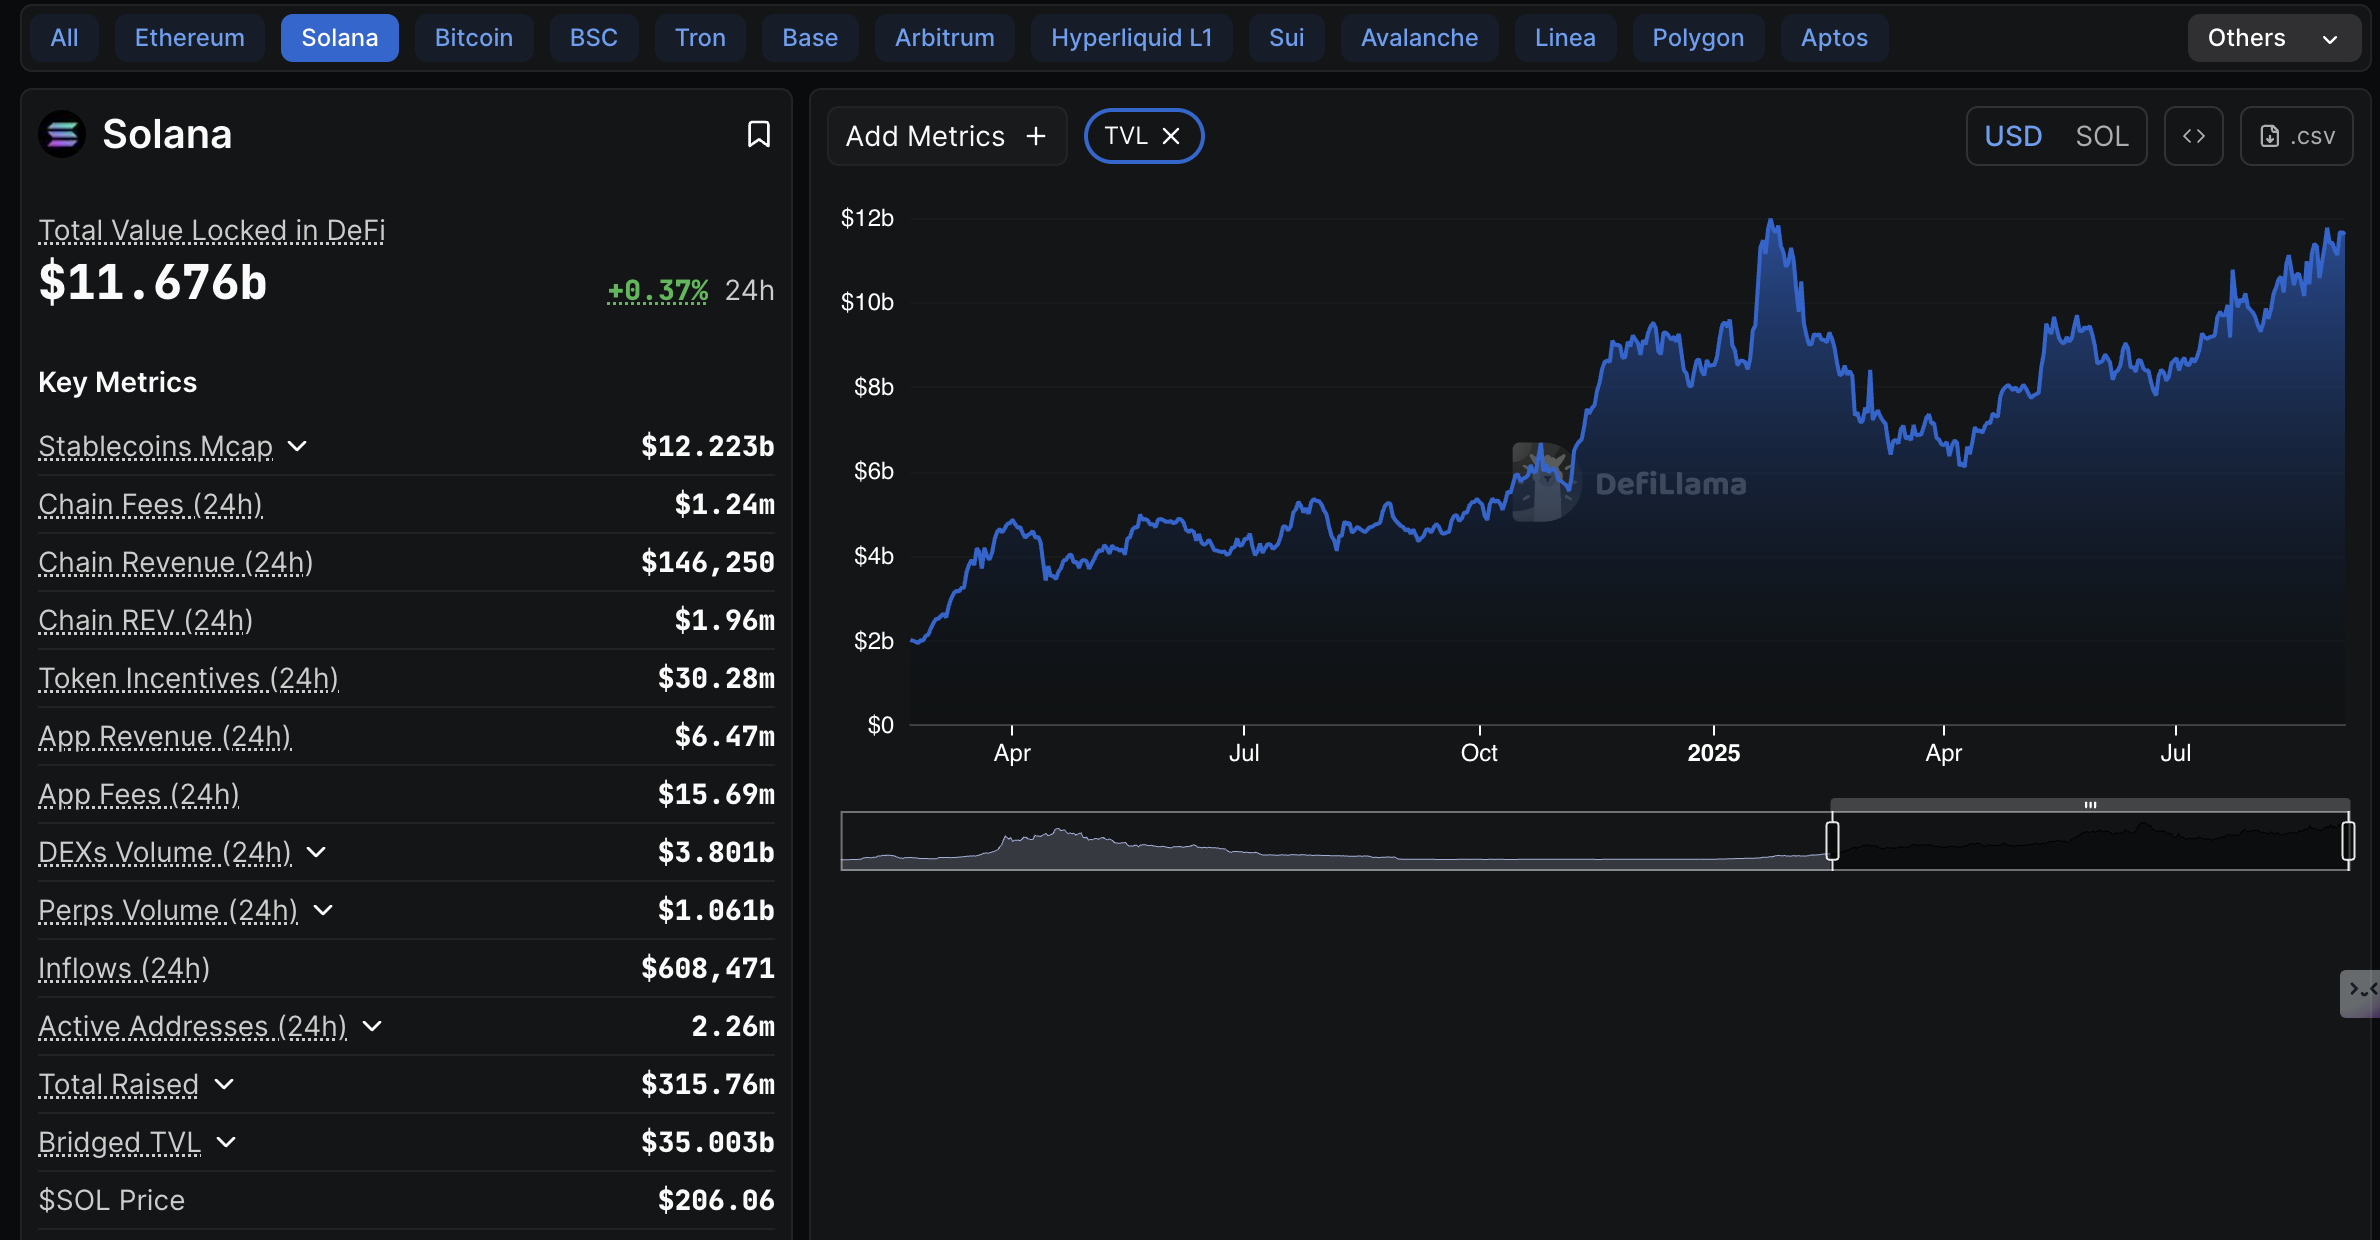
Solana DeFi TVL | Source: DefiLlama
Despite the bullish outlook regarding staking on Solana, the protocol faces a significant reduction in on-chain activity. Active addresses on the network have decreased by over 62% to 2.26 million, down from 6 million in early June.
The slump in active addresses signals reduced user engagement amid low transaction activity on the protocol. Active addresses refer to wallets interacting with the Solana blockchain by sending or receiving assets. It is a measure of network health, adoption and overall interest in the ecosystem.

Solana Active Addresses | Source: DefiLlama
Technical outlook: Solana builds bullish momentum
Solana price shows signs of steadying the uptrend toward the $220 level as part of the bulls' mission to push for gains above $250 in the medium term. SOL's short-term bullish outlook is supported by the Relative Strength Index (RSI) at 56 that is pointing toward overbought territory.
The smart contracts token is also positioned above the upward-facing 50-day Exponential Moving Average (EMA) at $187, the 100-day EMA at $177 and the 200-day EMA at $171, underpinning the bullish sentiment.
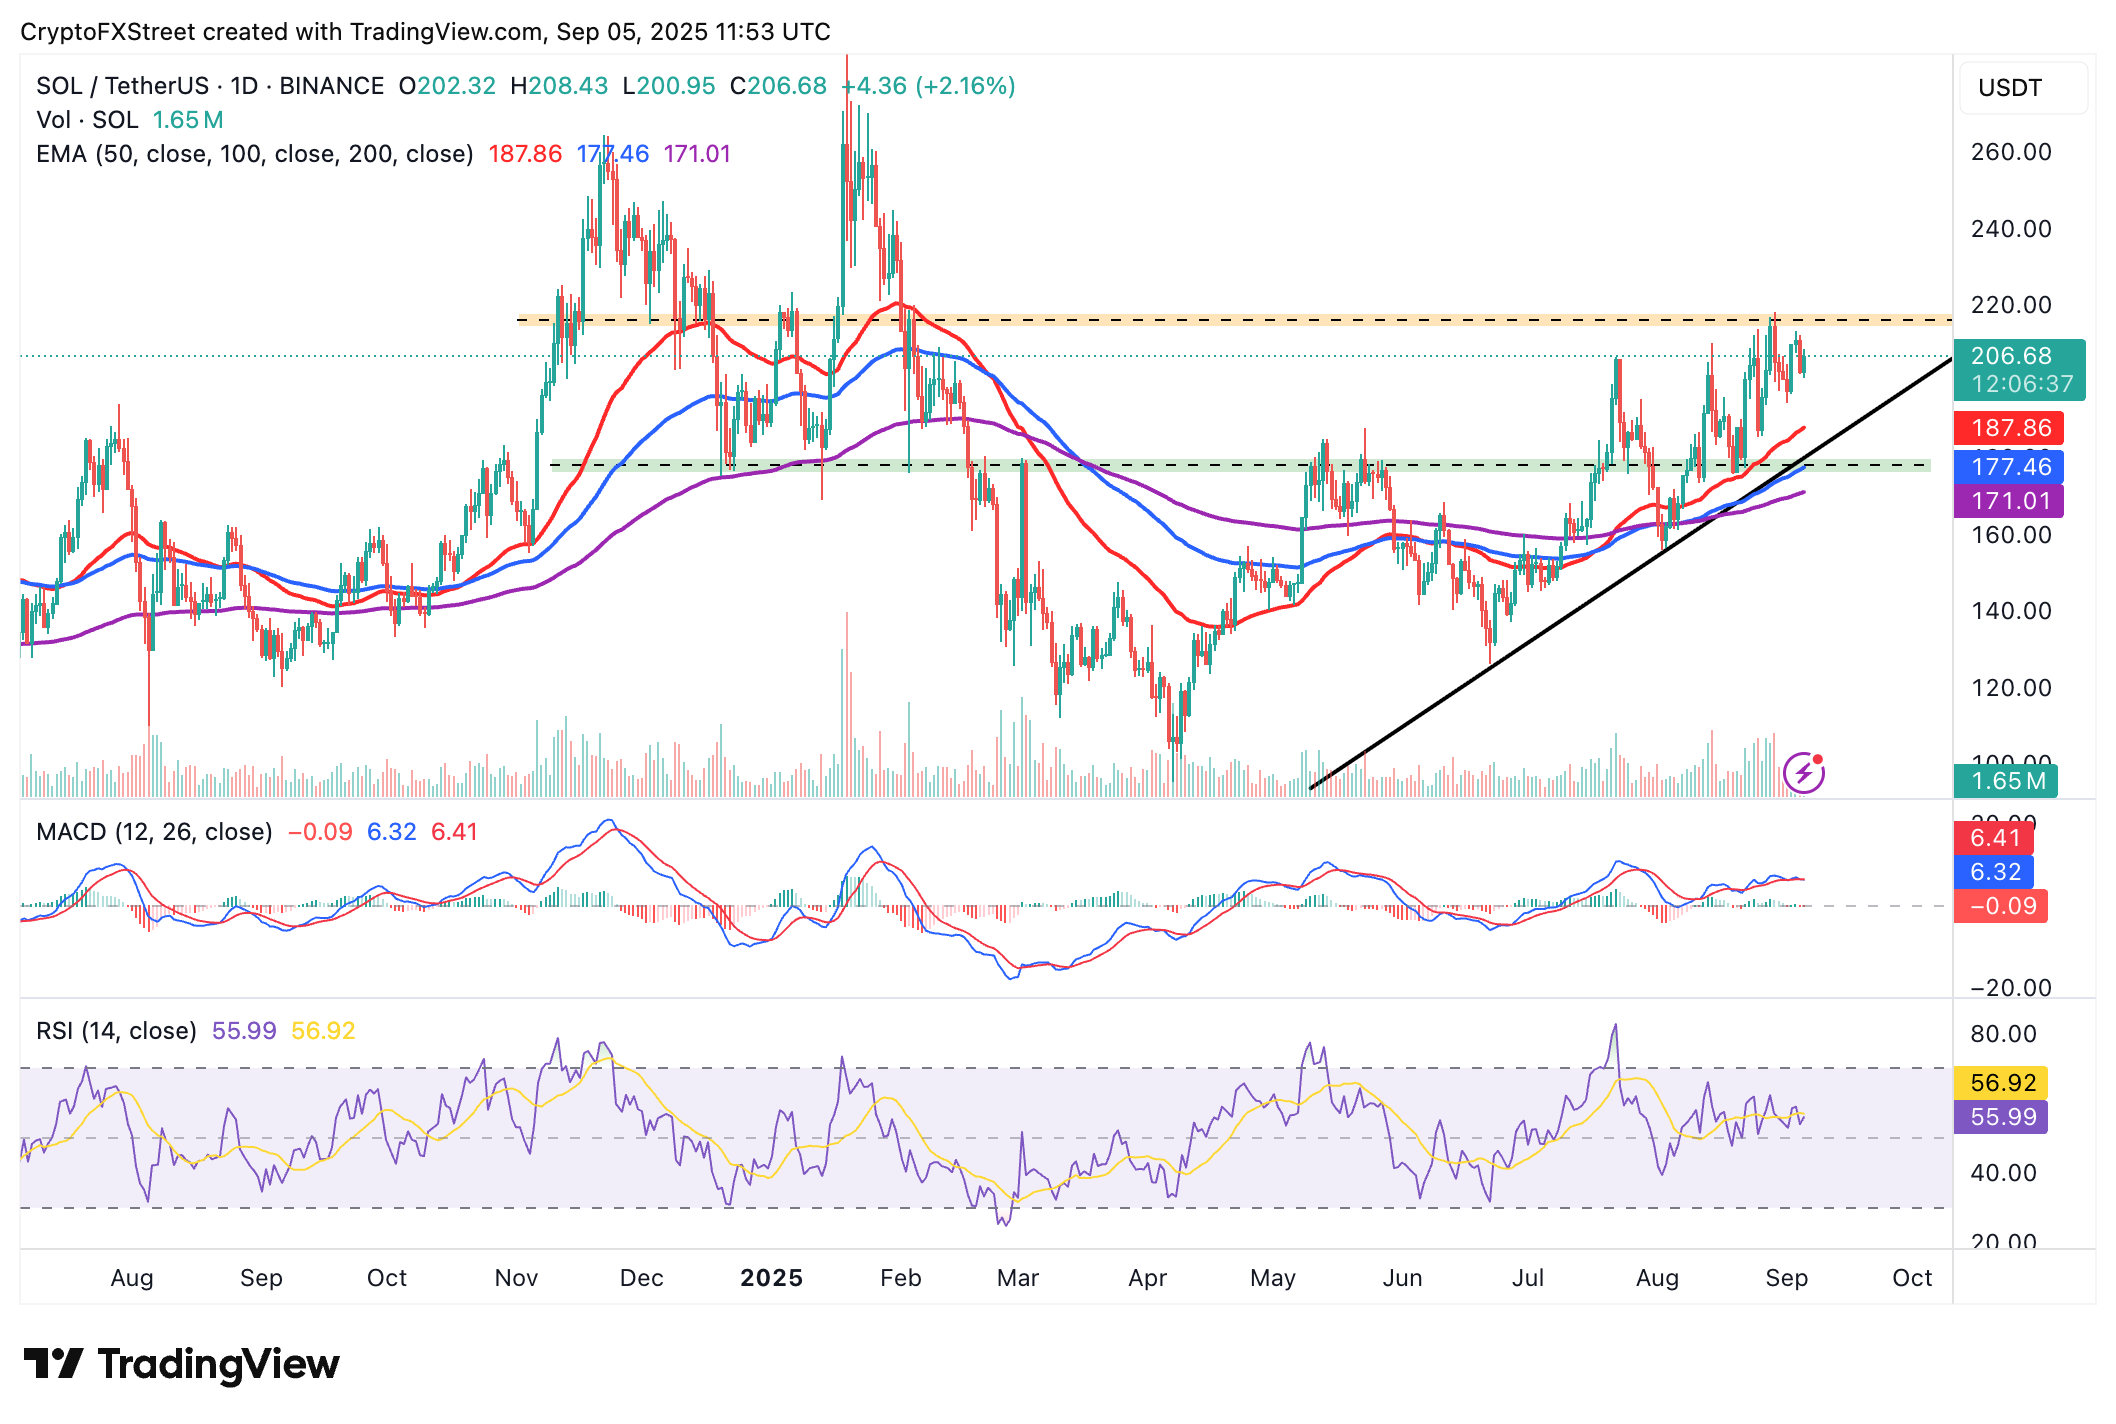
SOL/USDT daily chart
Key levels of interest for traders are the resistance at $250, the medium-term at $250 and SOL's record high of $295. Still, a correction below the $200 level cannot be ruled out yet, especially with the macro uncertainty hanging in the balance of the Fed's September interest rate decision.
Cryptocurrency prices FAQs
Token launches influence demand and adoption among market participants. Listings on crypto exchanges deepen the liquidity for an asset and add new participants to an asset’s network. This is typically bullish for a digital asset.
A hack is an event in which an attacker captures a large volume of the asset from a DeFi bridge or hot wallet of an exchange or any other crypto platform via exploits, bugs or other methods. The exploiter then transfers these tokens out of the exchange platforms to ultimately sell or swap the assets for other cryptocurrencies or stablecoins. Such events often involve an en masse panic triggering a sell-off in the affected assets.
Macroeconomic events like the US Federal Reserve’s decision on interest rates influence crypto assets mainly through the direct impact they have on the US Dollar. An increase in interest rate typically negatively influences Bitcoin and altcoin prices, and vice versa. If the US Dollar index declines, risk assets and associated leverage for trading gets cheaper, in turn driving crypto prices higher.
Halvings are typically considered bullish events as they slash the block reward in half for miners, constricting the supply of the asset. At consistent demand if the supply reduces, the asset’s price climbs.
บทความแนะนำ


