
Crypto Today: Bitcoin tests breakout zone as Ethereum, XRP consolidate on cooling futures
- Bitcoin eyes retest of descending trendline support as BTC treasuries absorb selling pressure.
- Ethereum extends consolidation as futures Open Interest cools amid decreasing retail demand.
- XRP is currently holding between the 100-day EMA support and the 50-day EMA resistance, as risk-off sentiment persists.
Bitcoin (BTC) holds above $110,000 on Thursday after its mid-week recovery was rejected at around $112,500. Ethereum (ETH) and Ripple (XRP) remain near key support levels, extending consolidation amid declining retail demand.
Data spotlight: Bitcoin treasuries accumulate despite volatility
Bitcoin treasury balances have continued to grow month-over-month (MoM) this year, indicating steady demand despite fluctuations in the price. In total, Bitcoin treasuries hold approximately 847,330 BTC valued at $93.9 billion. SoSoValue data indicates a weekly net inflow of 1,100 BTC, valued at approximately $122 million.
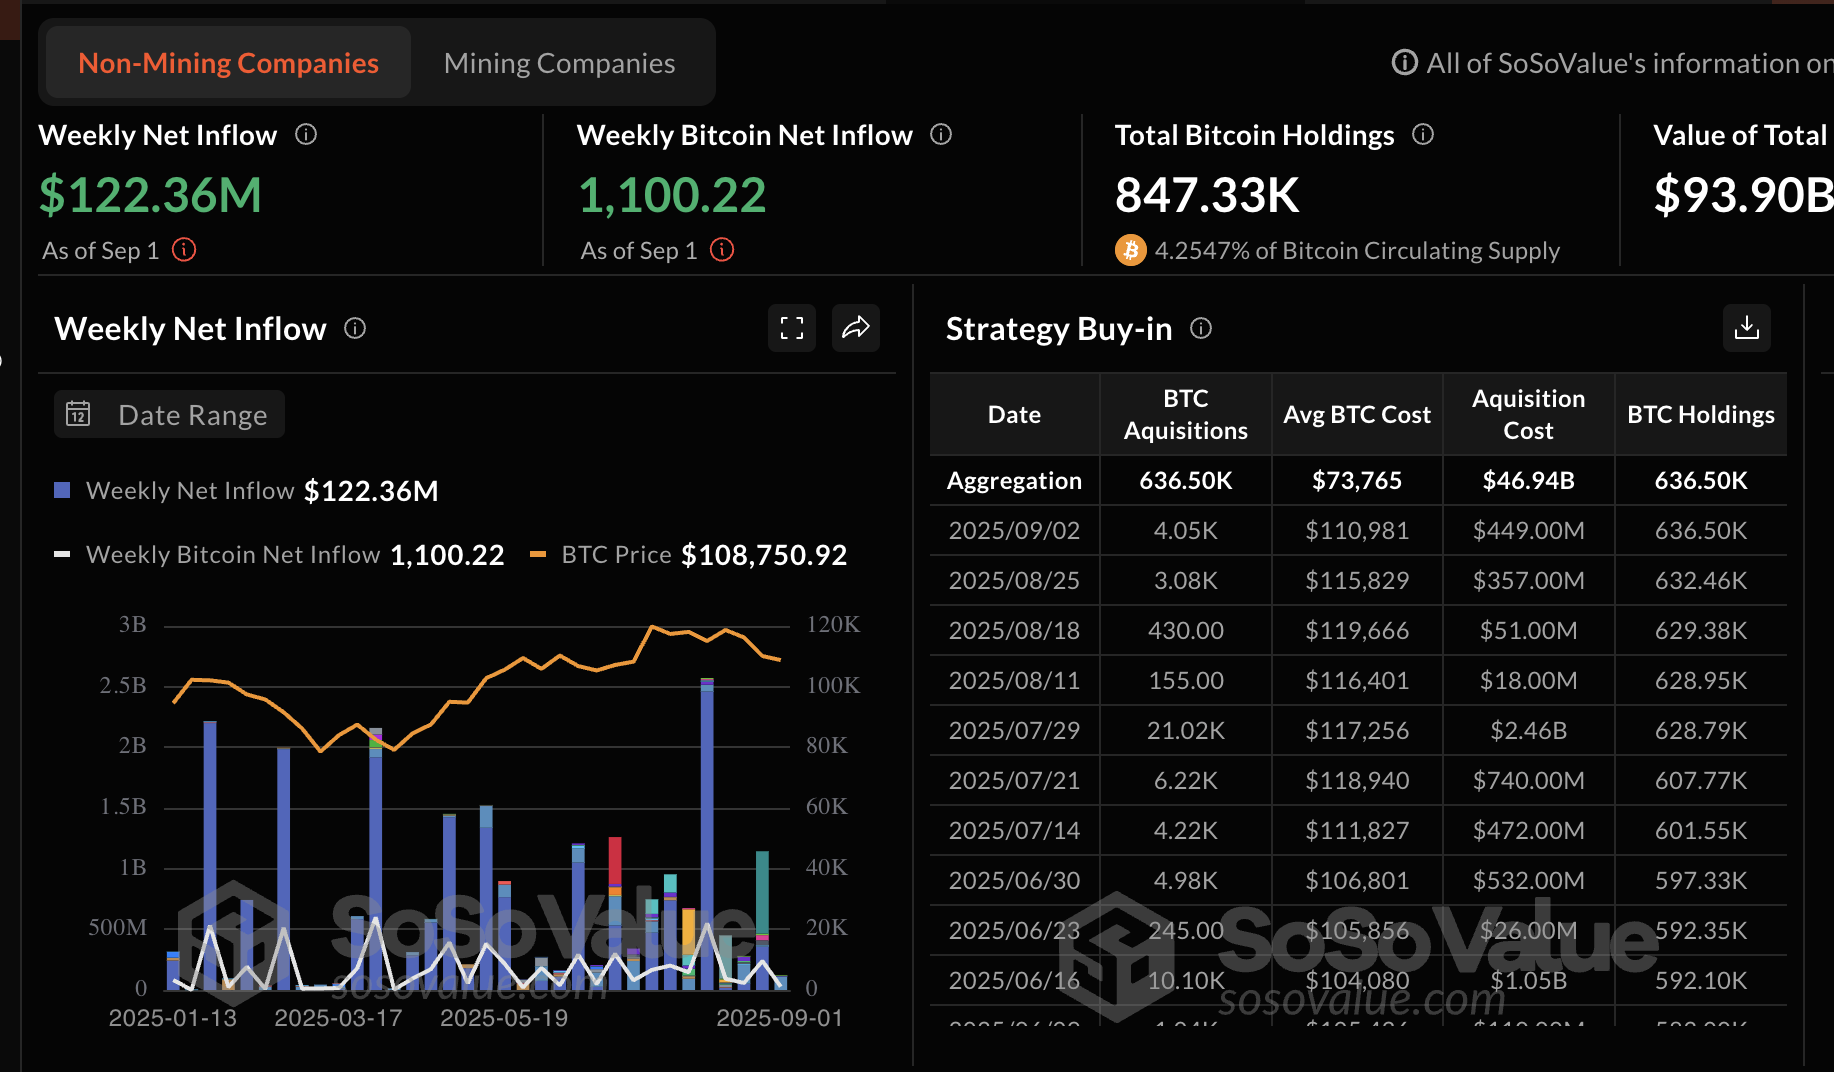
Bitcoin treasuries | Source: CoinGlass
According to Sentora, “the steady accumulation points to durable institutional conviction despite volatile market conditions.”
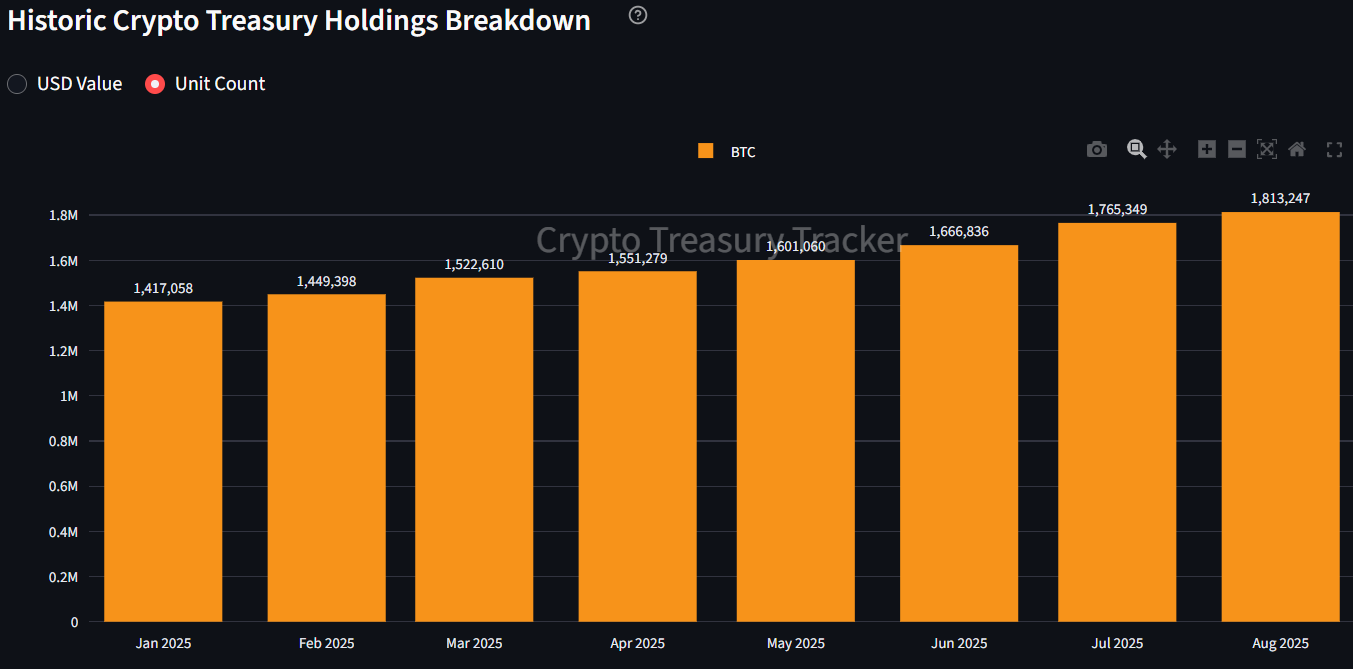
Bitcoin treasuries MoM holdings | Source: Sentora
Glassnode data indicates that investors are increasingly seeking exposure during dips, with range support at $104,000 and resistance at $116,000. However, cooling futures and demand for Exchange Traded Funds (ETFs) cap upward price action.
A breakout above the resistance level could revive the uptrend, increasing the likelihood of the BTC price surpassing $120,000. Still, a break below the $104,000 support could confirm breakdown risks toward the demand zone between $93,000 and $95,000.
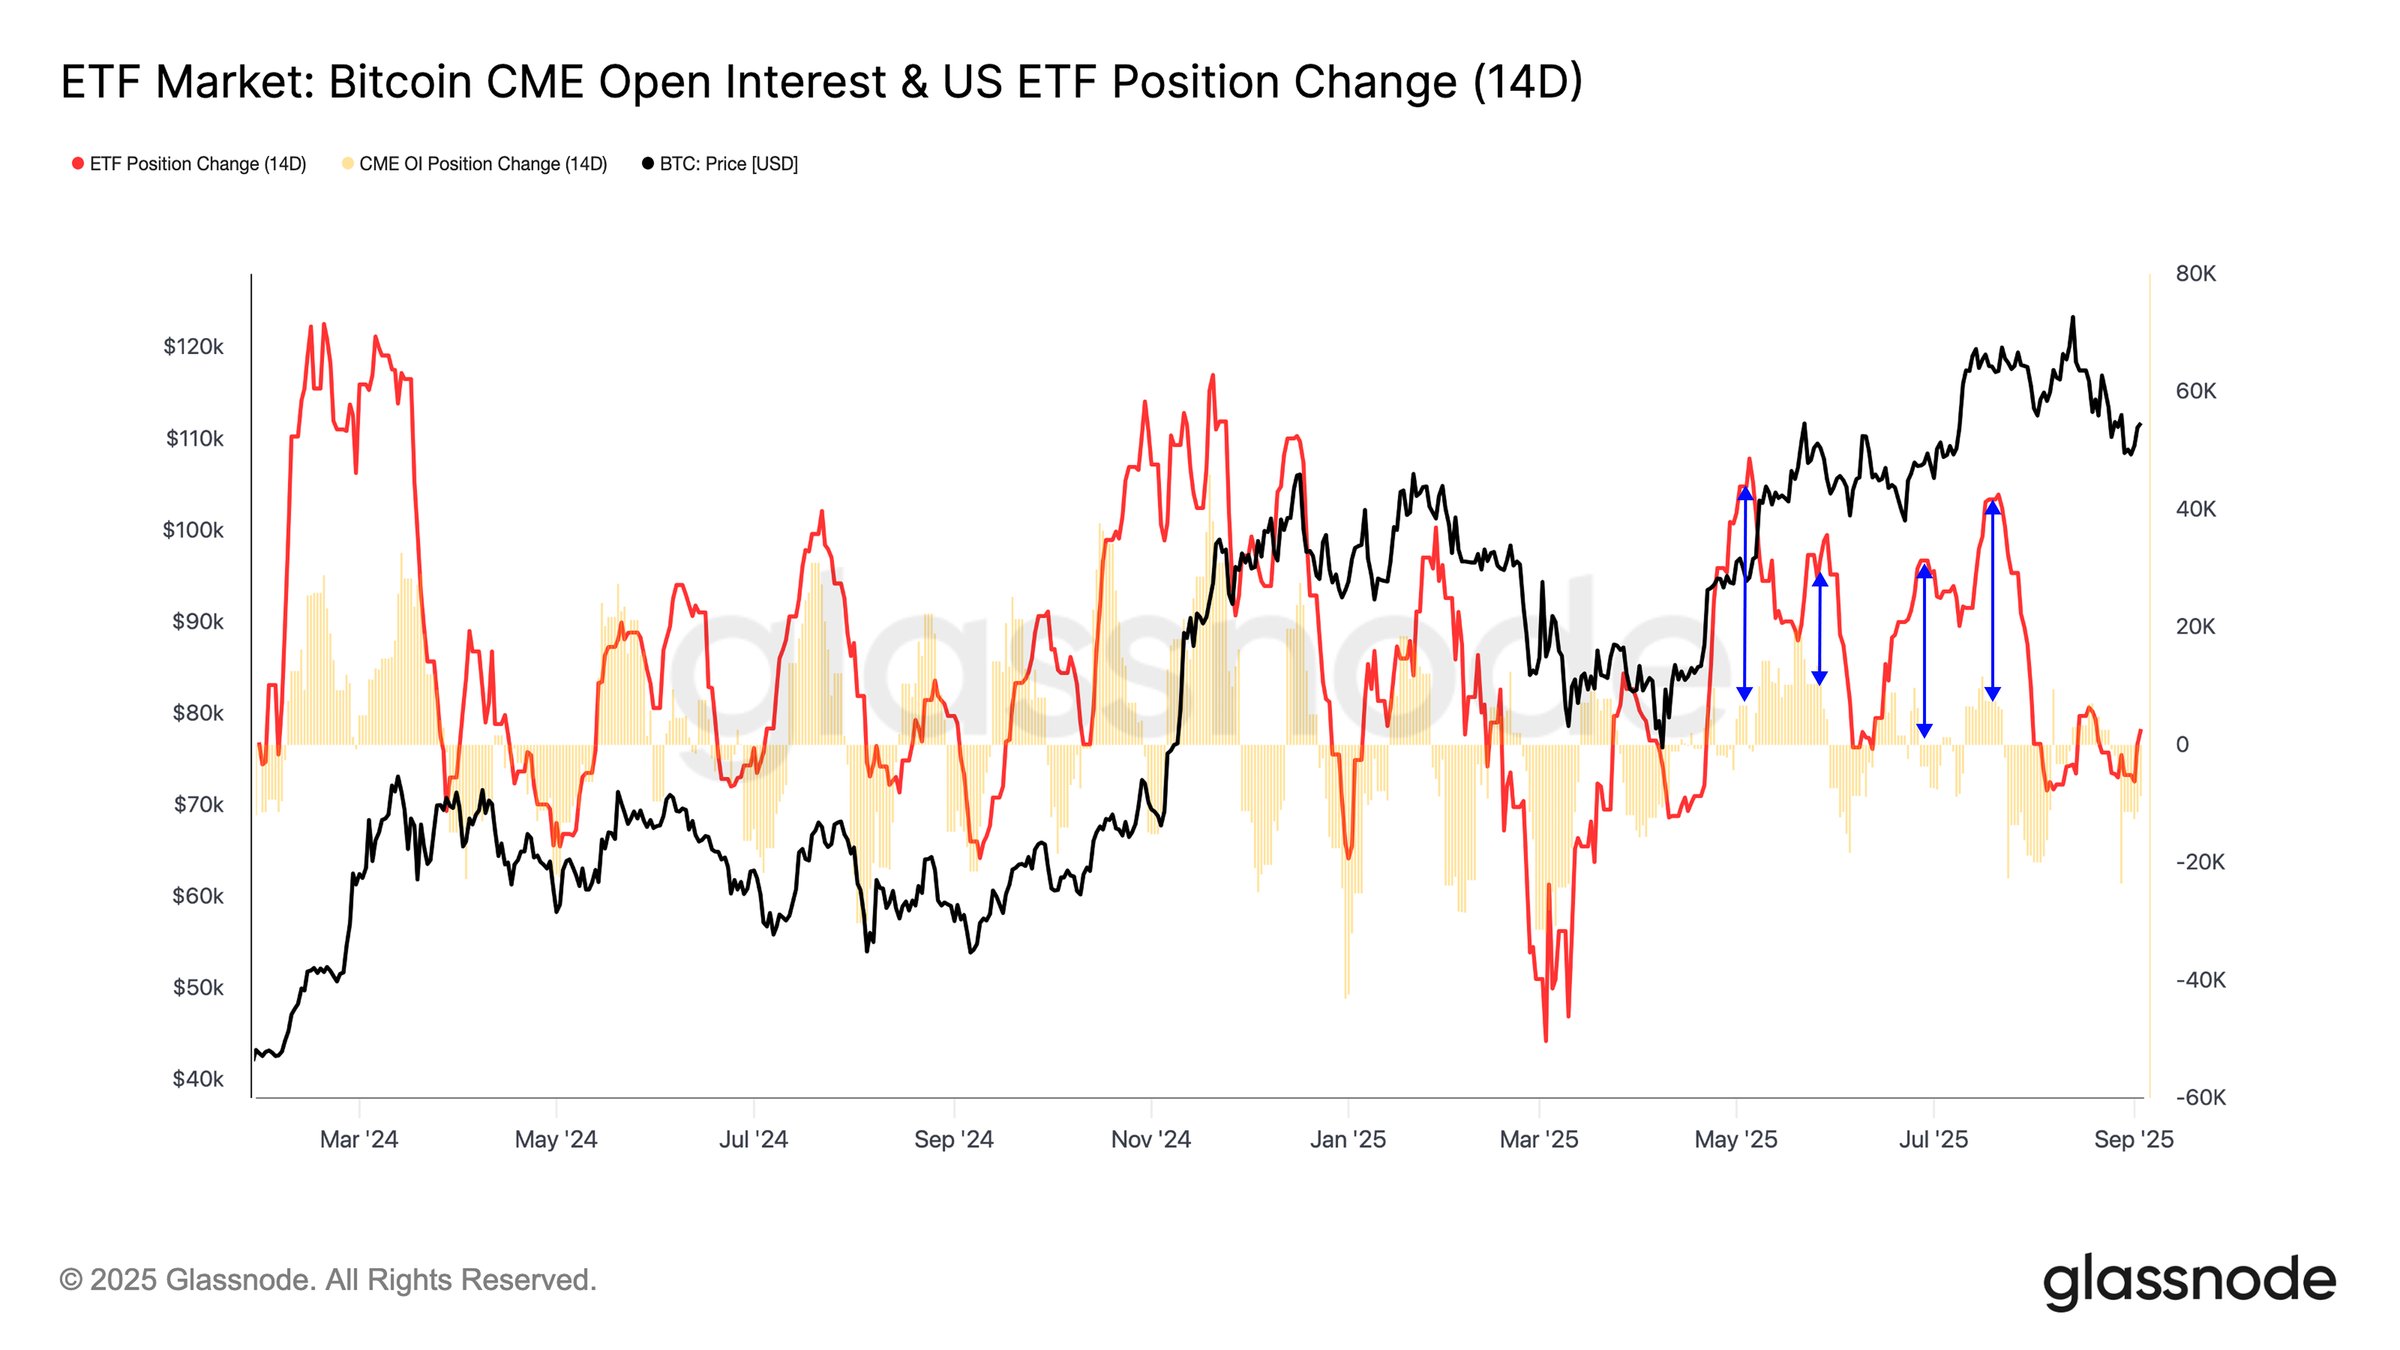
Bitcoin ETF market | Source: Glassnode
Ethereum, on the other hand, is facing a significant decline in futures Open Interest (OI), which, according to CoinGlass data, stands at $59 billion after peaking at a record high of $70 billion on August 24.
OI represents the notional value of outstanding futures. If the downtrend persists, it would mean low retail demand due to a lack of conviction in the uptrend resuming toward its record high of $4,956.
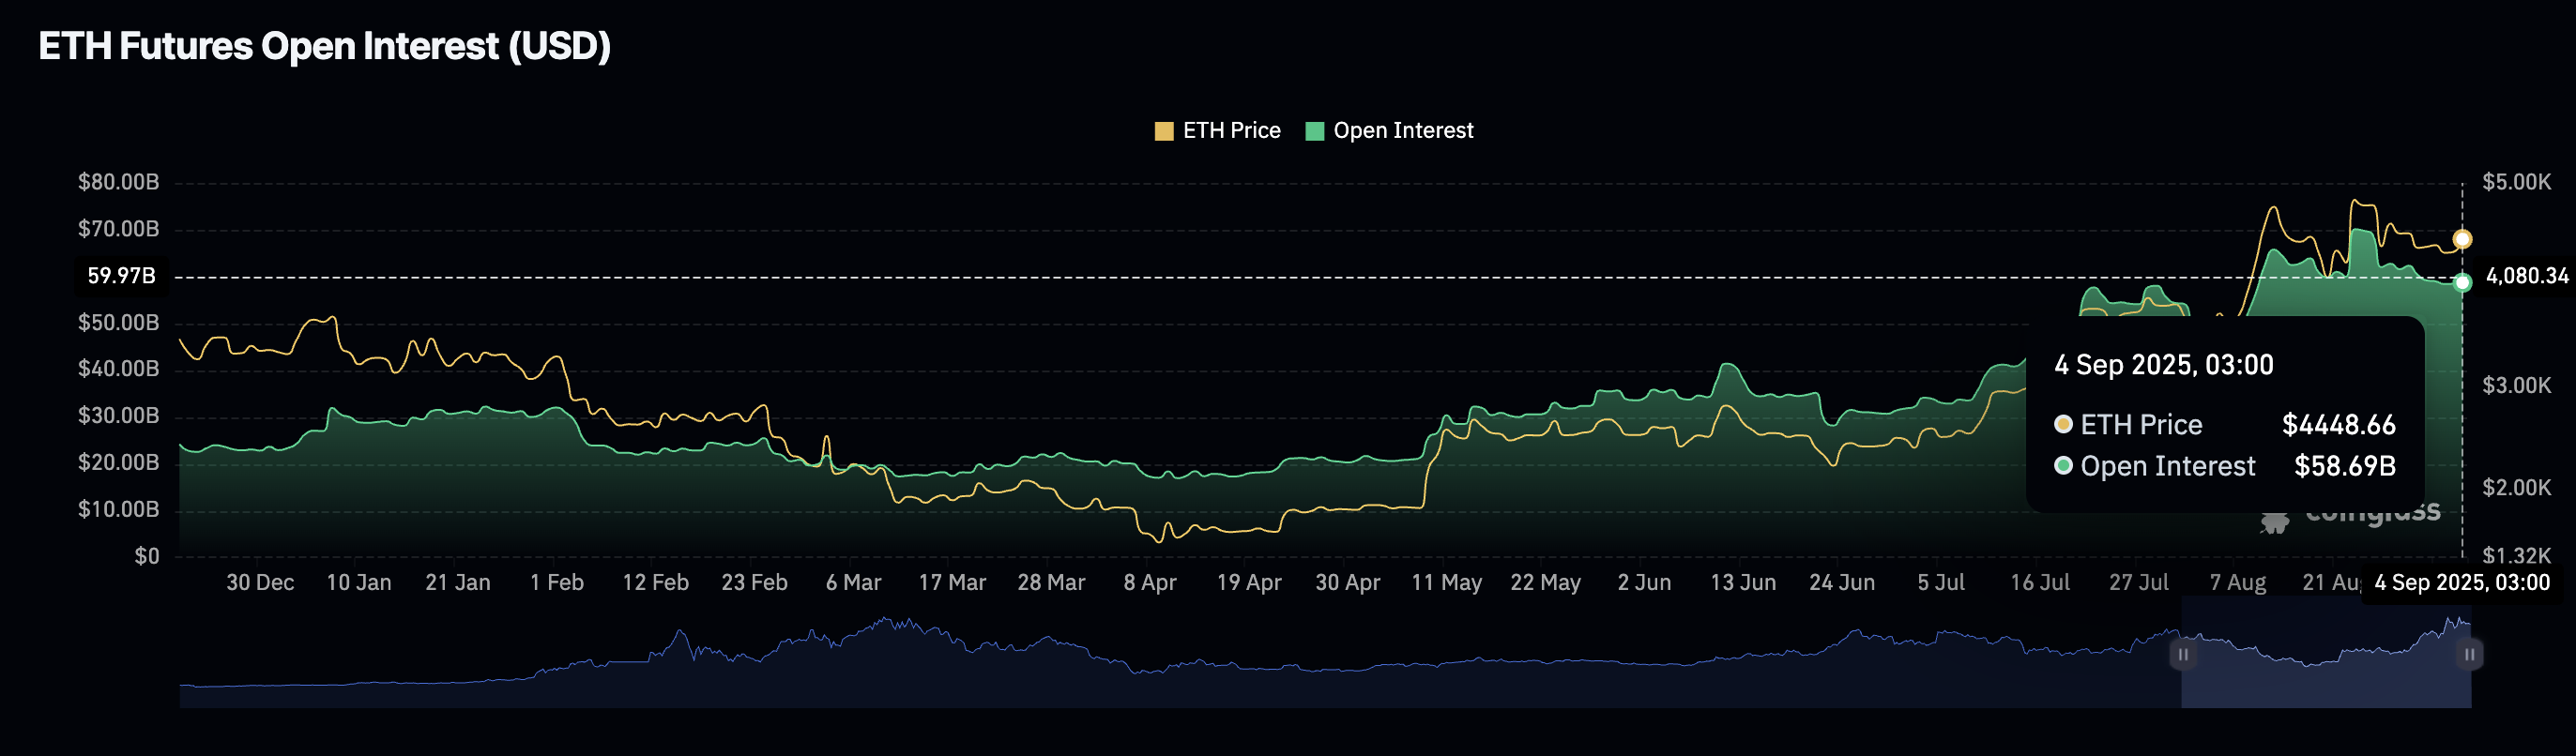
Ethereum futures Open Interest | Source: CoinGlass
XRP faces a similar situation with the futures OI falling to $7.61 billion after peaking at $10.94 billion on July 22. It would be increasingly difficult for XRP to sustain recovery amid cooling retail demand. Hence, price fluctuations may last longer than expected.
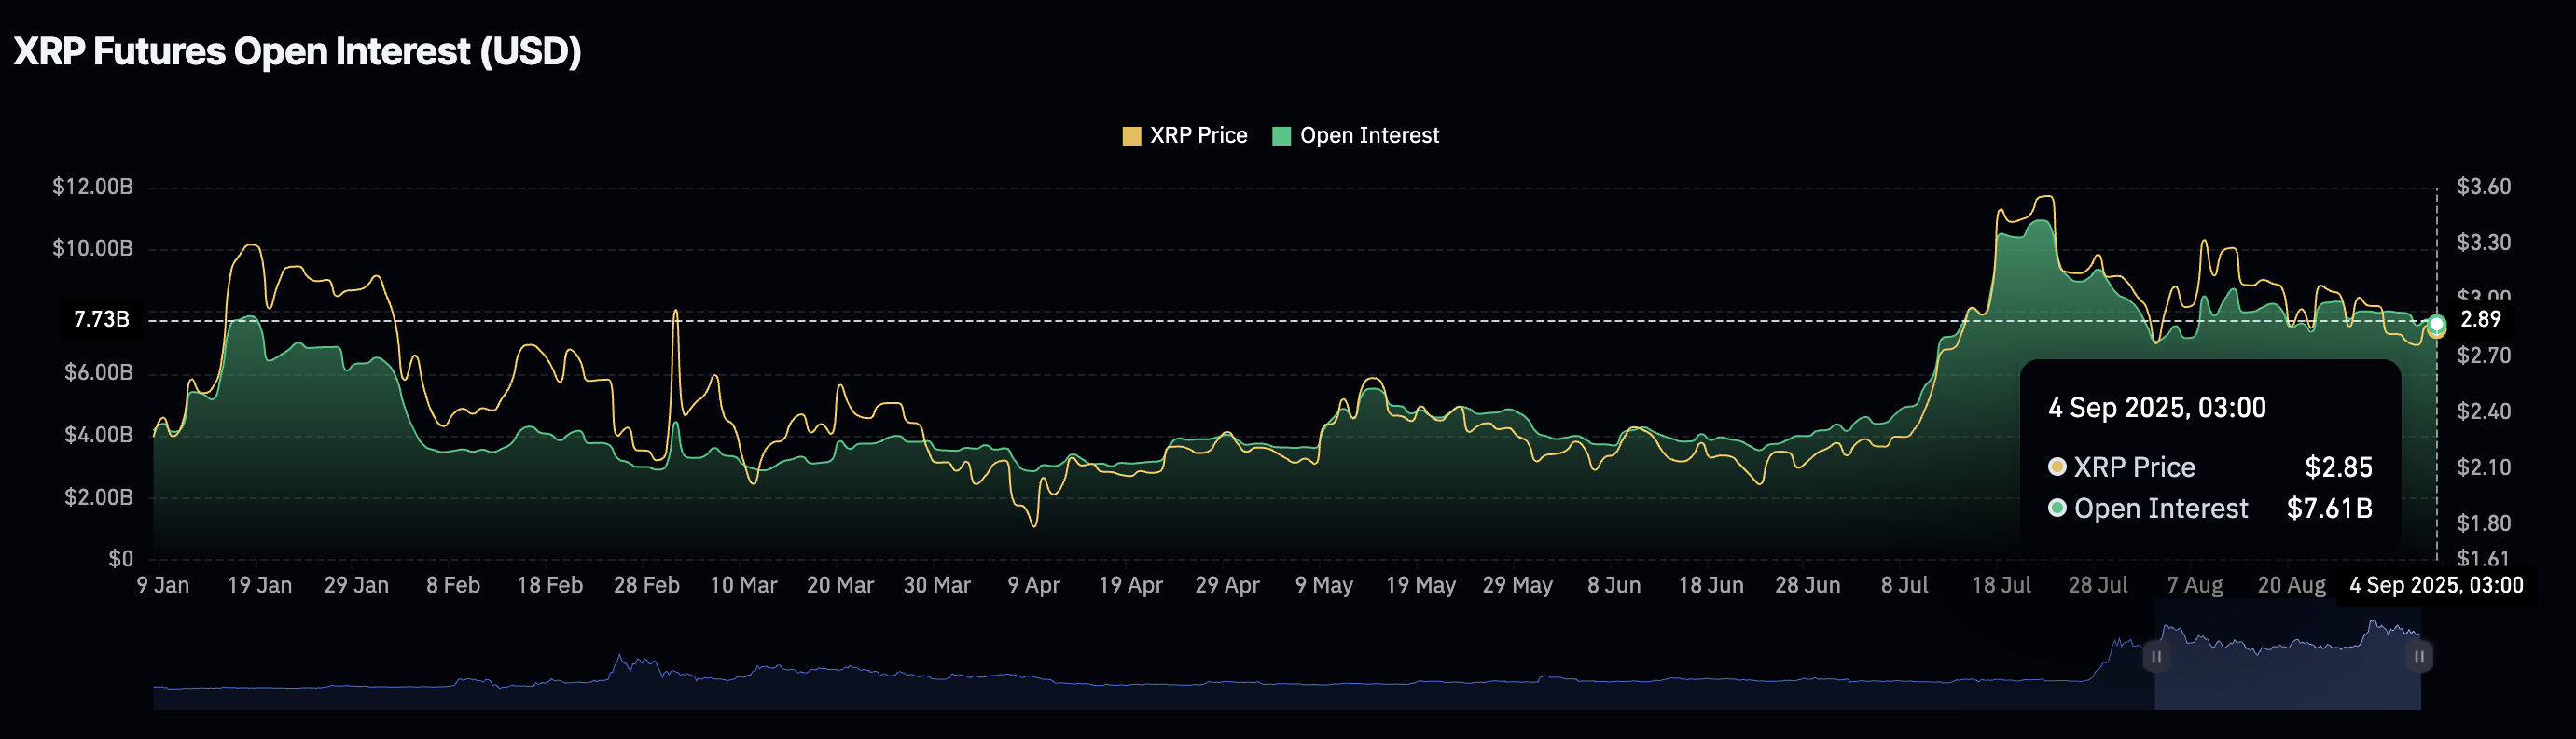
XRP futures Open Interest | Source: CoinGlass
Chart of the day: Bitcoin eyes trendline retest
Bitcoin price has recently broken above the trendline resistance but was rejected at around $112,500 on Wednesday. The price is currently positioned above the 100-day Exponential Moving Average (EMA) support at $110,736.
A correction below the moving average could see Bitcoin retest the trendline support, potentially confirming the breakout toward the $116,000 round-figure target and the critical $120,000 level.
The Relative Strength Index (RSI) at 44 backs the cooling in demand. As the RSI drops, buying pressure dwindles, leaving BTC susceptible to further declines. A persistent decline could prompt traders to shift their attention to the 200-day EMA at $104,314 as a potential support level.
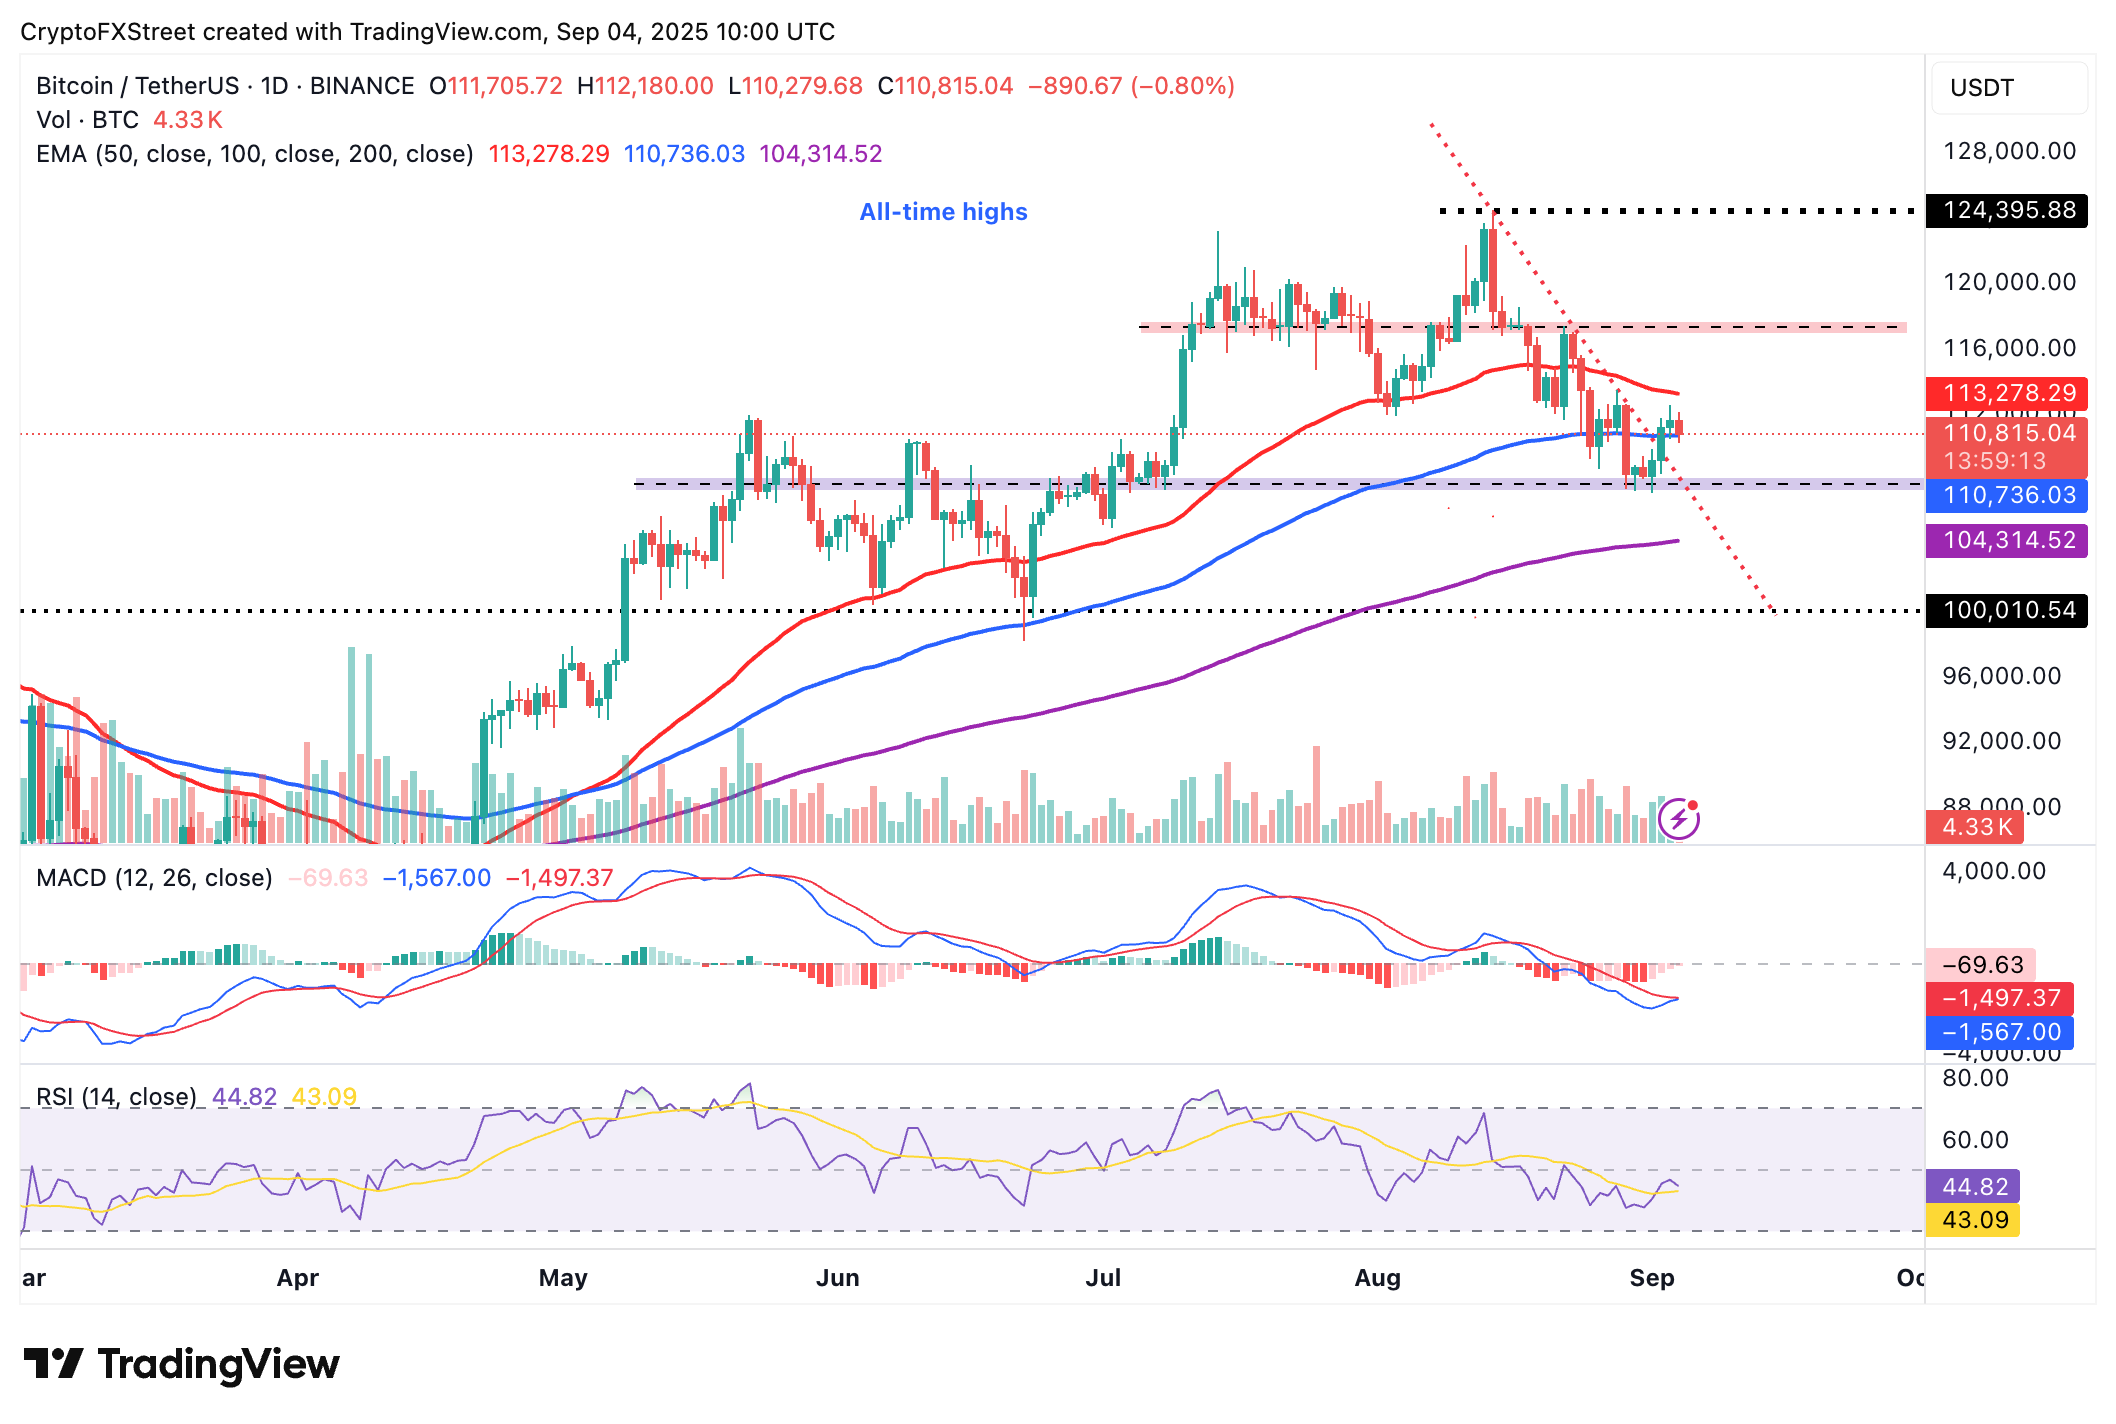
BTC/USDT daily chart
Altcoins update: Ethereum, XRP extend consolidation
Ethereum holds above $4,300 after bulls lost momentum below the $4,500 level on Wednesday. Based on the prevailing technical picture, the path with the least resistance remains downward, reflecting risk-off sentiment in the derivatives market.
The MACD indicator has maintained a sell signal since August 25, encouraging traders to de-risk, anticipating the price to fall further before gaining momentum for a steady recovery toward its record high of $4,956.
Traders should monitor the ETH price reaction to the ascending trendline illustrated on the daily chart below. The price has since bounced off this trendline in early July, signalling a potential reversal if tested. Other key support levels include the 50-day EMA at $4,044 and the 100-day EMA at $3,566.
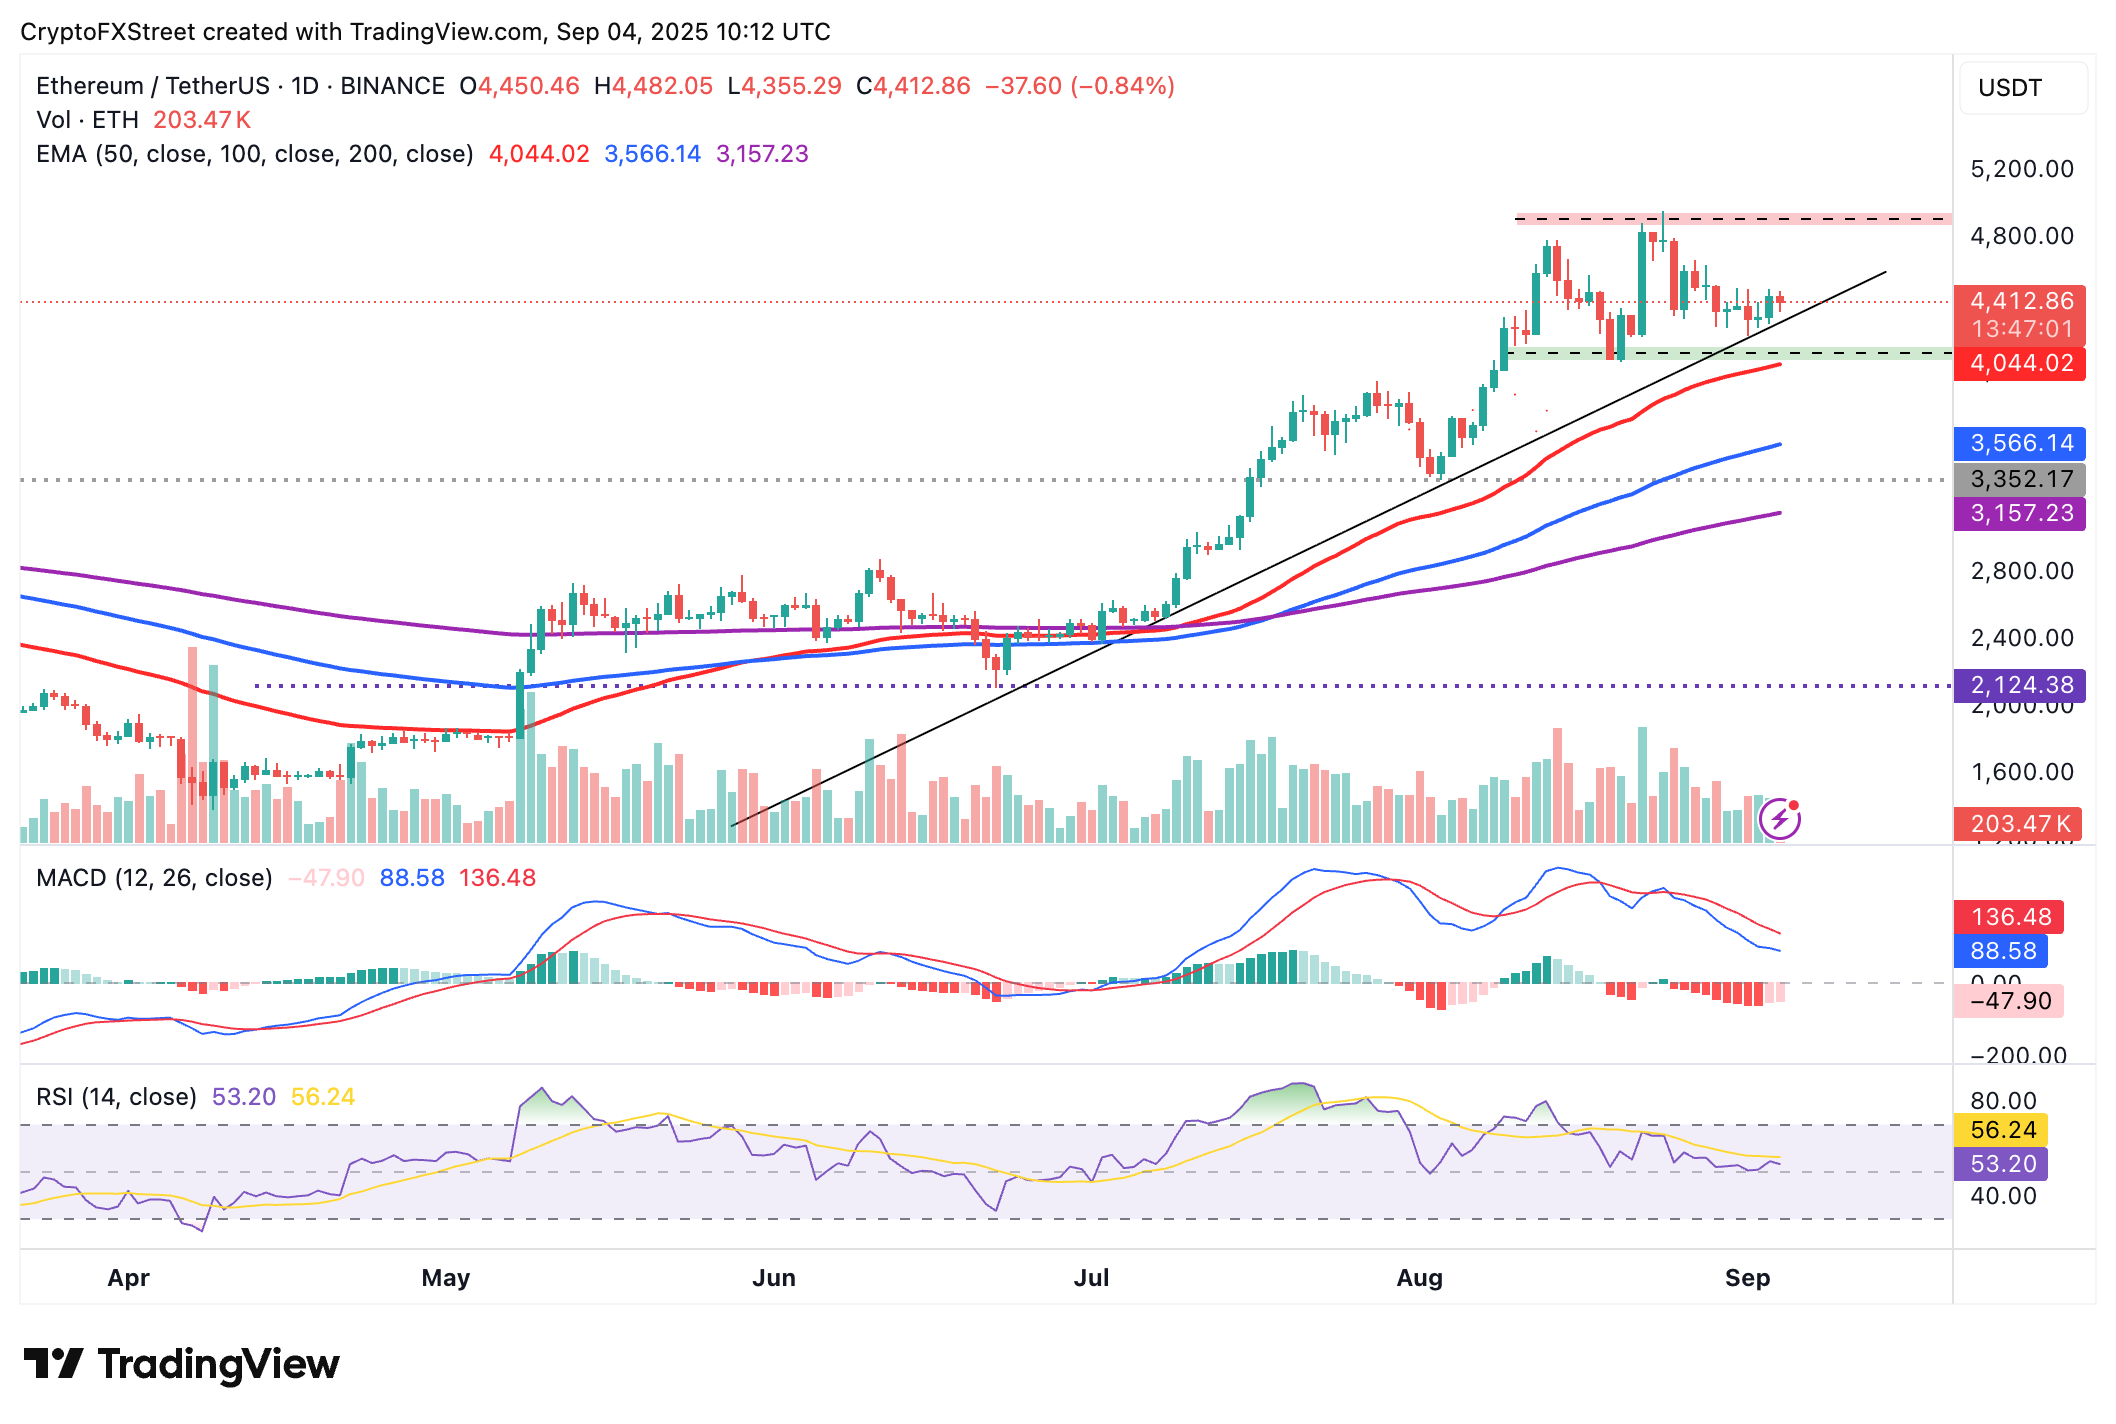
ETH/USDT daily chart
As for XRP, its current position between the 100-day EMA support at $2.77 and the 50-day EMA resistance at $2.91 points to a prolonged consolidation period ahead of the next breakout. A sell signal from the MACD indicator since July 25 hints at the downtrend continuing toward the 200-day EMA support at $2.51.
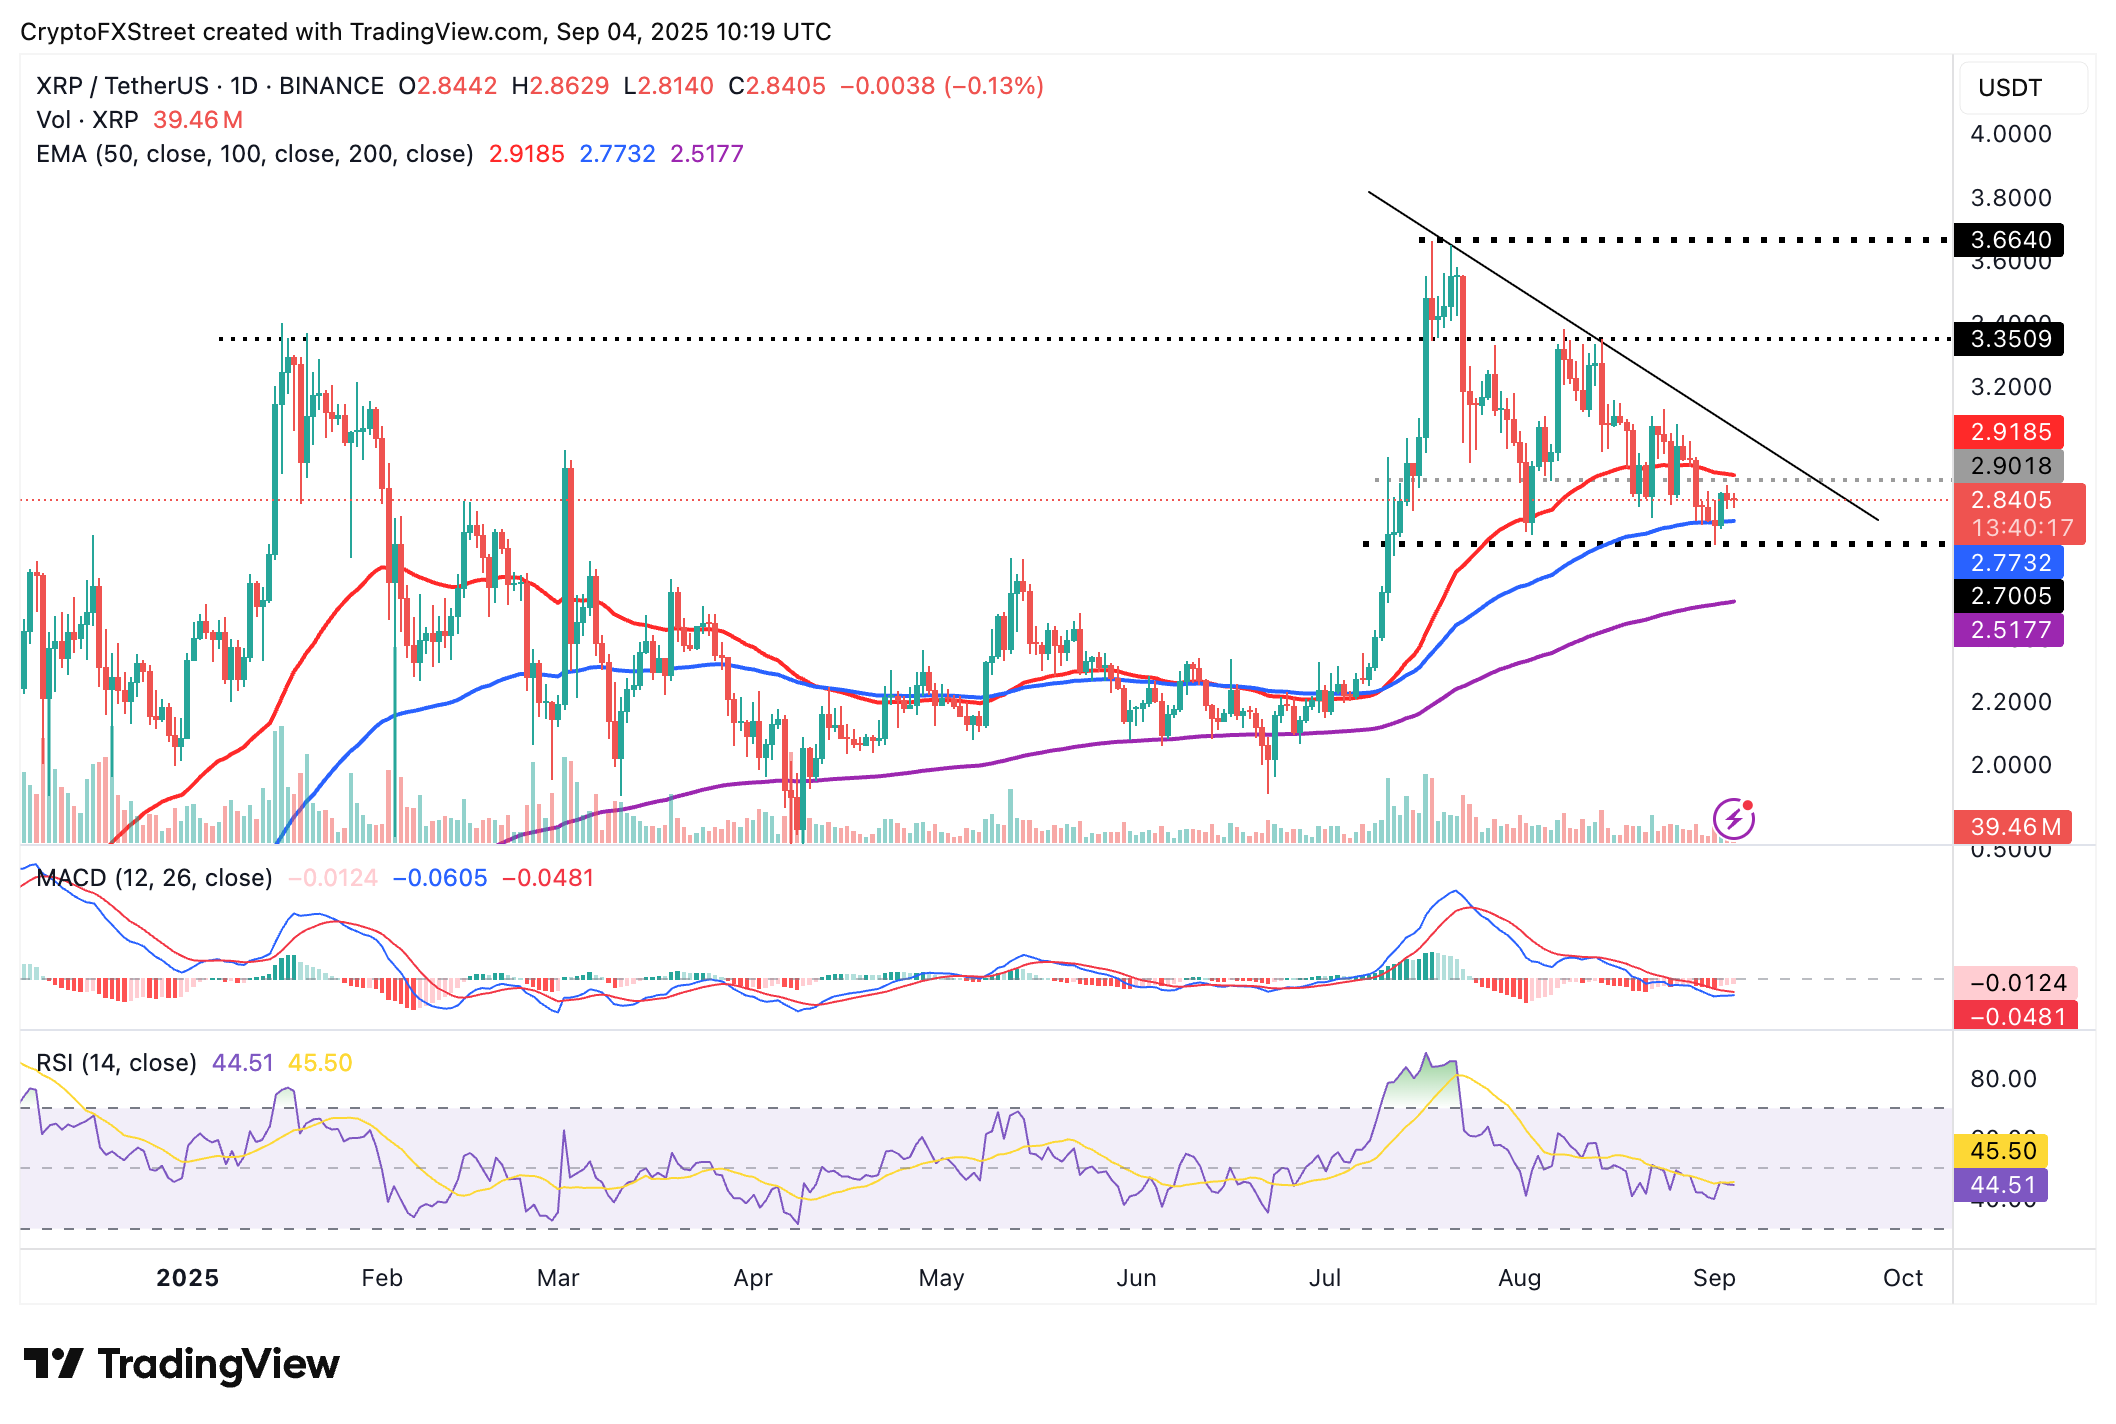
XRP/USDT daily chart
Still, the RSI’s stability at 44 reflects the tug-of-war between the bulls and the bears. If the RSI rises above the midline, buying pressure will surge, increasing the chances of XRP reclaiming the $3.00 support level.
Bitcoin, altcoins, stablecoins FAQs
Bitcoin is the largest cryptocurrency by market capitalization, a virtual currency designed to serve as money. This form of payment cannot be controlled by any one person, group, or entity, which eliminates the need for third-party participation during financial transactions.
Altcoins are any cryptocurrency apart from Bitcoin, but some also regard Ethereum as a non-altcoin because it is from these two cryptocurrencies that forking happens. If this is true, then Litecoin is the first altcoin, forked from the Bitcoin protocol and, therefore, an “improved” version of it.
Stablecoins are cryptocurrencies designed to have a stable price, with their value backed by a reserve of the asset it represents. To achieve this, the value of any one stablecoin is pegged to a commodity or financial instrument, such as the US Dollar (USD), with its supply regulated by an algorithm or demand. The main goal of stablecoins is to provide an on/off-ramp for investors willing to trade and invest in cryptocurrencies. Stablecoins also allow investors to store value since cryptocurrencies, in general, are subject to volatility.
Bitcoin dominance is the ratio of Bitcoin's market capitalization to the total market capitalization of all cryptocurrencies combined. It provides a clear picture of Bitcoin’s interest among investors. A high BTC dominance typically happens before and during a bull run, in which investors resort to investing in relatively stable and high market capitalization cryptocurrency like Bitcoin. A drop in BTC dominance usually means that investors are moving their capital and/or profits to altcoins in a quest for higher returns, which usually triggers an explosion of altcoin rallies.
บทความแนะนำ


