
Sui Price Forecast: SUI Group adds 20 million tokens to treasury, pushing holdings above 100 million
- Sui price consolidates within a falling wedge pattern, with a breakout likely to ignite a rally.
- SUI Group Holdings Limited increases its treasury by 20 million SUI, bringing total holdings to over 100 million.
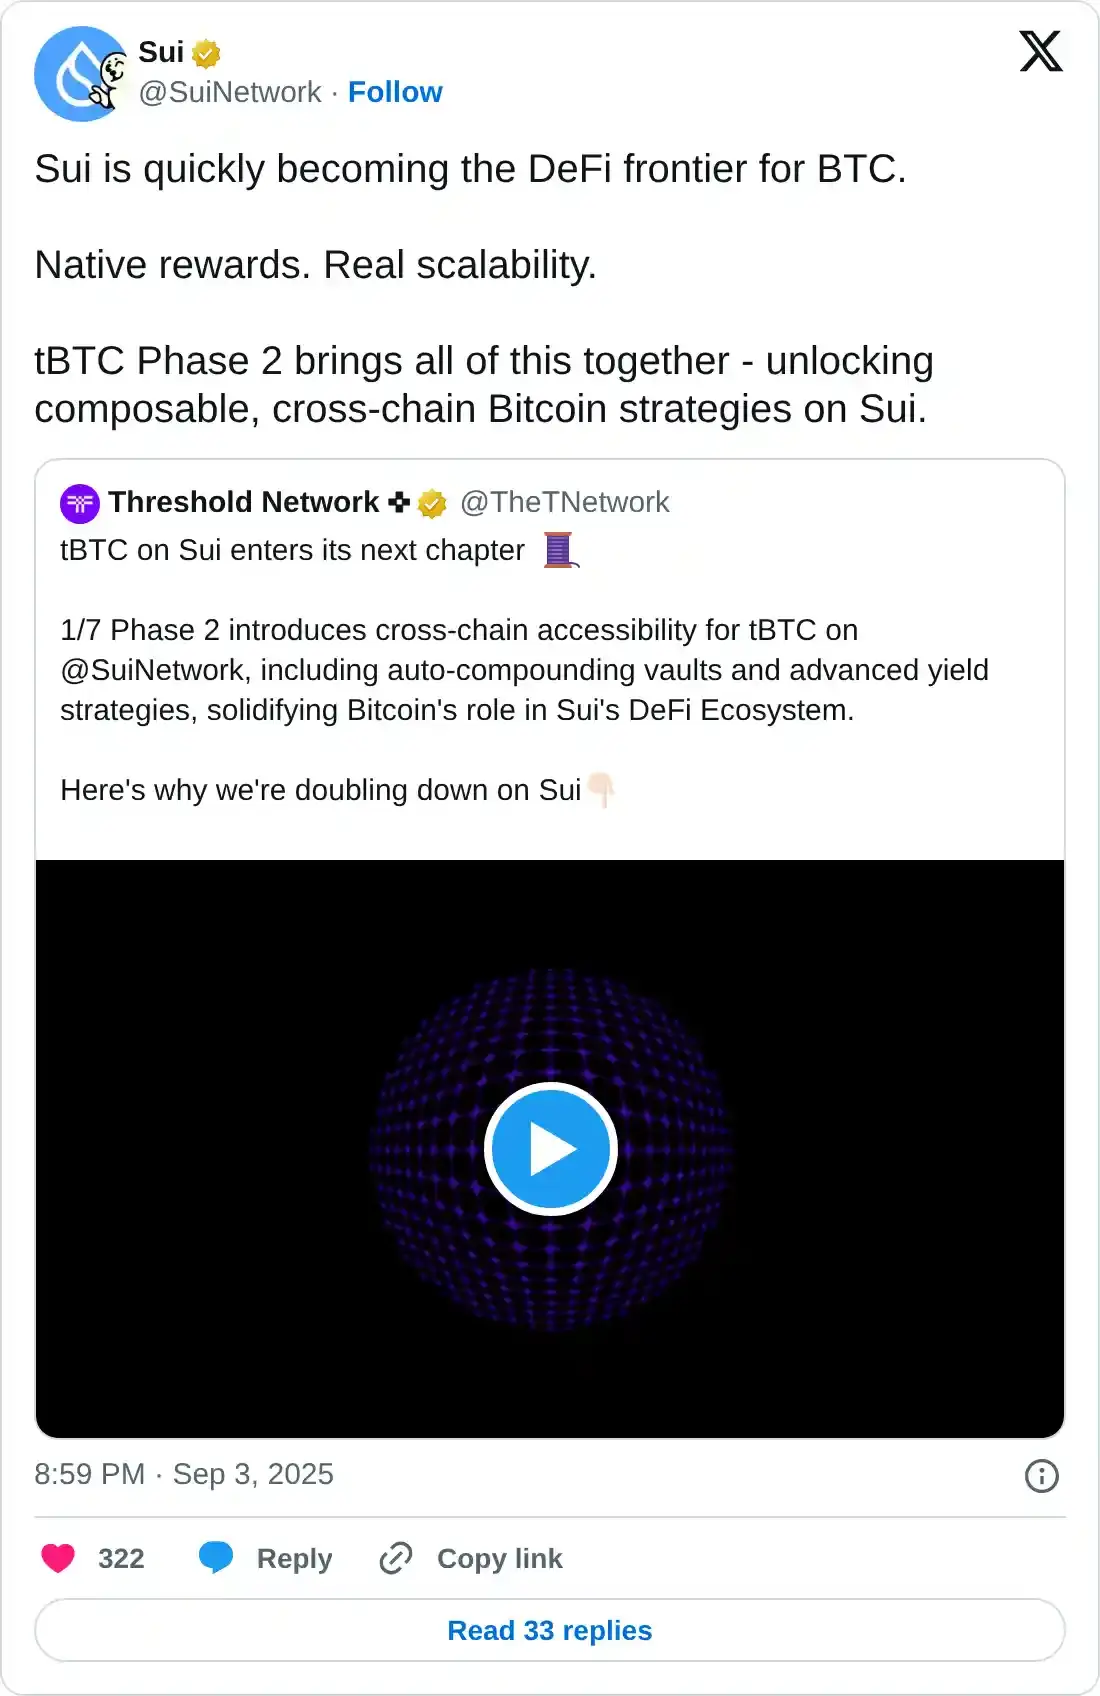
- On-chain data highlight rising weekly transactions, while Phase 2 of tBTC on Sui supports the next wave of Bitcoin DeFi activity.
Sui (SUI) price is consolidating within a falling wedge pattern at around $3.34 on Thursday, indicating a potential breakout as bullish catalysts accumulate. SUI Group Holdings Limited (SUI Group) has added 20 million tokens to its treasury, lifting total holdings above 100 million tokens, while on-chain data indicate rising weekly transactions. Additionally, the launch of Phase 2 of tBTC on Sui is fueling optimism for the next wave of Bitcoin Decentralized Finance (DeFi) activity on the network.
SUI Group’s total treasury holdings exceed 100 million
SUI Group Holding Limited (SUIG), the only publicly traded company with an official relationship with the Sui Foundation, announced on Tuesday that it has added 20 million SYU tokens to its treasury, bringing its total holdings to over 100 million, valued at more than $300 million.
“We plan to continue to seek accretive capital raises to make additional purchases of discounted locked SUI and, in turn, increase our SUI per share to generate value for our shareholders,” said Stephen Mackintosh, Chief Investment Officer of SUI Group.
This news announcement is bullish for the SUI token in the long term, as it signals institutional confidence and reduces the circulating supply of SUI tokens in the market, thereby increasing its demand and prices.
Examining the on-chain data provides further support for the bullish outlook. Artemis Terminal data show that weekly transactions reached $47.9 million in the last week of August, the highest weekly level since April, suggesting renewed network activity and growing user participation.
-1756963219102-1756963219104.jpeg)
Sui transactions chart. Source: Artemis Terminal
Apart from rising transactions, Sui’s expanding partnerships and ongoing developments also support the bullish view. Threshold Network has deepened its Bitcoin integration on Sui with the launch of Phase 2 of tBTC, following strong adoption in Phase 1. In its initial phase, Bitcoin rapidly grew to account for 20% of Sui’s Total Value Locked (TVL), with $10 million in tBTC supplied on Alphalend and over $2.8 million in liquidity added. Now, with Phase 2 underway, Bitcoin DeFi on Sui is accelerating, setting the stage for the next wave of adoption and cross-chain activity.
Sui Price Forecast: SUI could rally if it breaks above the falling wedge pattern
Sui price trades within the falling wedge pattern (drawn by connecting multiple highs and lows with two trendlines since mid-July). A breakout of this pattern generally favors the bulls. SUI price found support around its 50% price retracement level at $3.08, which roughly coincides with the lower trendline boundary of the wedge pattern on Monday and recovered 6% in the next two days. At the time of writing on Thursday, it trades around $3.34.
If SUI breaks above the upper boundary of the wedge pattern and closes above the daily resistance at $3.65, it could extend the rally toward its July 28 high of $4.44.
The Relative Strength Index (RSI) on the daily chart reads 44, nearing its neutral level of 50, indicating a fading of bearish momentum. The Moving Average Convergence Divergence (MACD) lines are also nearing each other with decreasing red histogram bars, suggesting a bullish crossover could happen in the coming sessions.
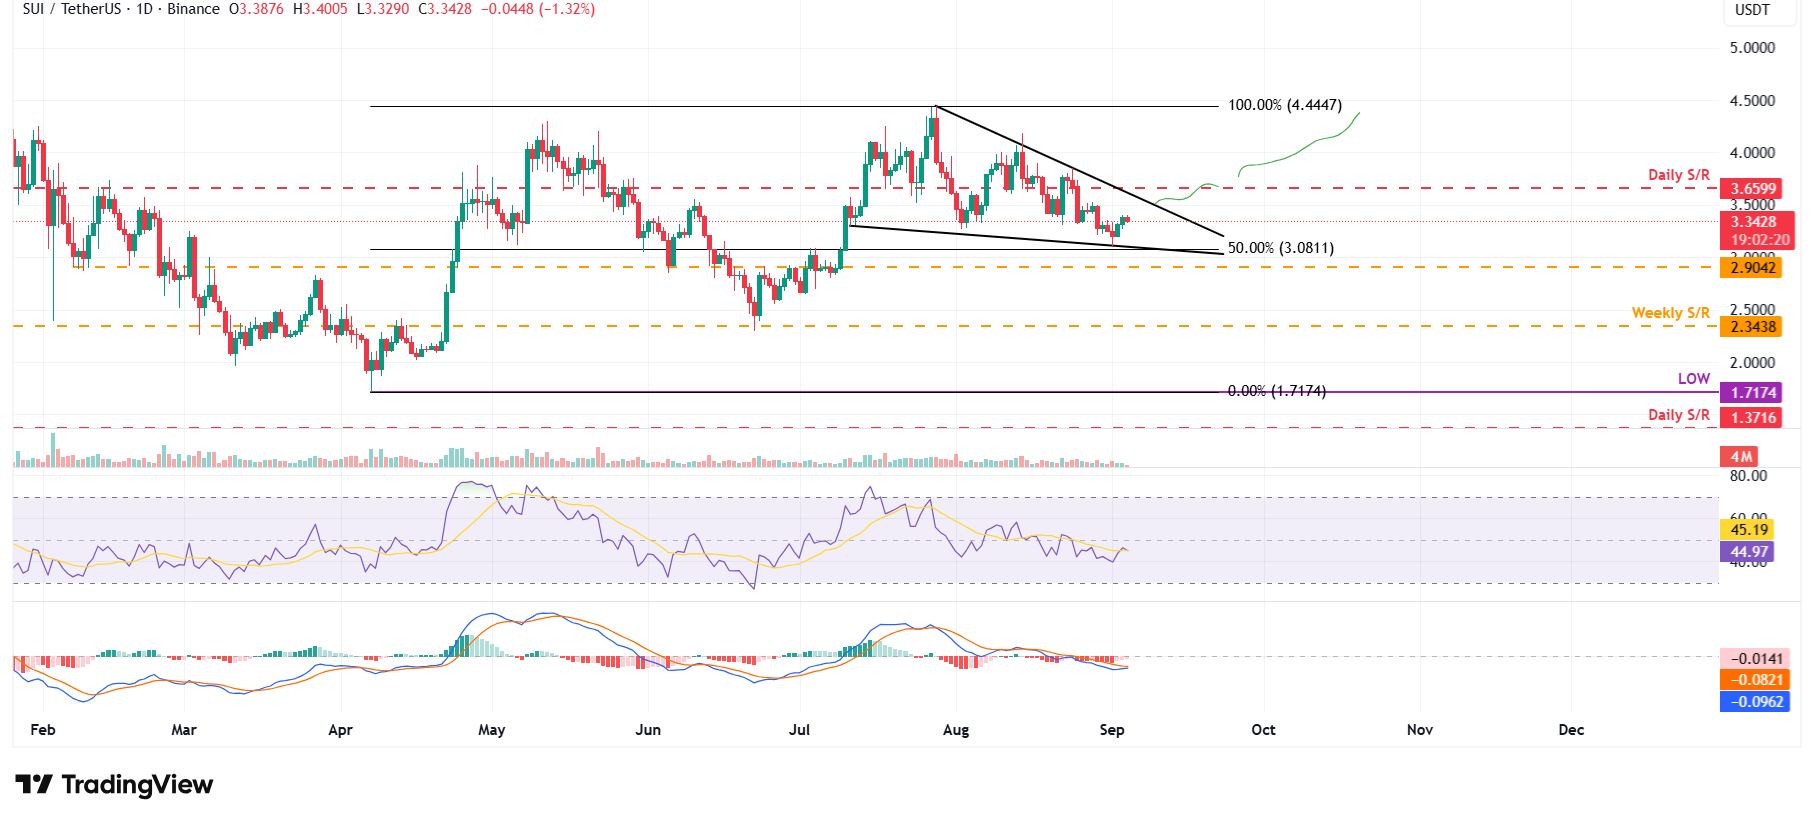
SUI/USDT daily chart
However, if SUI faces a correction, it could extend the decline to find support around its 50% price retracement level at $3.08.
บทความแนะนำ


