
Ondo Price Forecast: ONDO eyes 15% breakout ahead of tokenized stocks launch
- Ondo rebounds amid subtle relief gains in the broader cryptocurrency market; targets highs above $1.00.
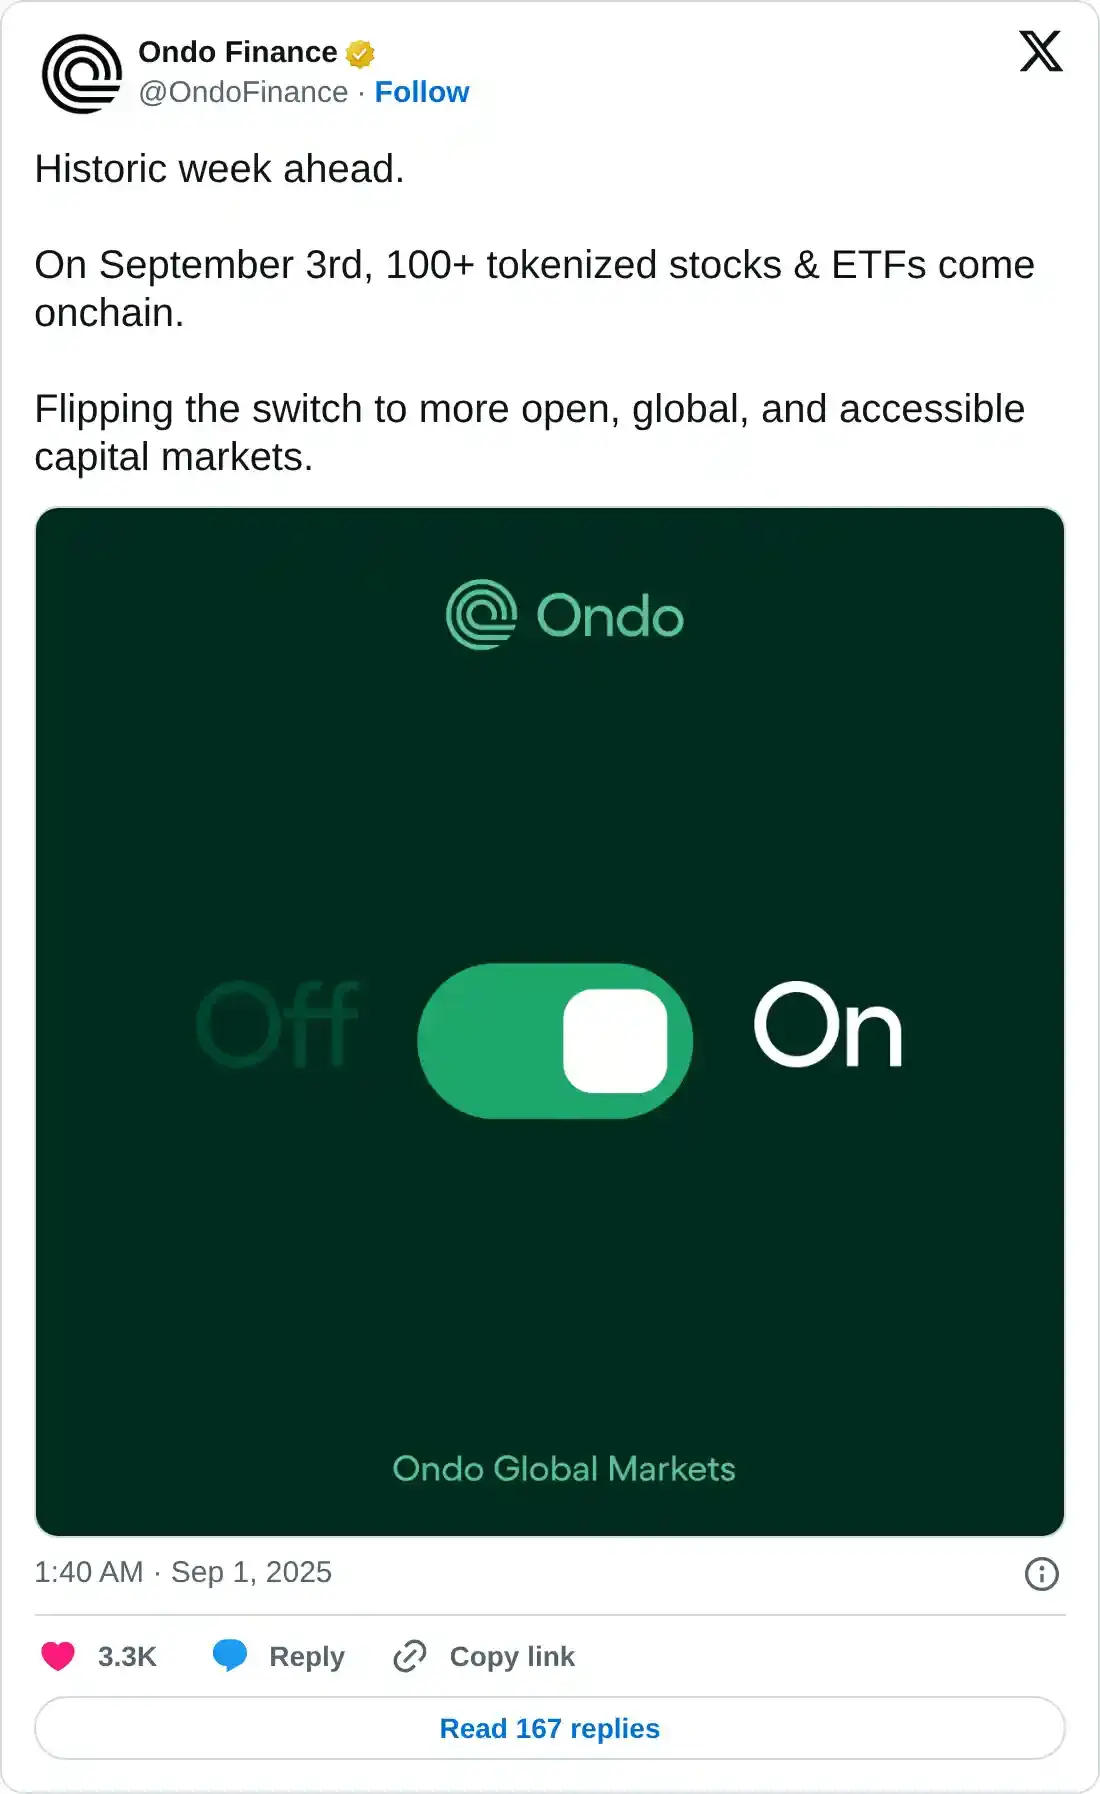
- Ondo Finance will launch over tokenized stocks and ETFs on-chain on Wednesday.
- Ondo Finance's plan for tokenizing RWAs aligns with the US SEC's goal of unifying securities and non-security crypto assets.
Ondo (ONDO) edges higher, reflecting a widespread recovery in the broader cryptocurrency market on Tuesday. The token backing Ondo Finance, a real-world assets (RWAs) tokenisation platform, is up over 4% to exchange above $0.91 at the time of writing.
Ondo poised to launch tokenized stocks, ETFs on-chain
Ondo Finance has announced plans to debut over 100 tokenized stocks and Exchange Traded Funds (ETFs) on-chain on Wednesday. The move comes amid a paradigm shift in United States (US) crypto regulations and the Securities & Exchange Commission's (SEC) push to establish a unified licensing system for financial products.
Ondo Finance already operates active tokenized US Treasuries. The offering, which targets institutional investors, provides qualified purchasers with exposure to short-term US Treasuries and money market funds (MMFs) with instant stablecoin mints and redemptions.
Tokenized US Treasuries have recently crossed the $7 billion mark, with Ondo Finance issuing over $1 billion on the Ethereum (ETH) network. Ethereum accounts for the lion's share of tokenized US Treasuries, underscoring the protocol's role as the foundation for on-chain capital markets.
The push for the tokenisation of RWAs comes on the backdrop of the SEC's commitment "to unify trading of traditional securities, tokenized securities, and non-security crypto assets under a single license," as shared by Ondo Finance on X. This initiative highlights the regulator's role in the expansion of traditional markets and assets on-chain.
Technical outlook: Ondo poised for 15% breakout
Ondo offers bullish signals on Tuesday after rebounding from support established at $0.85 on Monday. The Moving Average Convergence Divergence (MACD) indicator on the 4-hour chart backs the short-term bullish outlook, displaying a buy signal triggered earlier in the day.
Traders will increase exposure if the blue MACD line remains above the red signal line. A reversal in the Relative Strength Index (RSI) above the midline supports the increase in buying pressure. As the RSI rebounds toward overbought territory, confidence in the ONDO price recovery builds, increasing the chances of a bullish breakout.
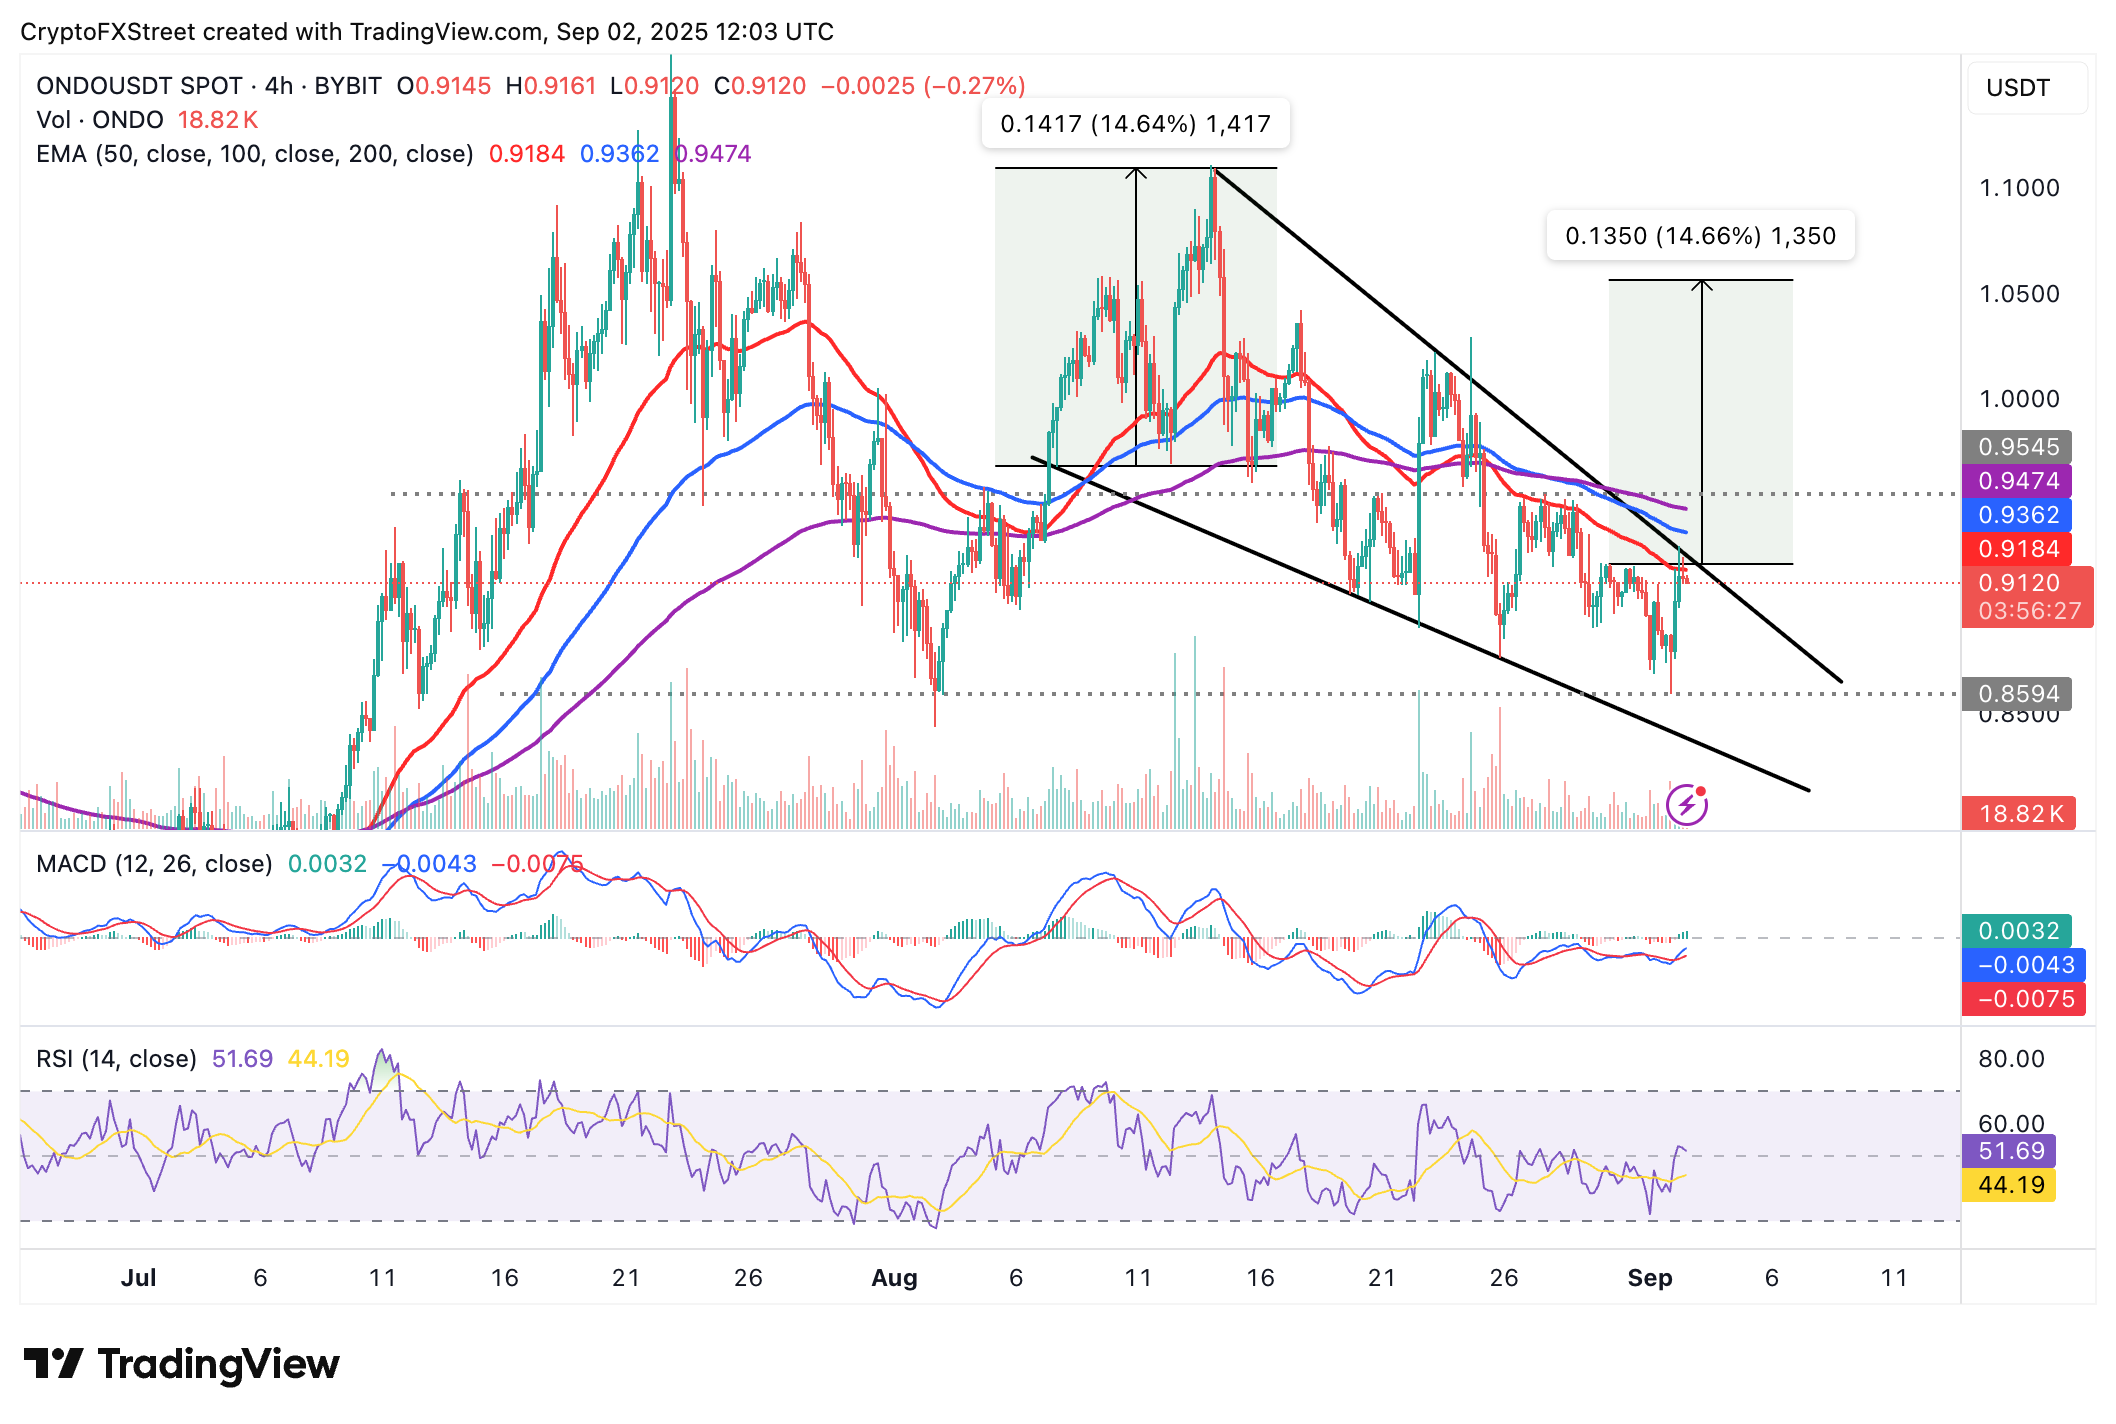
ONDO/USDT 4-hour chart
A falling wedge pattern projects an approximately 15% breakout to $1.05 if confirmed. This is a bullish pattern that forms as the price of an asset consolidates in a downtrend.
The converging trendlines indicate that bearish pressure is fading as bulls prepare to take control.
Following a potential break above the upper trendline, traders would anticipate a surge in volume, which would support the bullish outcome. The 15% breakout target is determined by measuring the distance between the pattern's widest points, extrapolating above the breakout point.
Still, the presence of the 50-period Exponential Moving Average (EMA) at $0.91 could slow down the recovery. Traders must be cautious in the upcoming sessions, as they cannot rule out the possibility of an extended correction to Monday's support level at $0.85.
Cryptocurrency metrics FAQs
The developer or creator of each cryptocurrency decides on the total number of tokens that can be minted or issued. Only a certain number of these assets can be minted by mining, staking or other mechanisms. This is defined by the algorithm of the underlying blockchain technology. On the other hand, circulating supply can also be decreased via actions such as burning tokens, or mistakenly sending assets to addresses of other incompatible blockchains.
Market capitalization is the result of multiplying the circulating supply of a certain asset by the asset’s current market value.
Trading volume refers to the total number of tokens for a specific asset that has been transacted or exchanged between buyers and sellers within set trading hours, for example, 24 hours. It is used to gauge market sentiment, this metric combines all volumes on centralized exchanges and decentralized exchanges. Increasing trading volume often denotes the demand for a certain asset as more people are buying and selling the cryptocurrency.
Funding rates are a concept designed to encourage traders to take positions and ensure perpetual contract prices match spot markets. It defines a mechanism by exchanges to ensure that future prices and index prices periodic payments regularly converge. When the funding rate is positive, the price of the perpetual contract is higher than the mark price. This means traders who are bullish and have opened long positions pay traders who are in short positions. On the other hand, a negative funding rate means perpetual prices are below the mark price, and hence traders with short positions pay traders who have opened long positions.
บทความแนะนำ


