
Ethereum Price Forecast: ETH eyes key support despite record growth in network activity
Ethereum price today: $4,340
- Ethereum's total transaction count reached a new high in August, following its record price growth.
- Fees have remained low despite the strong uptick in network activity, an emerging trend inspired by the Dencun upgrade.
- ETH could decline to $4,000 if it loses a key ascending trendline support.
Ethereum (ETH) has declined below $4,400 on Friday, amid record growth in network activity.
Ethereum network activity surges to multi-year highs
Ethereum's total transaction count surged to a new high over the past few weeks, boosting ETH's all-time high move last week, according to CryptoQuant data.
The 14-day Simple Moving Average (SMA) of total transactions surpassed 1.7 million for the first time, marking a notable increase that exceeds the growth observed during the 2021 bull cycle. Active addresses are also rising, with the 14-day EMA reaching a three-year high in August. This indicates that activity across the network is distributed among users, rather than concentrated in a few players.
ETH Total Transaction Count. Source: CryptoQuant
Meanwhile, weekly decentralized exchange (DEX) volume also climbed to new highs as the total value locked (TVL) approached its 2021 record, according to DefiLlama data.
While ETH's rising prices have triggered growth in activity across its ecosystem, similar to prior bullish cycles, a notable difference in the current move is the steady decline in network fees.
 (2)-1756505834623-1756505834624.png)
ETH Network Fees. Source: CryptoQuant
One of the key bottlenecks that ETH faced in previous rallies was the surging transaction fees as network activity increased. However, cost-effective features like blobspace introduced in the Ethereum Dencun upgrade of March 2024, have ensured fees remain at a low rate even when network activity peaks. The Pectra upgrade in May also helped improve the fee reduction through higher blob throughput, alongside account abstraction and validator efficiency features.
Industry leaders predict that such a feat will help ETH maintain consistent network growth, which in turn will provide support for its price uptrend.
The recent rise in Ethereum follows strong accumulation from digital asset treasuries (DATs) and ETH exchange-traded funds (ETFs), which have accumulated a combined 5% of ETH's circulating supply since June.
The sustained demand from these entities has pushed the percentage of ETH supply in profit above the 90% threshold, a level that has historically triggered increased profit-taking. The Network Realized Profit/Loss metric indicates that investors have taken the cue, as evidenced by consistent profit realization over the past weeks.
Market analysts have expressed that failure for demand to catch up with such elevated profit-taking levels could trigger a price correction.
Ethereum Price Forecast: ETH tests key ascending trendline support
Ethereum saw $170.88 million in futures liquidations over the past 24 hours, per Coinglass data. The total amount of long and short liquidations is $136 million and $34.88 million, respectively.
ETH is testing the support of an ascending trendline extending from June 22 after bears pushed prices below the $4,500 key level. ETH has seen a price bounce close to this ascending trendline on four occasions in the past few months, positioning it as a potential major demand zone.
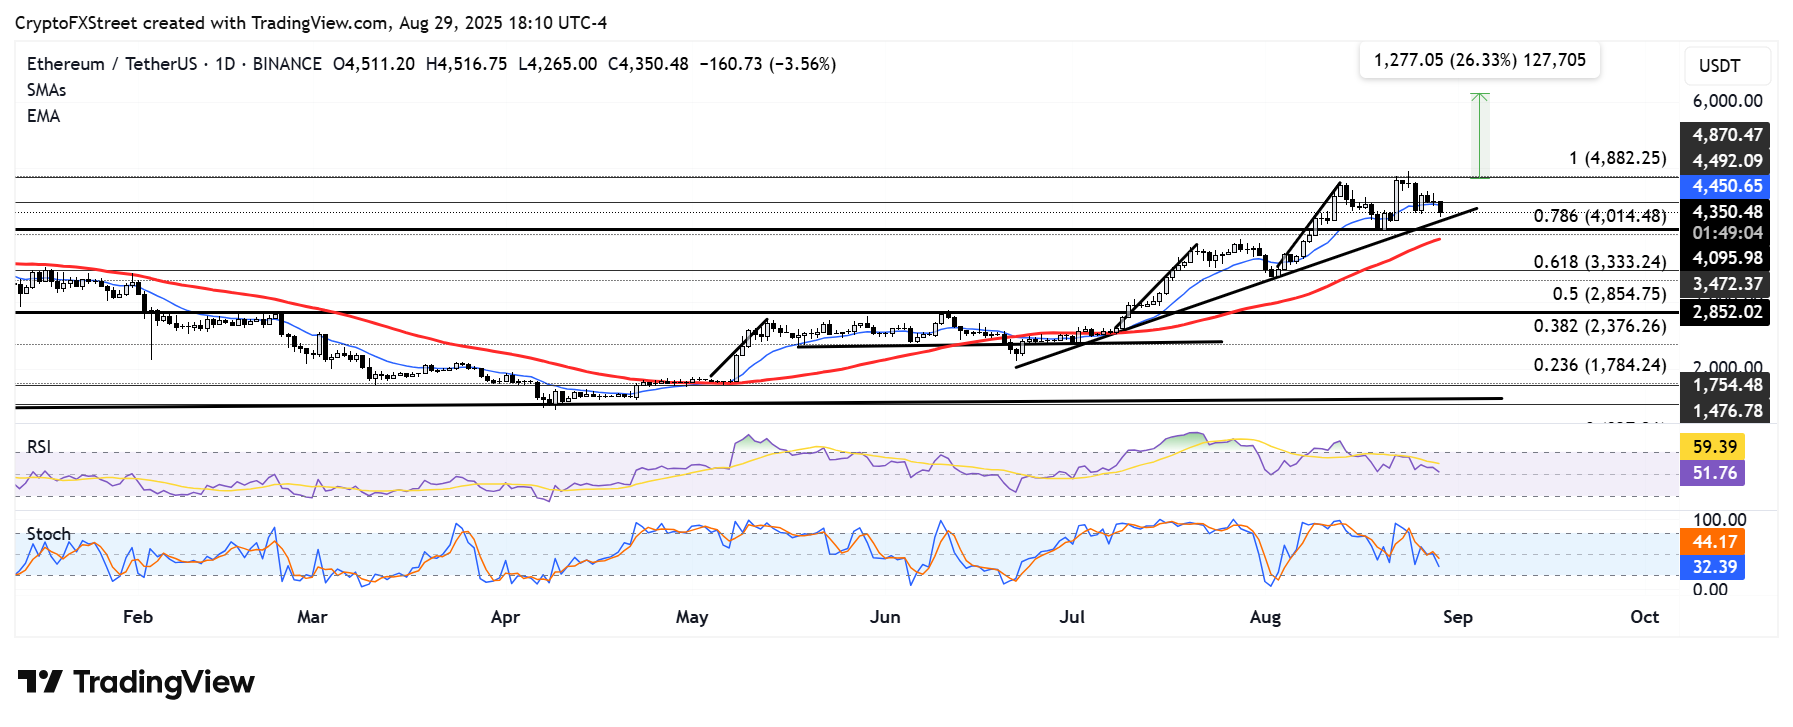
ETH/USDT daily chart
A failure to hold the trendline could push ETH toward the $4,000 psychological level, which is supported by the 50-day SMA just below it. ETH could crash toward $3,470 if it fails to hold the $4,000 support level.
On the upside, ETH must firmly recover above $4,500 to resume a bid for a new all-time high.
The Relative Strength Index (RSI) is declining and approaching its neutral level, while the Stochastic Oscillator (Stoch) is approaching its oversold region boundary. This indicates a gradual buildup of bearish momentum.
บทความแนะนำ


