Tron Price Forecast: TRX set for a correction as bearish momentum builds

แหล่งที่มา Fxstreet
  • Tron price breaks below the ascending trendline, signalling a shift in market structure from bullish to bearish.
  • On-chain and derivatives data support a bearish picture as TRX’s Spot Taker CVD is in the red and funding rates flip negative.
  • The technical outlook suggests a correction ahead as momentum indicators show bearish bias.

Tron (TRX) price is flashing early signs of weakness, trading around $0.345 at the time of writing on Tuesday after breaking below its ascending trendline the previous day. This breakdown suggests a potential shift in market structure from bullish to bearish. On-chain and derivatives data also support a bearish outlook, coupled with weakening momentum indicators, which reinforces the likelihood of a further correction in the near term.

Tron’s on-chain and derivatives data hints at a correction 

CryptoQuant’s Spot Taker CVD for TRX is negative, and its value has been steadily rising since mid-August. This metric measures the cumulative difference between market buy and sell volumes over three months. When the three-month CVD is positive, it suggests the Taker Buy Dominant Phase. A negative value, as it is currently happening, indicates the Taker Sell Dominant Phase.

Tron Spot Taker CVD chart. Source: CryptoQuant

Tron Spot Taker CVD chart. Source: CryptoQuant

Coinglass’s funding rate data for TRX also support the bearish thesis. The metric has flipped to a negative rate on Tuesday and reads 0.0026%, indicating that shorts are paying longs. This scenario often signifies bearish sentiment in the market, suggesting potential downward pressure on TRX.

TRX OI-Weighted Funding Rate chart. Source: Coinglass

TRX OI-Weighted Funding Rate chart. Source: Coinglass

Tron Price Forecast: TRX breaks below key support 

Tron price faced rejection around its yearly high of $0.370 on Saturday and declined nearly 7% until Monday, closing below the ascending trendline (drawn by connecting multiple lows since June 22). At the time of writing, it hovers at around $0.345.

If TRX faces resistance around its daily level at $0.345 and continues its correction, it could extend the decline toward its 50-day Exponential Moving Average (EMA) at $0.330.

The Relative Strength Index (RSI) on the daily chart is hovering around its neutral level of 50, indicating indecisiveness among traders. For the bearish momentum to be sustained, the RSI must move below its neutral level. The Moving Average Convergence Divergence (MACD) showed a bearish crossover on Sunday, giving sell signals and suggesting a downward trend ahead.
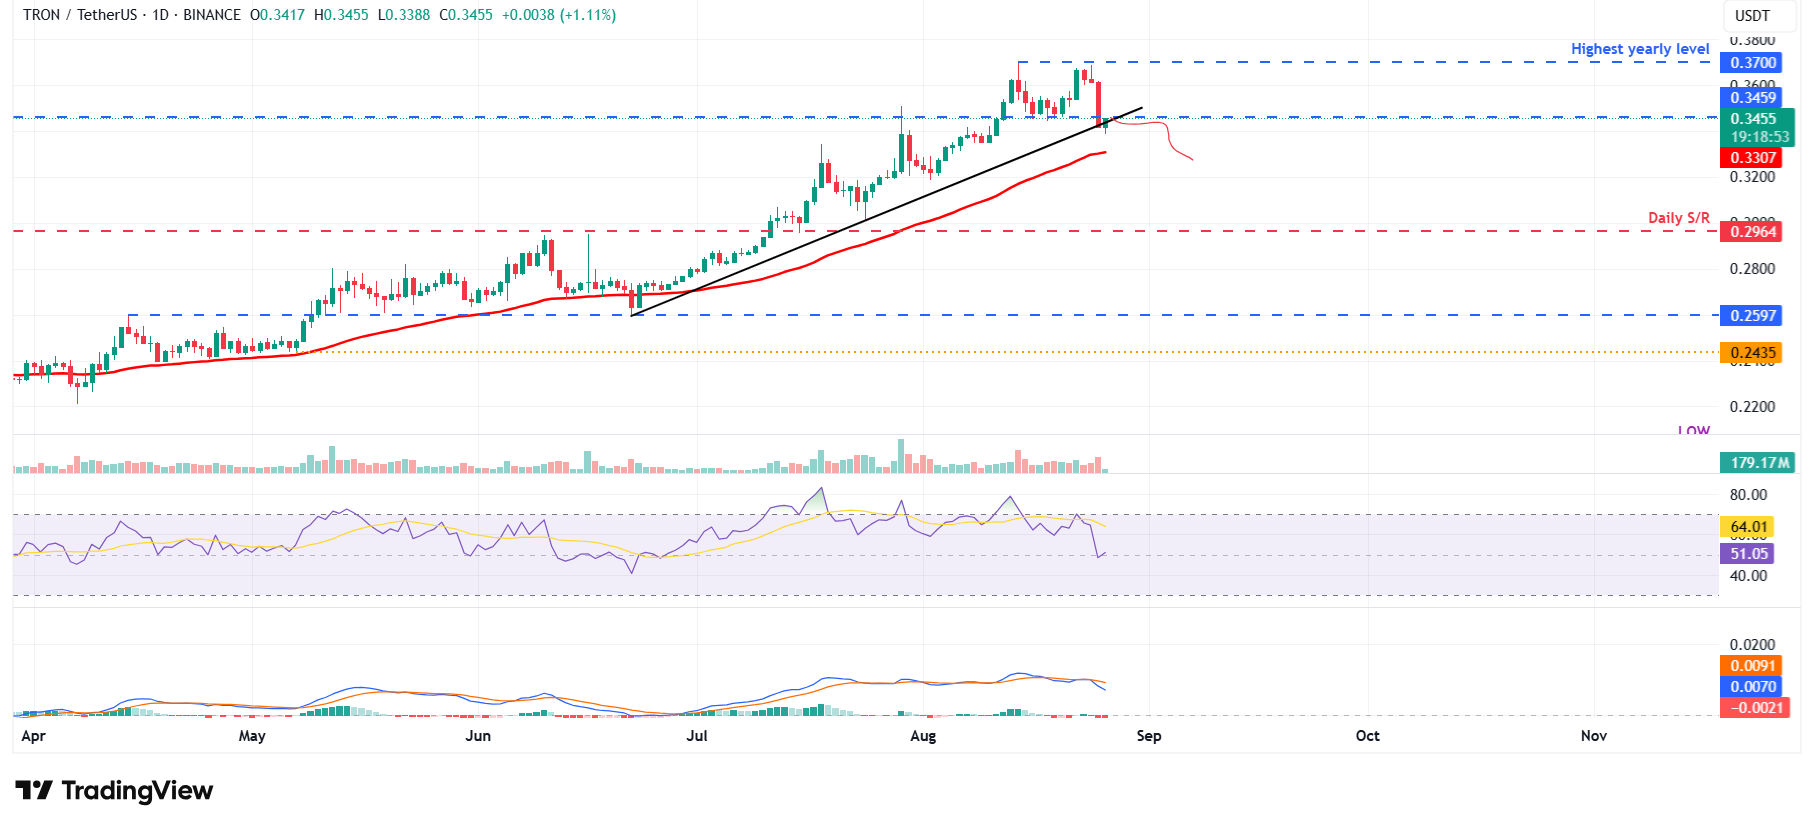
TRX/USDT daily chart 

TRX/USDT daily chart 

However, if TRX recovers and closes above its daily resistance at $0.345 on a daily basis, it could extend the recovery toward its yearly high at $0.370.

ข้อจำกัดความรับผิดชอบ: เพื่อการอ้างอิงเท่านั้น ผลการดำเนินงานในอดีตไม่ได้บ่งบอกถึงผลลัพธ์ในอนาคต
placeholder
ข่าวคริปโต|ข่าวคริปโตวันนี้|ตลาดคริปโตร่วงแรงท่ามกลางการเฝ้ารอข้อมูลเงินเฟ้อและแนวโน้มการเคลื่อนไหวของธนาคารกลางราคา Bitcoin ร่วงหลุด $67,000 ท่ามกลางแรงขายก่อนข้อมูลเงินเฟ้อ เทรดเดอร์จับตาโซนซื้อ ตลาดคริปโตร่วงแดง ผันผวนรับข้อมูลเศรษฐกิจสหรัฐฯ
ผู้เขียน  Mitrade
วันที่ 13 มิ.ย. 2024
ราคา Bitcoin ร่วงหลุด $67,000 ท่ามกลางแรงขายก่อนข้อมูลเงินเฟ้อ เทรดเดอร์จับตาโซนซื้อ ตลาดคริปโตร่วงแดง ผันผวนรับข้อมูลเศรษฐกิจสหรัฐฯ
placeholder
ทองคำพุ่งขึ้นสู่ระดับ 3,400 ดอลลาร์ เนื่องจากความตึงเครียดในตะวันออกกลางและข้อมูลเศรษฐกิจสหรัฐฯ ที่อ่อนแอ กระตุ้นการเก็งกำไรที่ผ่อนคลายเกี่ยวกับเฟดราคาทองคำปรับตัวเพิ่มขึ้นเป็นวันที่สองติดต่อกัน โดยใกล้เคียงกับการทดสอบระดับ $3,400 หลังจากการเปิดเผยข้อมูลเงินเฟ้อและการจ้างงานที่ลดลงในสหรัฐอเมริกา (US) ขณะที่ความตึงเครียดทางภูมิรัฐศาสตร์ในตะวันออกกลางเพิ่มสูงขึ้น ณ เวลาที่เขียนบทความนี้ XAU/USD เคลื่อนไหวอยู่ที่ $3,386
ผู้เขียน  FXStreet
6 เดือน 13 วัน ศุกร์
ราคาทองคำปรับตัวเพิ่มขึ้นเป็นวันที่สองติดต่อกัน โดยใกล้เคียงกับการทดสอบระดับ $3,400 หลังจากการเปิดเผยข้อมูลเงินเฟ้อและการจ้างงานที่ลดลงในสหรัฐอเมริกา (US) ขณะที่ความตึงเครียดทางภูมิรัฐศาสตร์ในตะวันออกกลางเพิ่มสูงขึ้น ณ เวลาที่เขียนบทความนี้ XAU/USD เคลื่อนไหวอยู่ที่ $3,386
placeholder
ทองคำพุ่งทะลุ $4,000 สู่จุดสูงสุดตลอดกาลก่อนการเปิดเผยรายงานการประชุมเฟดราคาทองคำปรับตัวขึ้นต่อเนื่องเป็นวันที่สามติดต่อกันในสัปดาห์นี้ แตะระดับสูงสุดเป็นประวัติการณ์ที่ $4,056 ต่อออนซ์ ทองคำปรับตัวขึ้นมากกว่า 1.70% ในวันนั้น
ผู้เขียน  FXStreet
เมื่อวาน 01: 57
ราคาทองคำปรับตัวขึ้นต่อเนื่องเป็นวันที่สามติดต่อกันในสัปดาห์นี้ แตะระดับสูงสุดเป็นประวัติการณ์ที่ $4,056 ต่อออนซ์ ทองคำปรับตัวขึ้นมากกว่า 1.70% ในวันนั้น
placeholder
คาดการณ์ราคาโลหะเงิน: XAGUSD ยังคงอยู่เหนือ $49.00 ราคายังเป็นแนวโน้มขาขึ้นราคา (XAG/USD) ปรับตัวเพิ่มขึ้นต่อเนื่องหลังจากที่ทำขาขึ้นได้มากกว่า 2% แตะระดับสูงสุดในรอบ 14 ปีที่ 49.55 ดอลลาร์ในเซสชั่นก่อนหน้า และขณะนี้ ซื้อขายแลกเปลี่ยนอยู่ที่ประมาณ 49.10 ดอลลาร์ในช่วงเวลาตลาดยุโรปของวันพฤหัสบดี การวิเคราะห์ทางเทคนิคของกราฟรายวันแสดงให้เห็นว่าราคาโลหะมีค่าเคลื่อนตัวขึ้นภายใ
ผู้เขียน  FXStreet
18 ชั่วโมงที่แล้ว
ราคา (XAG/USD) ปรับตัวเพิ่มขึ้นต่อเนื่องหลังจากที่ทำขาขึ้นได้มากกว่า 2% แตะระดับสูงสุดในรอบ 14 ปีที่ 49.55 ดอลลาร์ในเซสชั่นก่อนหน้า และขณะนี้ ซื้อขายแลกเปลี่ยนอยู่ที่ประมาณ 49.10 ดอลลาร์ในช่วงเวลาตลาดยุโรปของวันพฤหัสบดี การวิเคราะห์ทางเทคนิคของกราฟรายวันแสดงให้เห็นว่าราคาโลหะมีค่าเคลื่อนตัวขึ้นภายใ
placeholder
ดอลลาร์แคนาดาปรับตัวลดลงสู่ระดับต่ำสุดในรอบหกเดือน ขณะที่ USDCAD ขึ้นเหนือ 1.4000ดอลลาร์แคนาดา (CAD) ยังคงลดลงเมื่อเทียบกับดอลลาร์สหรัฐ (USD) ในวันพฤหัสบดี โดย USD/CAD ขึ้นไปเหนือระดับราคาทางจิตวิทยาที่ 1.4000 เพื่อทำระดับสูงสุดนับตั้งแต่วันที่ 10 เมษายน
ผู้เขียน  FXStreet
2 ชั่วโมงที่แล้ว
ดอลลาร์แคนาดา (CAD) ยังคงลดลงเมื่อเทียบกับดอลลาร์สหรัฐ (USD) ในวันพฤหัสบดี โดย USD/CAD ขึ้นไปเหนือระดับราคาทางจิตวิทยาที่ 1.4000 เพื่อทำระดับสูงสุดนับตั้งแต่วันที่ 10 เมษายน
ตราสารที่เกี่ยวข้อง
goTop
quote