Hyperliquid Price Forecast: Bears aim for levels below $30 as short bets rise

แหล่งที่มา Fxstreet
  • Hyperliquid extends losses after falling to close above a key resistance level earlier this week.
  • On-chain and derivatives data support the bearish outlook as Spot Taker CVD is in negative territory and short positions hit a one-month high.
  • The technical outlook suggests a correction, with bears targeting levels below $30.

Hyperliquid (HYPE) is trading in red at around $37.50 on Wednesday after failing to close above a key resistance earlier this week. This downturn is further supported by on-chain and derivatives metrics, which show HYPE’s rising sell dominant phase and short positions hitting a one-month high. The technical analysis suggests a potential downward trend continuation, targeting levels below $30.

Hyperliquid on-chain, derivatives metrics turn bearish

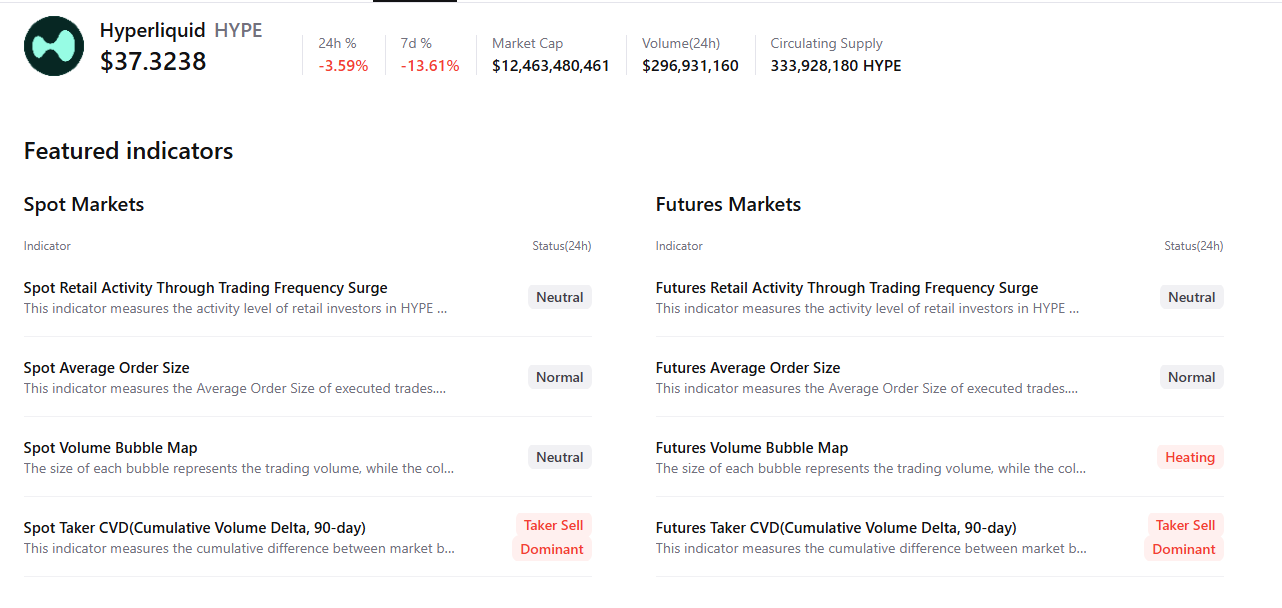
CryptoQuant data highlights the rising selling pressure on Hyperliquid. The Taker CVD (Cumulative Volume Delta) for HYPE is negative, and its value has been steadily decreasing since mid-July. This metric measures the cumulative difference between market buy and sell volumes over three months. When the three-month CVD is positive and increasing, it suggests the Taker Buy Dominant Phase, while a negative and decreasing value, as it is currently happening, indicates the Taker Sell Dominant Phase.

Hyperliquid Spot Taker CVD chart. Source: CryptoQuant

Hyperliquid Spot Taker CVD chart. Source: CryptoQuant

CryptoQuant’s summary data also indicates that Hyperliquid’s futures market activity is heating up as more traders are opening leveraged positions alongside negative Spot Taker CVD, signaling a potential correction ahead.
The bearish outlook is further supported by Coinglass' long-to-short ratio, which stands at 0.77 on Wednesday, marking the lowest level in over a month. A ratio below one suggests bearish sentiment in the market as traders are betting that the asset price will fall.

Hyperliquid Spot Taker CVD chart. Source: CryptoQuant

HYPE long-to-short ratio chart. Source: CoinGlass

Hyperliquid Price Forecast: Bears targeting levels below $30

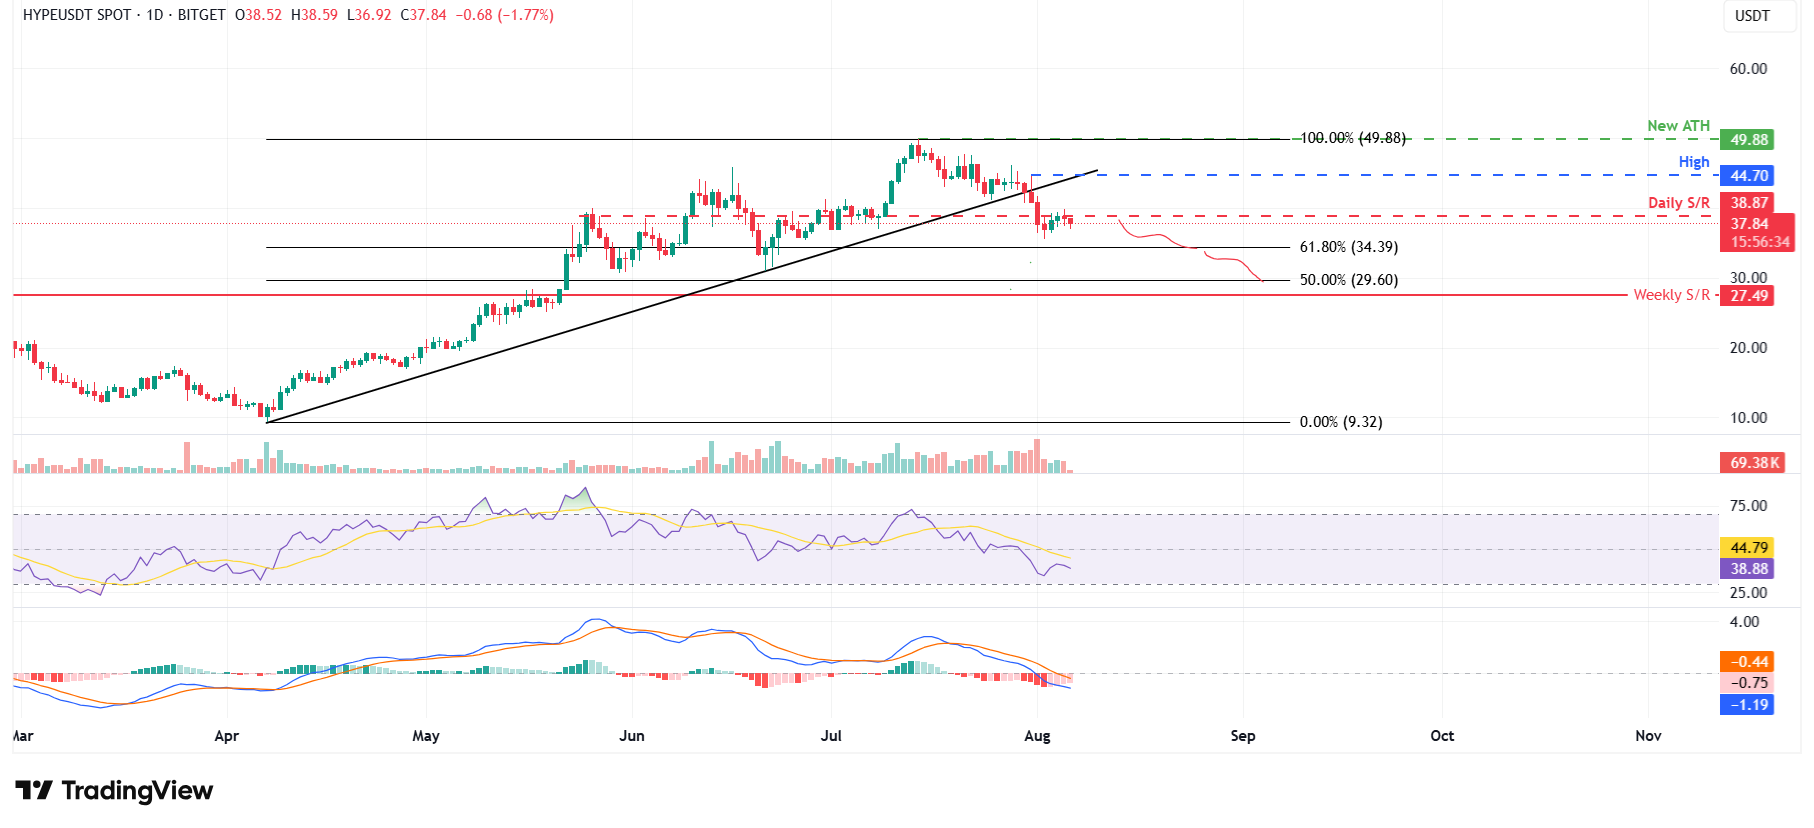
Hyperliquid price broke below the ascending trendline (drawn by connecting multiple lows since early April) on Thursday and declined 10.34%, closing below the daily support at $38.87 in the next two days.

However, HYPE recovered slightly from Sunday to Monday but failed to close above its daily resistance at $38.87 and declined slightly the next day. At the time of writing on Wednesday, it continues to trade down around $37.64.

If HYPE continues its downward trend, it could retest its 61.80% Fibonacci retracement level at $34.40 (drawn from April's low of $9.32 to July's all-time high of $49.88). A successful close below this level could extend the loss to retest its weekly level at $27.49.

The Relative Strength Index (RSI) on the daily chart reads 39, below its neutral value of 50, indicating strong bearish momentum. The Moving Average Convergence Divergence (MACD) showed a bearish crossover on July 23 that still holds, also indicating bearish momentum.
HYPE/USDT daily chart 

HYPE/USDT daily chart 

If HYPE closes above the daily resistance at $38.87, it could extend the recovery toward the July 31 high of $44.70.

ข้อจำกัดความรับผิดชอบ: เพื่อการอ้างอิงเท่านั้น ผลการดำเนินงานในอดีตไม่ได้บ่งบอกถึงผลลัพธ์ในอนาคต
placeholder
การคาดการณ์ราคาหุ้น AAPL: ภายในปี 2566 นี้ จะสามารถกลับคืนสู่มูลค่าตลาด 3 ล้านล้าน ได้หรือไม่?การลดลงของราคาหุ้นของ Apple มีสาเหตุหลักมาจากปัจจัยด้านลบและทัศนคติเชิงลบของนักลงทุนที่มีต่อตลาดโดยรวม คุณค่าที่แท้จริง รวมถึงประสิทธิภาพของผลิตภัณฑ์ และ บริการ Apple จะยังคงเป็นปัจจัยเชิงบวกได้ตลอดทั้งปี 2022 ปัจจัยลบระดับมหภาคที่ส่งผลต่อราคาหุ้น Apple จะค่อยๆ อ่อนตัวลงในปี 2566
ผู้เขียน  Mitrade
วันที่ 09 มิ.ย. 2023
การลดลงของราคาหุ้นของ Apple มีสาเหตุหลักมาจากปัจจัยด้านลบและทัศนคติเชิงลบของนักลงทุนที่มีต่อตลาดโดยรวม คุณค่าที่แท้จริง รวมถึงประสิทธิภาพของผลิตภัณฑ์ และ บริการ Apple จะยังคงเป็นปัจจัยเชิงบวกได้ตลอดทั้งปี 2022 ปัจจัยลบระดับมหภาคที่ส่งผลต่อราคาหุ้น Apple จะค่อยๆ อ่อนตัวลงในปี 2566
placeholder
WTI ยังคงขาดทุนต่ำกว่า $63.00 ก่อนการเจรจาสันติภาพระหว่างทรัมป์-ปูตินราคาน้ำมัน West Texas Intermediate (WTI) ลดลงหลังจากที่ทำกำไรได้มากกว่า 1.5% ในเซสชันก่อนหน้า โดยมีการซื้อขายอยู่ที่ประมาณ 62.90 ดอลลาร์ต่อบาร์เรลในช่วงเช้าของวันศุกร์ในเอเชีย
ผู้เขียน  FXStreet
8 เดือน 15 วัน ศุกร์
ราคาน้ำมัน West Texas Intermediate (WTI) ลดลงหลังจากที่ทำกำไรได้มากกว่า 1.5% ในเซสชันก่อนหน้า โดยมีการซื้อขายอยู่ที่ประมาณ 62.90 ดอลลาร์ต่อบาร์เรลในช่วงเช้าของวันศุกร์ในเอเชีย
placeholder
คาดการณ์ราคาเงิน: XAGUSD พุ่งขึ้นสู่ระดับ $39.00 ขณะที่การเก็งการลดดอกเบี้ยของเฟดเพิ่มขึ้นราคาโลหะเงิน (XAG/USD) ปรับตัวเพิ่มขึ้นมากกว่า 0.5% โดยซื้อขายอยู่ที่ประมาณ $38.80 ต่อออนซ์ในช่วงเช้าของตลาดลงทุนยุโรปวันพฤหัสบดี ราคาโลหะเงินที่ไม่ให้ผลตอบแทนปรับตัวขึ้นท่ามกลางความน่าจะเป็นที่เพิ่มขึ้นของการปรับลดอัตราดอกเบี้ยของธนาคารกลางสหรัฐฯ (เฟด)
ผู้เขียน  FXStreet
8 เดือน 28 วัน พฤหัส
ราคาโลหะเงิน (XAG/USD) ปรับตัวเพิ่มขึ้นมากกว่า 0.5% โดยซื้อขายอยู่ที่ประมาณ $38.80 ต่อออนซ์ในช่วงเช้าของตลาดลงทุนยุโรปวันพฤหัสบดี ราคาโลหะเงินที่ไม่ให้ผลตอบแทนปรับตัวขึ้นท่ามกลางความน่าจะเป็นที่เพิ่มขึ้นของการปรับลดอัตราดอกเบี้ยของธนาคารกลางสหรัฐฯ (เฟด)
placeholder
WTI ลดลงต่ำกว่า $64.00 ขณะที่สหรัฐฯ มุ่งเป้าไปที่อินเดียน้ำมันดิบเวสต์เทกซัสอินเตอร์มีเดียต (WTI) ซึ่งเป็นเกณฑ์มาตรฐานน้ำมันดิบของสหรัฐฯ ซื้อขายอยู่ที่ประมาณ 63.85 ดอลลาร์ในช่วงเช้าของตลาดลงทุนเอเชียวันศุกร์ ราคาน้ำมัน WTI ปรับตัวลดลงเล็กน้อยท่ามกลางความกังวลเกี่ยวกับอุปทานที่มากเกินไปและแรงกดดันจากสหรัฐฯ ต่ออินเดียให้หยุดการนำเข้าน้ำมันจากรัสเซีย
ผู้เขียน  FXStreet
8 เดือน 29 วัน ศุกร์
น้ำมันดิบเวสต์เทกซัสอินเตอร์มีเดียต (WTI) ซึ่งเป็นเกณฑ์มาตรฐานน้ำมันดิบของสหรัฐฯ ซื้อขายอยู่ที่ประมาณ 63.85 ดอลลาร์ในช่วงเช้าของตลาดลงทุนเอเชียวันศุกร์ ราคาน้ำมัน WTI ปรับตัวลดลงเล็กน้อยท่ามกลางความกังวลเกี่ยวกับอุปทานที่มากเกินไปและแรงกดดันจากสหรัฐฯ ต่ออินเดียให้หยุดการนำเข้าน้ำมันจากรัสเซีย
placeholder
EUR/USD ยังคงซบเซาใกล้ระดับ 1.1650 หลังจากข้อมูลยอดค้าปลีกของเยอรมนี รอข้อมูล CPIEUR/USD หยุดการปรับตัวขึ้นสามวันติดต่อกัน ราคาเคลื่อนไหวอยู่ที่ประมาณ 1.1660 ในช่วงเวลายุโรปวันศุกร์ คู่สกุลเงินเคลื่อนไหวเล็กน้อยหลังจากการเปิดเผยข้อมูลยอดค้าปลีกของเยอรมนีที่น่าผิดหวัง ข้อมูลดัชนีราคาผู้บริโภค (CPI) เบื้องต้นของเยอรมนีจะถูกจับตามองในภายหลังของวันนั้น
ผู้เขียน  FXStreet
8 เดือน 29 วัน ศุกร์
EUR/USD หยุดการปรับตัวขึ้นสามวันติดต่อกัน ราคาเคลื่อนไหวอยู่ที่ประมาณ 1.1660 ในช่วงเวลายุโรปวันศุกร์ คู่สกุลเงินเคลื่อนไหวเล็กน้อยหลังจากการเปิดเผยข้อมูลยอดค้าปลีกของเยอรมนีที่น่าผิดหวัง ข้อมูลดัชนีราคาผู้บริโภค (CPI) เบื้องต้นของเยอรมนีจะถูกจับตามองในภายหลังของวันนั้น
goTop
quote