


Ripple Price Forecast: XRP hints at 18% breakout as traders eye US tariffs developments
- XRP bulls remain resilient despite macroeconomic uncertainty from US tariff policy.
- XRP is edging closer to a potential inverse head-and-shoulders pattern, signaling a potential 18% breakout.
- Risk-on sentiment is building slowly but steadily, reflected in the rise of XRP futures Open Interest to $4.93 billion.
Ripple (XRP) is gradually edging higher, backed by steady interest in the token, especially in the derivatives market. A slight increase of over 1% on Tuesday sees the token hovering at around $2.28, offering technical signals of a potential 18% breakout above an inverse head-and-shoulders (H&S) pattern.
Market overview: Can XRP extend recovery despite macroeconomic uncertainty?
Global markets are facing renewed uncertainty surrounding the United States (US) tariff policy. With US President Donald Trump’s tariff pause set to end on Wednesday, followed by the implementation of higher tariffs on August 1, volatility could impact risk assets such as XRP.
According to QCP Capital, only one trade deal has been finalized out of the 195 potential trading partners, and 14 new trade letters have been sent out with rates ranging from 25% to 40%; the next few weeks are worth close monitoring.
“Japan and South Korea are staring down 25% tariffs, potentially higher. Markets remain resilient, banking on Trump’s usual delay playbook. But if tariffs go live, expect serious growth headwinds,” QCP Capital states in Tuesday’s market update.
Interest in XRP remains steady, albeit gradually increasing, as reflected by the futures market Open Interest (OI). According to CoinGlass data, OI, which represents the value of all futures and options contracts that have not been settled or closed, has risen to $4.93 billion after falling to $3.53 billion on June 23.
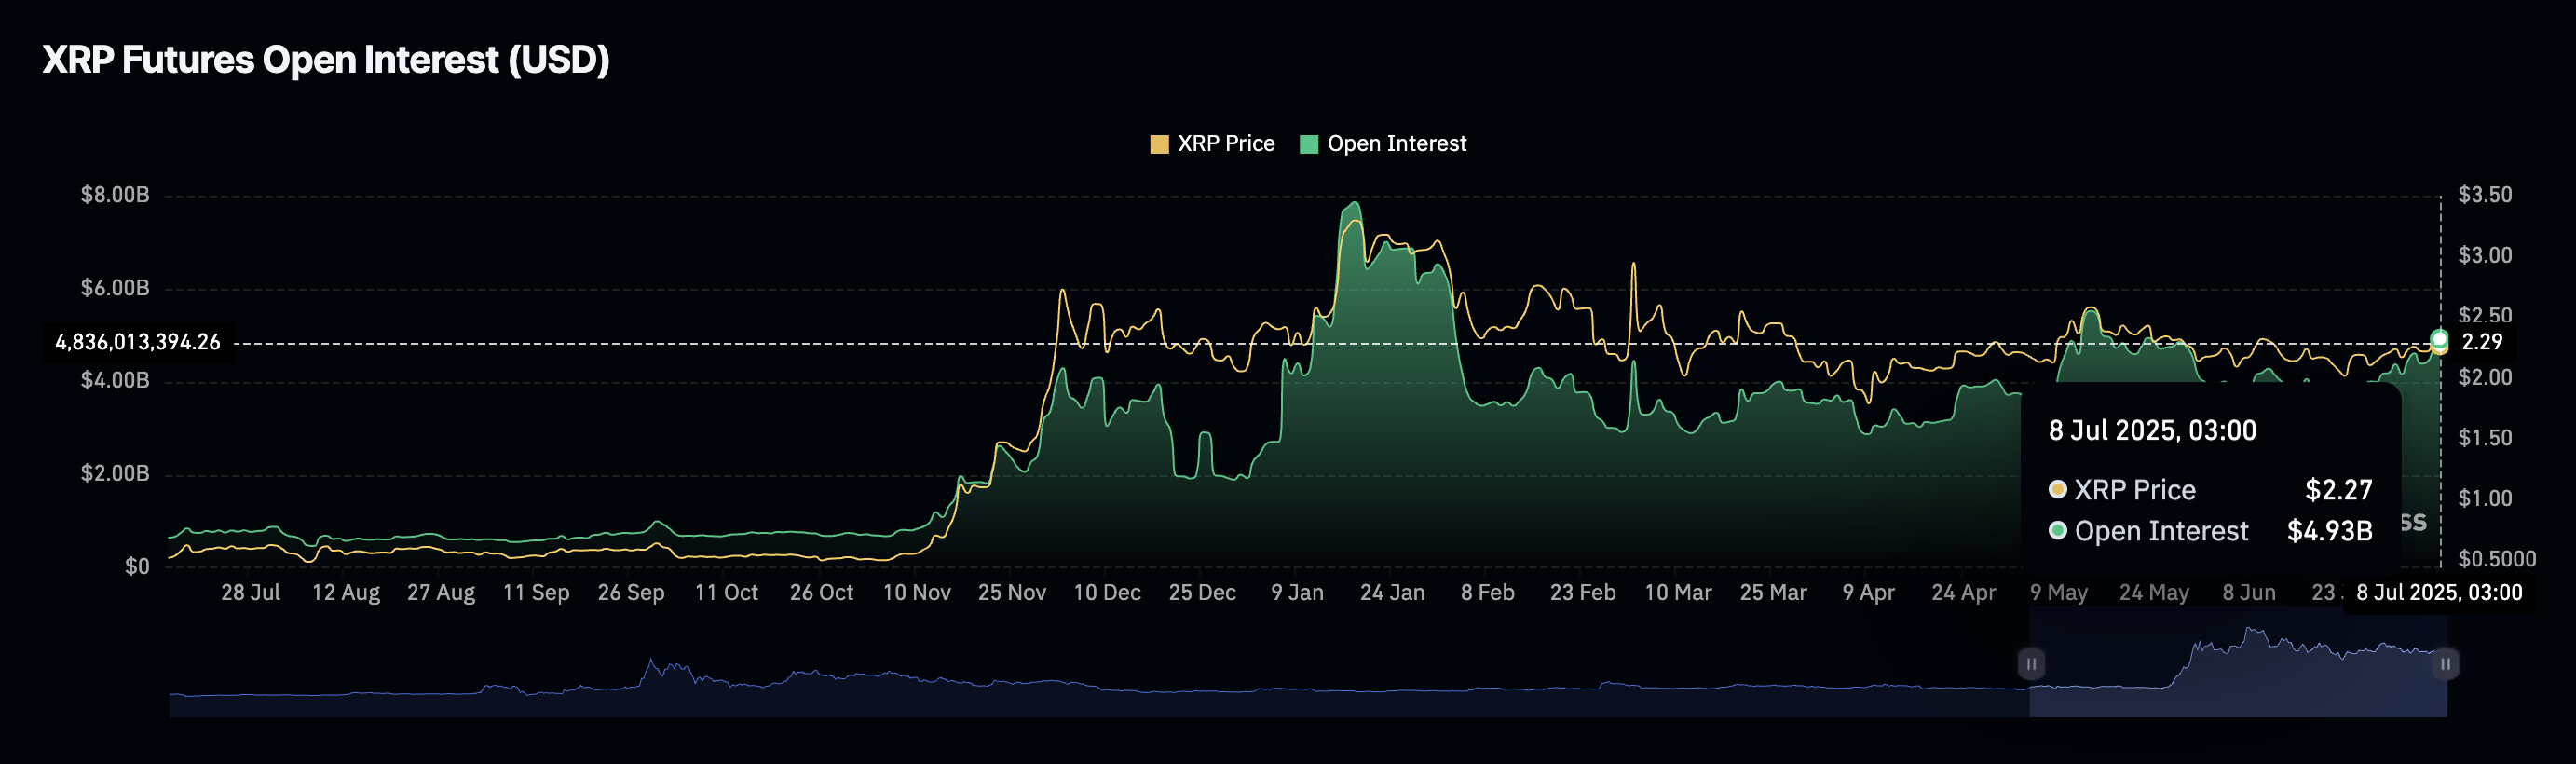
XRP futures Open Interest | Source: CoinGlass
This rise in Open Interest indicates growing investor confidence, with traders betting on a potential price increase for XRP. A subsequent 120% increase in the derivatives market volume to $10 billion signals a surge in market activity, which is often followed by a significant price increase.
At the same time, long and short position liquidations have been almost in parity, around $5 million over the past 24 hours, indicating possible indecision in the market, which may lead to price consolidation in upcoming sessions.
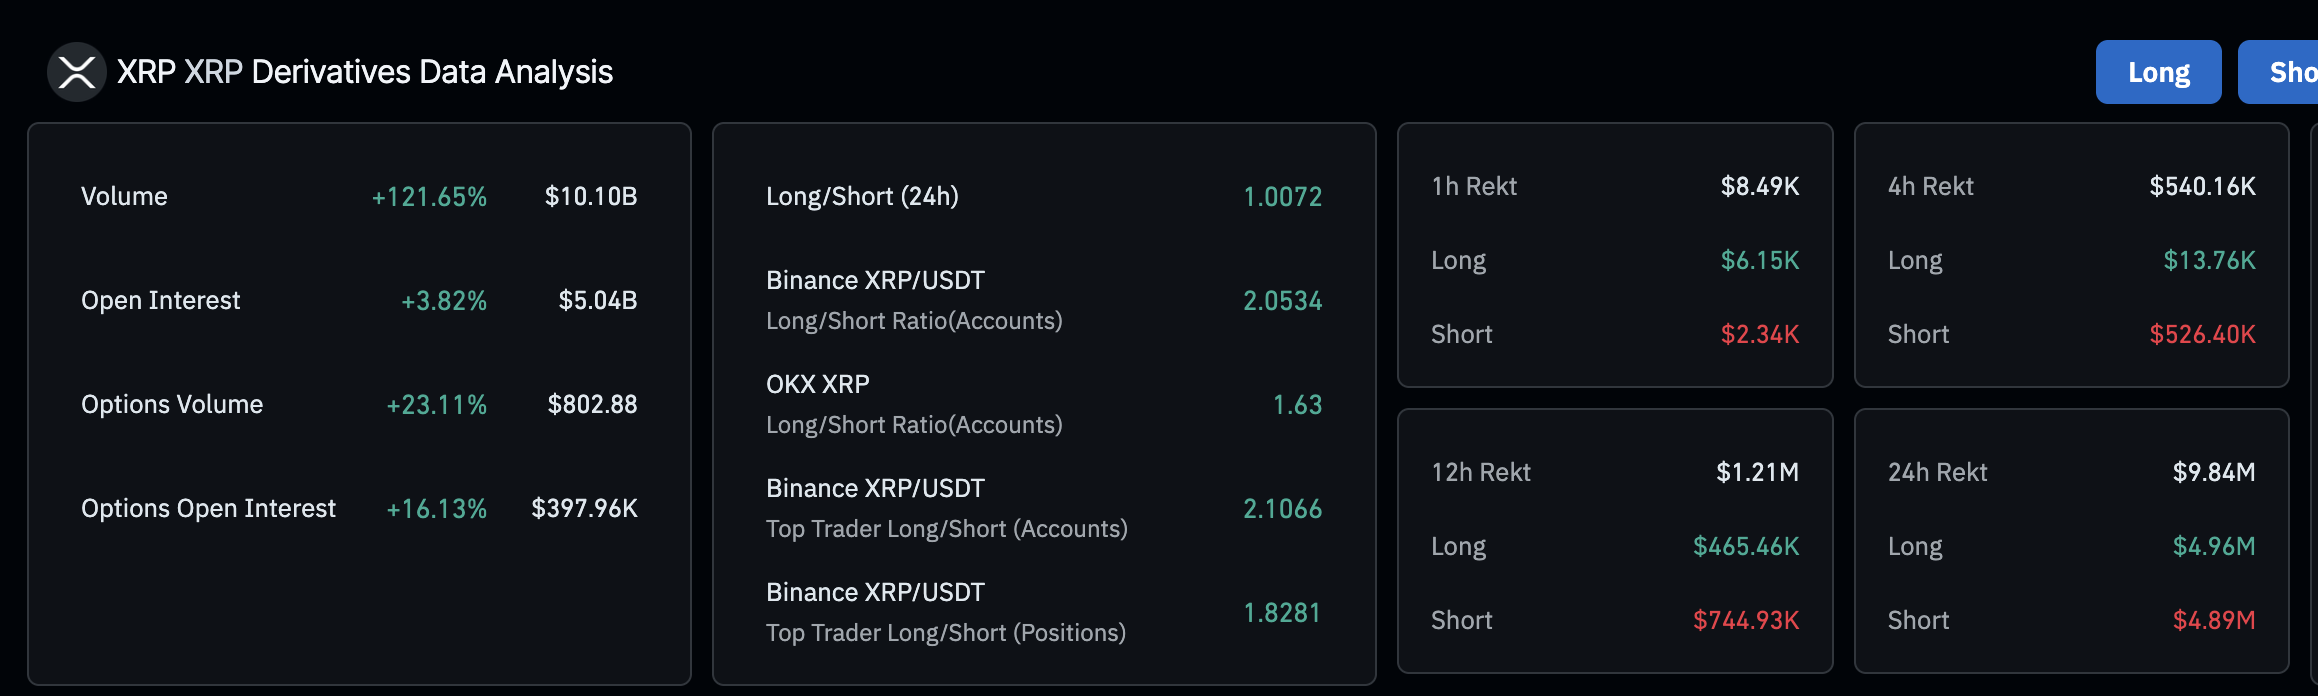
XRP derivatives market data | Source: CoinGlass
Technical outlook: XRP technical structure project 18% breakout
XRP’s price is approaching a potential inverse head-and-shoulders pattern breakout, which could accelerate the cross-border money remittance token by approximately 18% to $2.76.
This is a bullish pattern that signals a potential shift from the downtrend that has been maintained since XRP reached its all-time high of $3.40 in January to an uptrend. Key elements of this pattern include a lower 'head' flanked by two higher 'shoulders' with neckline resistance at $2.33, as shown on the 8-hour chart below.
A breakout above the resistance could extend the uptrend by 18% to $2.76. This target represents the height of the pattern from the neckline to the head and then extrapolates above the breakout point.
Traders would need to monitor the potential change in the volume, with an increase likely to increase the probability of a sustained uptrend.
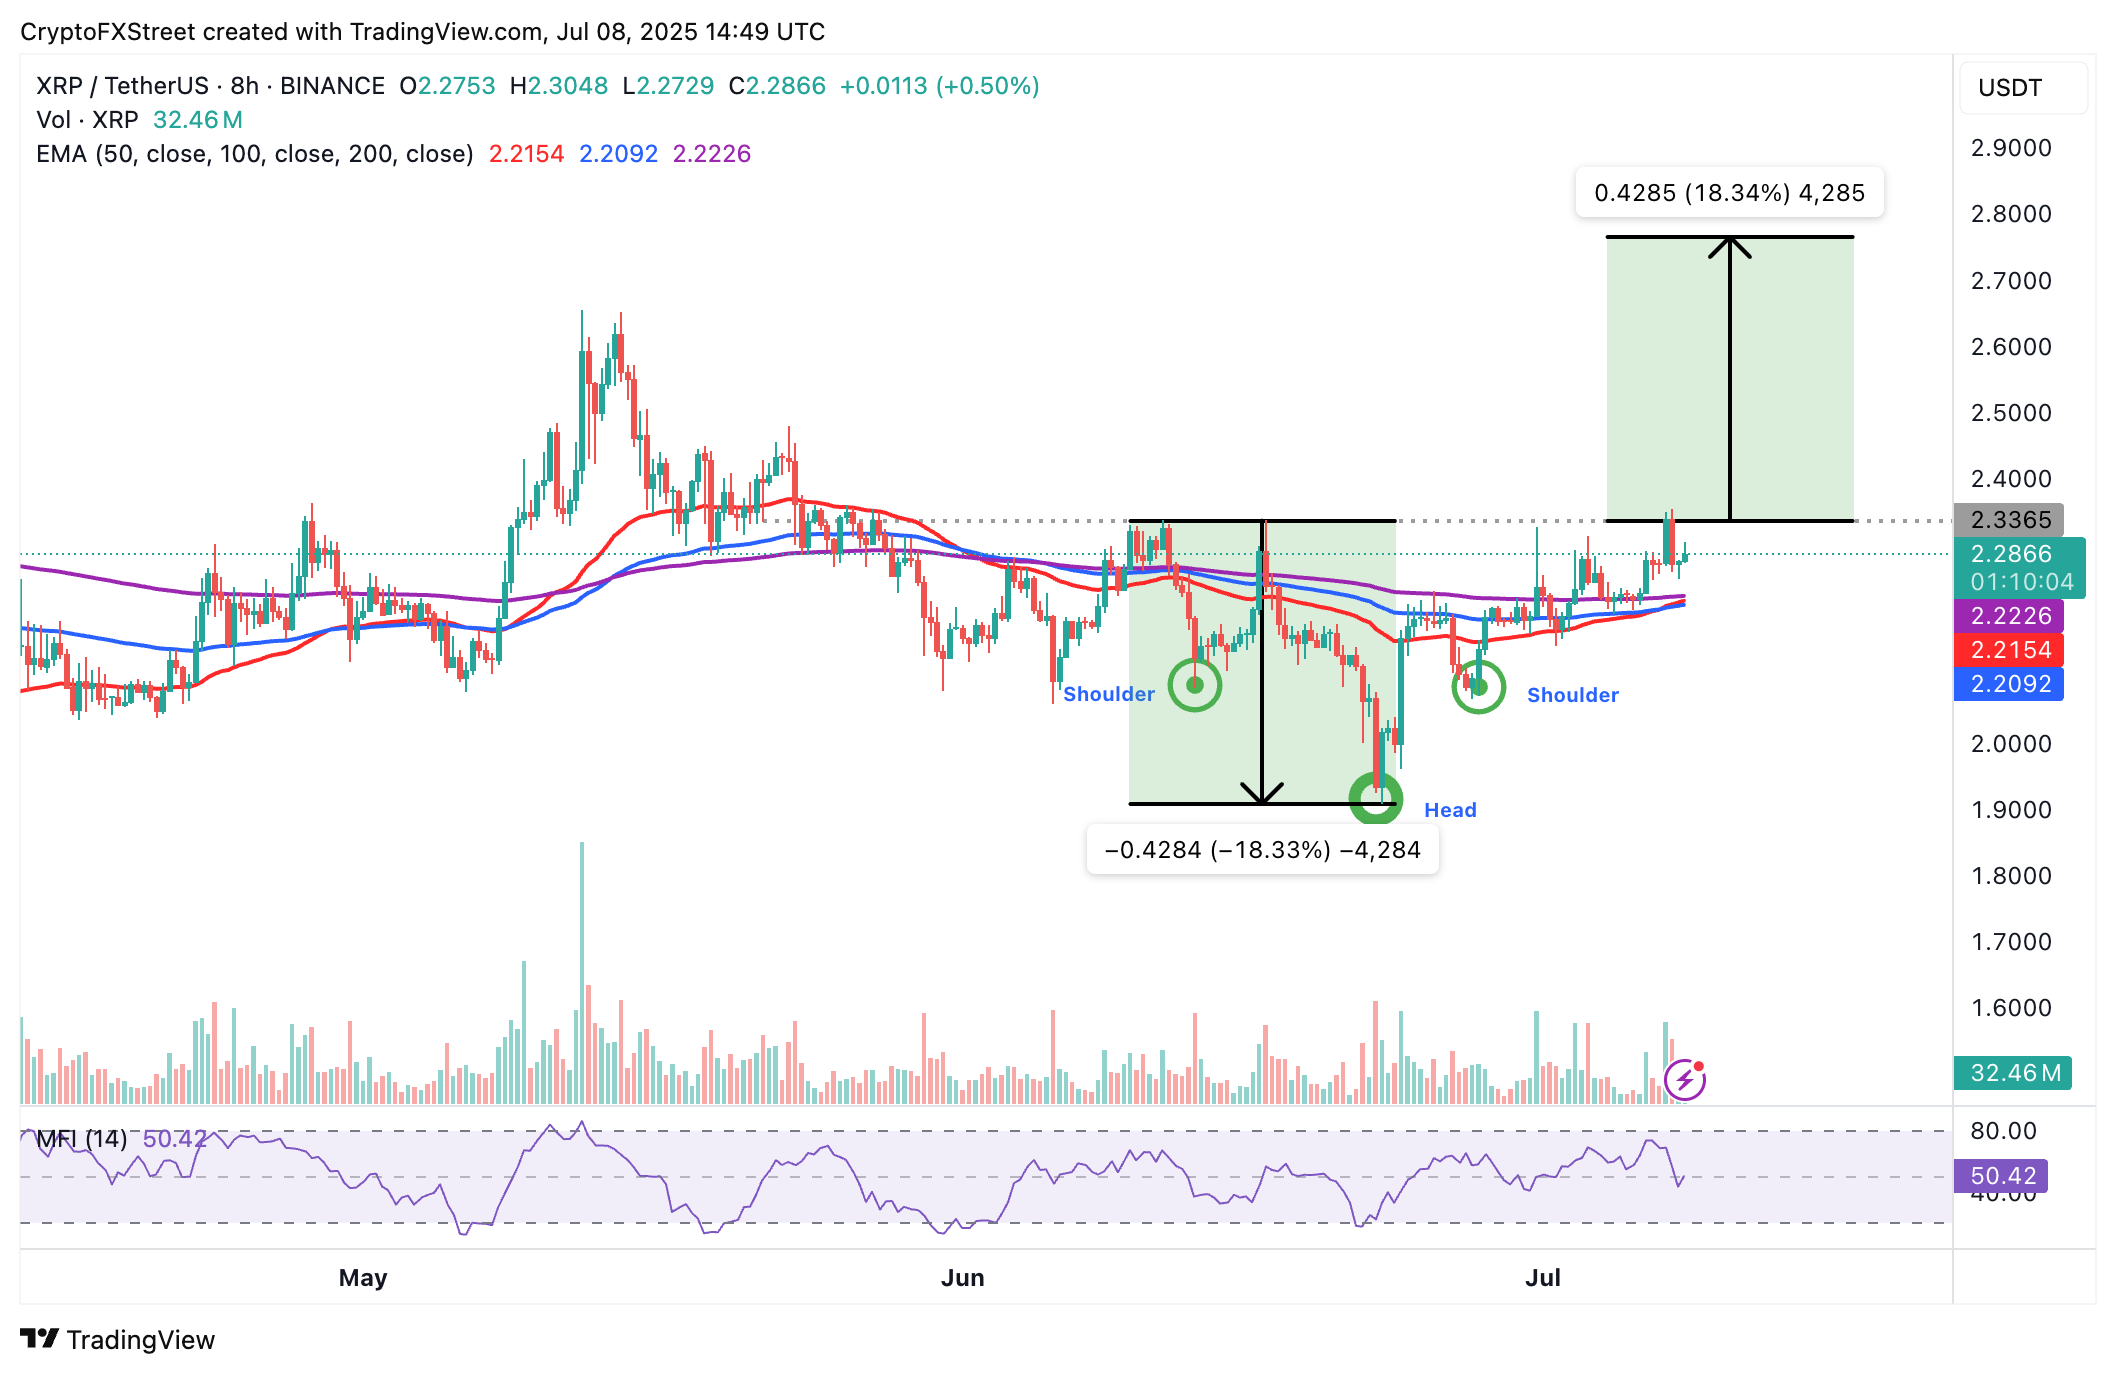
XRP/USDT 8-hour chart
The upward-pointing Money Flow Index (MFI) indicator, which is slightly above the 50 midline, indicates a potential increase in risk-on sentiment. This tool tracks the money entering or leaving XRP, with a persistent increase signaling the possibility of bullish momentum.
In the event XRP fails to break the pattern’s neckline resistance at $2.33, a consolidation phase could follow, with support provided by the 50-period Exponential Moving Average (EMA), the 100-period EMA, and the 200-period EMA, all situated between $2.20 and $2.22 on the 8-hour chart.
Open Interest, funding rate FAQs
Higher Open Interest is associated with higher liquidity and new capital inflow to the market. This is considered the equivalent of increase in efficiency and the ongoing trend continues. When Open Interest decreases, it is considered a sign of liquidation in the market, investors are leaving and the overall demand for an asset is on a decline, fueling a bearish sentiment among investors.
Funding fees bridge the difference between spot prices and prices of futures contracts of an asset by increasing liquidation risks faced by traders. A consistently high and positive funding rate implies there is a bullish sentiment among market participants and there is an expectation of a price hike. A consistently negative funding rate for an asset implies a bearish sentiment, indicating that traders expect the cryptocurrency’s price to fall and a bearish trend reversal is likely to occur.
Artigos Recomendados


