USD/CNH Price Prediction: Trades above 23.6% Fibo., bulls seem non-committed near 7.1555

Fonte Fxstreet
  • USD/CNH attracts some buyers on Thursday and moves away from over a one-week low.
  • The technical setup supports prospects for the emergence of fresh selling at higher levels. 
  • A sustained strength beyond 50% Fibo. level is needed to negate the negative outlook.

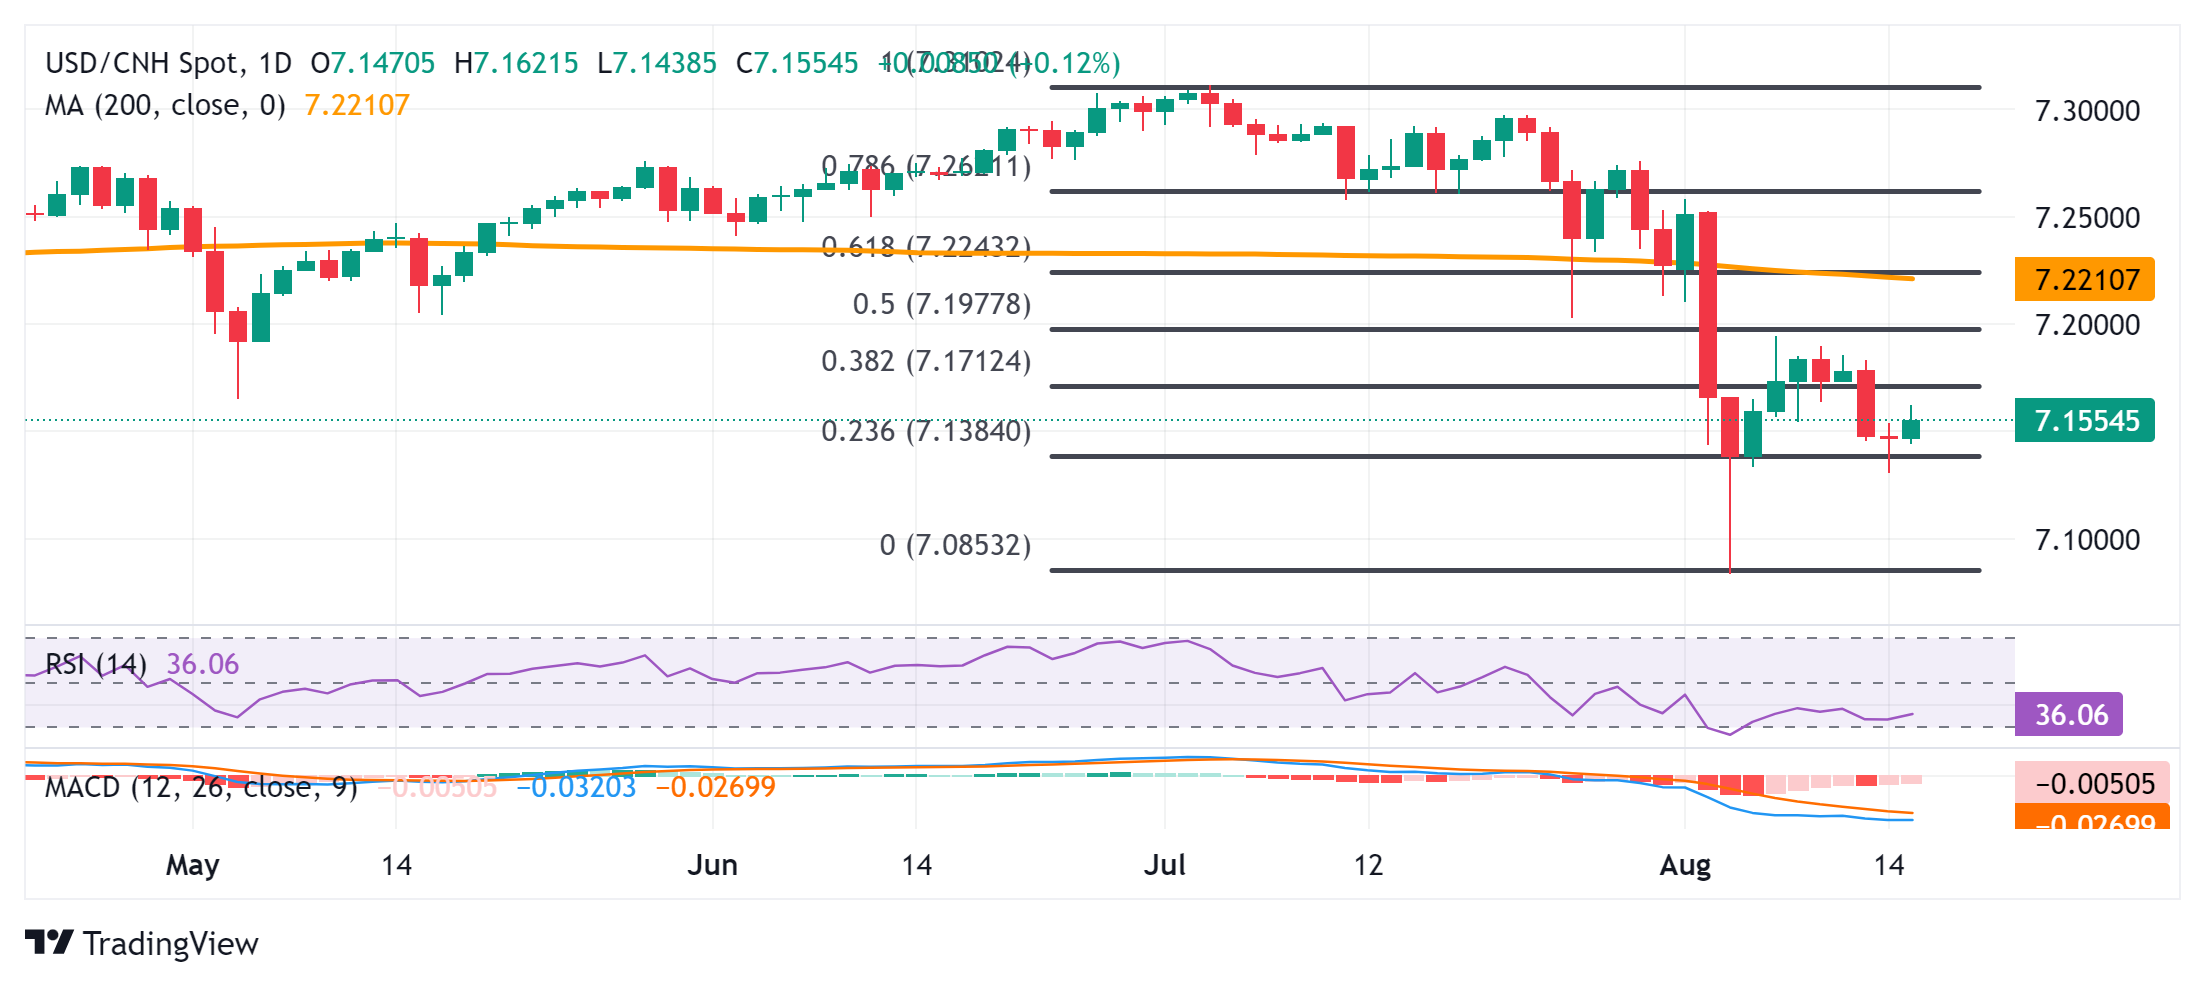
The USD/CNH pair builds on the previous day's bounce from the 7.1305-7.1300 area, or over a one-week low and gains some follow-through positive traction during the Asian session on Thursday. Spot prices stick to modest intraday gains near the 7.1560 area, though the mixed technical set-up warrants some caution before positioning for any further appreciating move. 

The USD/CNH pair, so far, has been showing some resilience below the 23.6% Fibonacci retracement level of the July-August fall and the subsequent move up favors bullish traders. That said, oscillators on the daily chart are holding deep in negative territory and are still away from being in the oversold zone. Hence, any further positive move is more likely to attract fresh sellers near the 7.1845-7.1850 region and remain capped near the 7.1895-7.1900 area. 

The latter is followed by the 50% Fibo. level, around the 7.1975-7.1980 zone, which should now act as a key pivotal point. A sustained strength beyond the said barrier will suggest that the USD/CNH pair has bottomed out near the 7.0835 region, or the lowest level since June 2023 touched last week and pave the way for some meaningful appreciating move. 

On the flip side, the 7.1500 level is likely to protect the immediate downside, below which the USD/CNH pair could accelerate the fall back towards challenging the multi-month low, around the 7.0835 region. Some follow-through selling will be seen as a fresh trigger for bearish traders and set the stage for an extension of the recent sharp pullback from the YTD peak touched in July.

USD/CNH daily chart

fxsoriginal

US Dollar PRICE Today

The table below shows the percentage change of US Dollar (USD) against listed major currencies today. US Dollar was the strongest against the Euro.

  USD EUR GBP JPY CAD AUD NZD CHF
USD   0.04% -0.05% 0.01% -0.02% -0.31% 0.03% -0.01%
EUR -0.04%   -0.10% -0.03% -0.06% -0.45% -0.18% -0.03%
GBP 0.05% 0.10%   0.09% 0.07% -0.33% -0.07% 0.14%
JPY -0.01% 0.03% -0.09%   -0.05% -0.36% -0.14% 0.05%
CAD 0.02% 0.06% -0.07% 0.05%   -0.30% -0.11% 0.10%
AUD 0.31% 0.45% 0.33% 0.36% 0.30%   0.25% 0.46%
NZD -0.03% 0.18% 0.07% 0.14% 0.11% -0.25%   0.21%
CHF 0.00% 0.03% -0.14% -0.05% -0.10% -0.46% -0.21%  

The heat map shows percentage changes of major currencies against each other. The base currency is picked from the left column, while the quote currency is picked from the top row. For example, if you pick the US Dollar from the left column and move along the horizontal line to the Japanese Yen, the percentage change displayed in the box will represent USD (base)/JPY (quote).


Isenção de responsabilidade: Apenas para fins informativos. O desempenho passado não é indicativo de resultados futuros.
placeholder
Mercados em 2026: Ouro, Bitcoin e o Dólar voltarão a fazer história? — Veja o que pensam as principais instituiçõesApós um ano turbulento, o que esperar dos mercados de commodities, forex e criptomoedas em 2026?
Autor  Mitrade Team
25 dez. 2025
Após um ano turbulento, o que esperar dos mercados de commodities, forex e criptomoedas em 2026?
placeholder
Bitcoin oscila nos US$ 90 mil sob expectativa de decisão sobre tarifas comerciais nos Estados UnidosO Bitcoin (BTC) iniciou a sessão desta sexta-feira gravitando em torno da marca psicológica dos US$ 90.000, enquanto os investidores se preparam para anúncios cruciais vindos de Washington. O mercado de criptoativos opera em um estado de cautela extrema, refletindo a ansiedade global sobre as novas políticas comerciais norte-americanas.
Autor  Pedro Augusto Prazeres
1 Mês 12 Dia Seg
O Bitcoin (BTC) iniciou a sessão desta sexta-feira gravitando em torno da marca psicológica dos US$ 90.000, enquanto os investidores se preparam para anúncios cruciais vindos de Washington. O mercado de criptoativos opera em um estado de cautela extrema, refletindo a ansiedade global sobre as novas políticas comerciais norte-americanas.
placeholder
Bitcoin atinge máxima de US$ 95,4 mil; adiamento da Lei Clarity sinaliza resiliência do mercadoO Bitcoin atingiu uma nova máxima semanal de 95.472 dólares nesta terça-feira, 13 de janeiro de 2026. O movimento de alta ocorreu em um momento de calmaria institucional, enquanto legisladores norte-americanos adiavam as discussões sobre a Lei Clarity.
Autor  Pedro Augusto Prazeres
Ontem 02: 23
O Bitcoin atingiu uma nova máxima semanal de 95.472 dólares nesta terça-feira, 13 de janeiro de 2026. O movimento de alta ocorreu em um momento de calmaria institucional, enquanto legisladores norte-americanos adiavam as discussões sobre a Lei Clarity.
placeholder
Ibovespa renova máxima histórica em meio a tensões diplomáticas e descolamento do dólarO Ibovespa encerrou a sessão desta quarta-feira em patamar inédito, registrando uma valorização de 1,96% aos 165.145,98 pontos. O ganho de mais de 3 mil pontos reflete um ajuste de expectativas do mercado frente ao cenário político local e à força das commodities.
Autor  Pedro Augusto Prazeres
7 horas atrás
O Ibovespa encerrou a sessão desta quarta-feira em patamar inédito, registrando uma valorização de 1,96% aos 165.145,98 pontos. O ganho de mais de 3 mil pontos reflete um ajuste de expectativas do mercado frente ao cenário político local e à força das commodities.
placeholder
Ethereum rompe padrão técnico e sinaliza retomada rumo aos US$ 4 milO Ethereum demonstra uma recuperação vigorosa nas últimas jornadas, registrando uma valorização próxima de 7% em um intervalo de apenas 24 horas. Esse movimento consolidou uma estrutura de alta no gráfico de 12 horas, indicando que o mercado encontrou um suporte sólido para testar patamares superiores.
Autor  Pedro Augusto Prazeres
7 horas atrás
O Ethereum demonstra uma recuperação vigorosa nas últimas jornadas, registrando uma valorização próxima de 7% em um intervalo de apenas 24 horas. Esse movimento consolidou uma estrutura de alta no gráfico de 12 horas, indicando que o mercado encontrou um suporte sólido para testar patamares superiores.
goTop
quote