


Dow Jones Industrial Average splits from the pack and sheds 150 points
- The Dow Jones backslid around 150 points on Thursday.
- US equities are overall higher, but losses in key tech stocks are punishing the Dow.
- Earnings brought more downside misses in overvalued silicon companies.
The Dow Jones Industrial Average (DJIA) slid on Thursday, falling around 150 points to retest the 44,750 level. Earnings reports dominated US equities on Thursday, with the tech sector suffering a string of missed revenue and growth expectations.
US economic data was strictly mid-tier, though week-on-week Initial Jobless Claims rose to 219K through the week ended January 31. Median market forecasts expected a print of 213K, and the previous week’s figure was revised slightly to 208K.
Another Nonfarm Payrolls (NFP) jobs data dump looms on Friday. Net job additions are expected to ease to 170K in January, down from December’s print of 256K. Revisions to older data will be closely watched this week. Post-print revisions drifted toward the stronger side during 2024, frustrating market participants hoping for cracks in the US employment landscape to help push the Federal Reserve (Fed) toward more rate cuts.
Dow Jones news
In aggregate terms, the Dow Jones is roughly on-balance on Thursday, with about half of the equity board’s listed securities testing the high side. Nvidia (NVDA) topped the pile, gaining 2.2% and clawing back to $127 per share, followed closely by Caterpillar inc, which rose 2% to $366 per share.
Honeywell (HON) tumbled 5.2%, falling to $210 per share after issuing annual forward guidance that fell short of analyst expectations. Salesforce (CRM) also backslid, declining 4.2% to $210 per share as the AI rally sputters out.
Dow Jones price forecast
The Dow Jones is set to snap a three-day winning streak as the 45,000 handle proves to be too slick of a surface for bulls to get a foothold on. Despite a softer stance on Thursday, the Dow is holding stubbornly in bull country, in the green by 5.2% so far in 2025.
A technical floor is priced in at the 50-day Exponential Moving Average (EMA) near 43,700. On the high side, the immediate target for bidders will be record highs set in December just above 45,065.
Dow Jones daily chart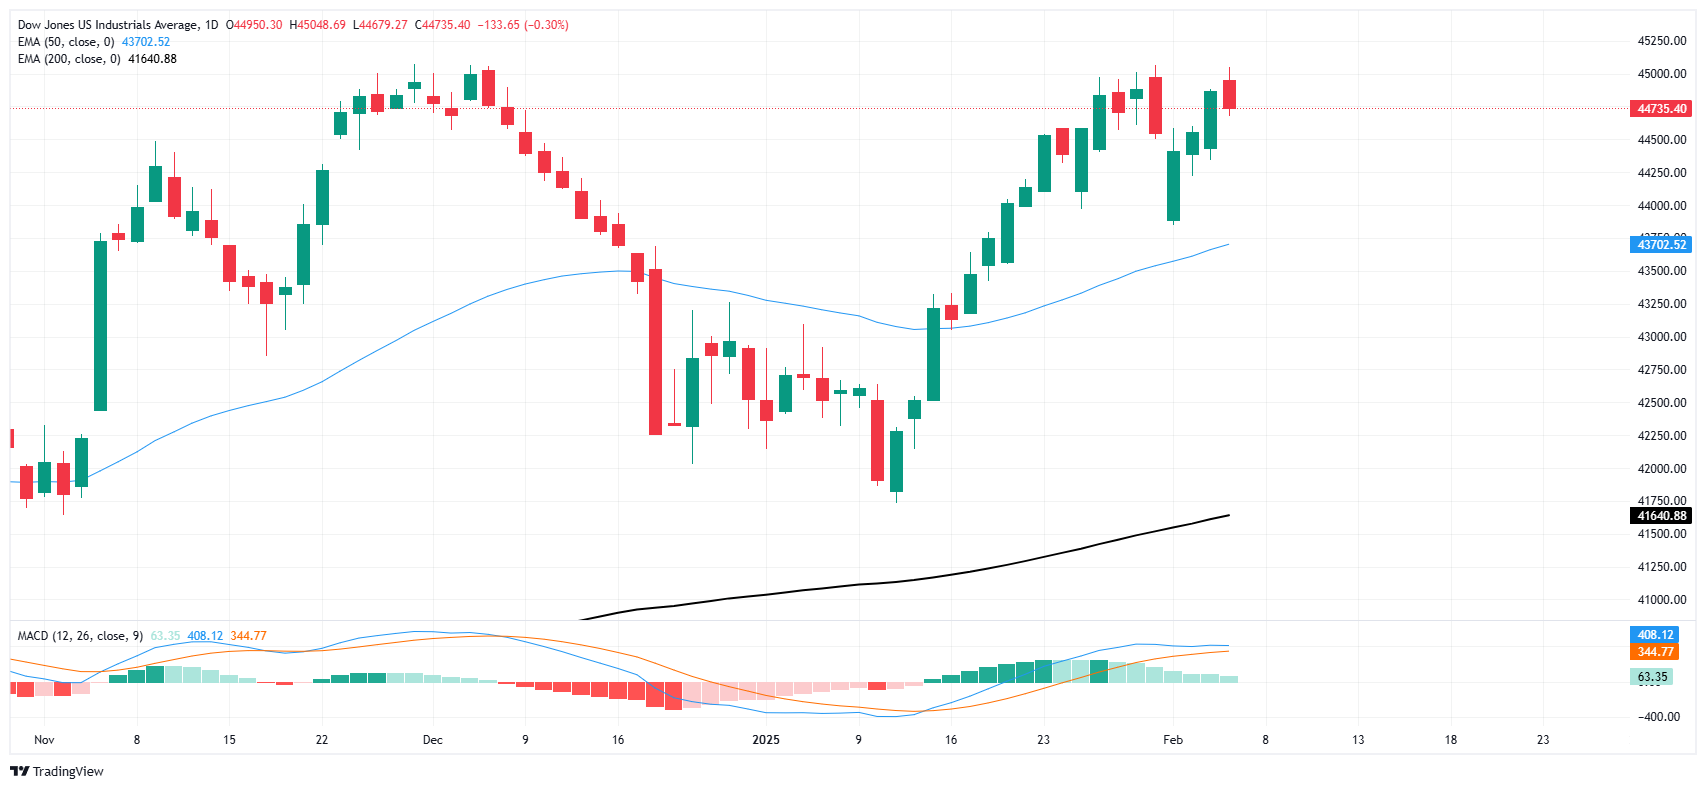
Dow Jones FAQs
The Dow Jones Industrial Average, one of the oldest stock market indices in the world, is compiled of the 30 most traded stocks in the US. The index is price-weighted rather than weighted by capitalization. It is calculated by summing the prices of the constituent stocks and dividing them by a factor, currently 0.152. The index was founded by Charles Dow, who also founded the Wall Street Journal. In later years it has been criticized for not being broadly representative enough because it only tracks 30 conglomerates, unlike broader indices such as the S&P 500.
Many different factors drive the Dow Jones Industrial Average (DJIA). The aggregate performance of the component companies revealed in quarterly company earnings reports is the main one. US and global macroeconomic data also contributes as it impacts on investor sentiment. The level of interest rates, set by the Federal Reserve (Fed), also influences the DJIA as it affects the cost of credit, on which many corporations are heavily reliant. Therefore, inflation can be a major driver as well as other metrics which impact the Fed decisions.
Dow Theory is a method for identifying the primary trend of the stock market developed by Charles Dow. A key step is to compare the direction of the Dow Jones Industrial Average (DJIA) and the Dow Jones Transportation Average (DJTA) and only follow trends where both are moving in the same direction. Volume is a confirmatory criteria. The theory uses elements of peak and trough analysis. Dow’s theory posits three trend phases: accumulation, when smart money starts buying or selling; public participation, when the wider public joins in; and distribution, when the smart money exits.
There are a number of ways to trade the DJIA. One is to use ETFs which allow investors to trade the DJIA as a single security, rather than having to buy shares in all 30 constituent companies. A leading example is the SPDR Dow Jones Industrial Average ETF (DIA). DJIA futures contracts enable traders to speculate on the future value of the index and Options provide the right, but not the obligation, to buy or sell the index at a predetermined price in the future. Mutual funds enable investors to buy a share of a diversified portfolio of DJIA stocks thus providing exposure to the overall index.
Artigos Recomendados


