


Dow Jones Industrial Average brings up the rear as markets price an unsigned Iran truce
- The Dow lagged the S&P 500 and Nasdaq even with the index parked near record highs.
- Stocks spiked on reports of a 60-day US-Iran ceasefire MOU that neither side has actually signed.
- Core PCE inflation hit a multi-year high while rate futures lean toward hikes, not the cuts bulls keep pricing.
The Dow Jones Industrial Average (DJIA) sat a hair higher into the New York afternoon, up roughly 0.10% on the day, which sounds respectable until you look sideways at the S&P 500 (+0.55%) and the Nasdaq (+0.79%) and notice the blue chips spent the session bringing up the rear. The bid rests on two pieces of wishful thinking. The first is a report, citing US officials, that Washington and Tehran agreed a 60-day memorandum of understanding (MOU) to extend the ceasefire and open nuclear talks. The catch, and it is a big one, is that nobody with the authority to sign has signed: President Donald Trump has not given final approval, and Iran has not confirmed acceptance. Markets, as ever, traded the optimistic version first and left the fine print for later.
The intraday tape shows how reflexive it was. Futures got flushed toward 50,500 on a headline that Iran's Revolutionary Guard had struck a US airbase, then ripped close to 50,750 within minutes of the deal report crossing the wires.
Why the blue chips drew the short straw
The Dow's underperformance is mechanical, not mysterious. The index is price-weighted and light on the cloud and chip names doing the heavy lifting elsewhere. Snowflake's roughly 35% melt-up on blowout guidance and a $6 billion Amazon Web Services (AWS) commitment is a gift to the Nasdaq and S&P 500, not to a basket of industrials and staples. Worse, the same Crude Oil pullback that is broadly risk-positive drags on Chevron, one of the Dow's heavier components: cheaper energy lifts the wider market while weighing on the one big oil name the blue chips actually carry.
A truce that exists mostly on paper
Here is where the optimism gets stretched. US officials have framed the deal as essentially done, briefing that Iranian leadership had blessed the broad template and that only procedural sign-off remains. Iranian state media tell a different story. Outlets close to the Revolutionary Guard have signaled Tehran will not sign unless every clause is fully agreed and guaranteed, with the mechanism for unfreezing Iranian assets and the scope of a Lebanon ceasefire still unresolved. Iran's Supreme Leader has not given final approval, and that distinction matters: a template Washington "understands" to be endorsed is not the same as a signed document. Add Trump's standing demand that Iran surrender control of the Strait of Hormuz, and the gap between the headline and the actual paperwork looks wide. The market is pricing a done deal; the negotiators are still pricing a draft.
The inflation print the bid is ignoring
The macro story is where the wishful thinking gets expensive. The marquee release on this morning's 12:30 GMT docket was the core Personal Consumption Expenditures Price Index (PCE), the Federal Reserve's (Fed) preferred inflation gauge, and the surface read looked friendly: core prices rose 0.2% MoM, a tick under the 0.3% consensus and a slowdown from March. Look past the monthly noise, though, and the trend is unfriendly. Core PCE climbed to 3.3% YoY, the hottest in more than two years, while the headline rate hit 3.8% YoY, a three-year high. The driver is no mystery: the Iran war's energy shock, the very Strait of Hormuz disruption this "deal" is meant to unwind, has been bleeding through the consumer basket for months. The same batch of data showed first-quarter Gross Domestic Product (GDP) revised down to a 1.6% annualized pace from 2%, personal income flat on the month, and households running their savings rate down to a near four-year low just to keep spending. That is not a goldilocks backdrop.
So the "cooler inflation, cuts are coming" reflex powering the risk bid is, politely, a stretch. Rate futures are not pricing cuts at all; the market is leaning toward the Fed's next move being a hike, with roughly even odds of at least one increase by year-end and policymakers widely expected to sit on their hands until late 2026 at the earliest. New Fed Chair Kevin Warsh has floated that rates could eventually come down, but he is outnumbered on the Federal Open Market Committee (FOMC). In other words, equities are celebrating a dovish turn the people setting policy have not signed up for, which rhymes neatly with celebrating a peace deal the negotiators have not signed either.
Trading the divergence
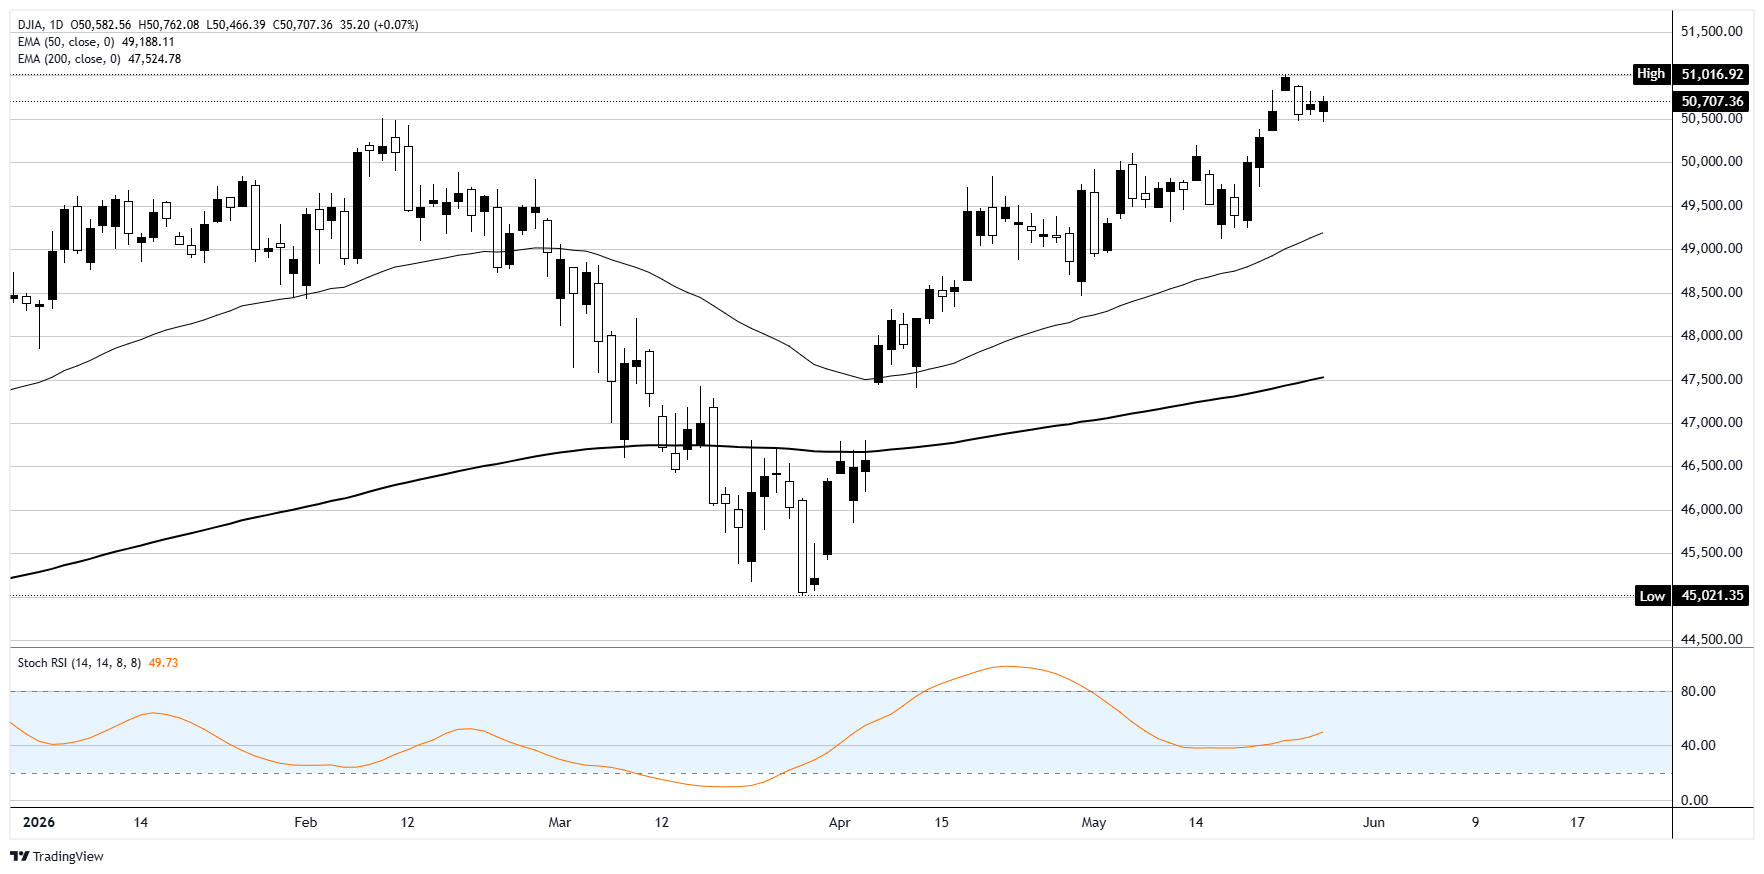
The trend is intact. The daily chart holds well above the 50-period Exponential Moving Average (EMA) near 49,200 and far clear of the 200 EMA around 47,500, so this is a momentum pause until proven otherwise. The fuel is the problem: the 5-minute Stochastic Relative Strength Index (Stoch RSI) has rolled toward 37 while the daily reads a noncommittal level close to 50, the profile of a tape that has spent its good news.
Resistance is the 51,000 record zone, and a clean break through it needs an actual signature, not another "close" headline. First support is around 50,500, the level this morning's flush defended; lose it and 50,000 becomes the next psychological magnet, with the 50 EMA the deeper trend line. The calendar offers no rescue. With core PCE already out, the rest of the week thins to Friday's Chicago Purchasing Managers Index (PMI) and a steady parade of Fed speakers, none of it red-band, which leaves the political binary squarely in charge. Trump's signature, or an Iranian rejection surfacing through Tehran's media, will move this faster than any data point, and the same headline that reopens Hormuz is the one that decides whether the inflation problem eases or worsens. Lean with the trend, but keep the stop honest, because this is the kind of rally that unwinds on a single Truth Social post.
Dow Jones daily chart
Futures FAQs
The futures market is an exchange-based auction in which participants buy and sell contracts of an underlying asset at a predetermined future date and price. The set price is agreed upon today and is derived from the underlying asset. Futures contracts can be based on a wide range of assets, with commodities among the most popular, although currencies and indices are other common underlying assets. Futures prices depend on their underlying asset and act as a mechanism for firms, institutions, and large-position traders to manage risks through hedging.
Futures can be traded in different ways. The most common ways are via a regulated exchange or via Contracts For Difference (CFDs). In the former, liquidity is high and pricing is more transparent, with the broker serving only as an intermediary between you and the market. Still, it generally requires more capital. The largest futures exchanges are the Chicago Mercantile Exchange (CME) and the New York Mercantile Exchange (NYME). As for CFDs, these require less capital and thus trading is more flexible, but at the cost of less transparency.
The E-mini S&P 500 index, Crude Oil (Brent, WTI), Natural Gas, Gold, Silver, Copper, and soft commodities such as grains are among the most actively traded contracts. These offer strong liquidity and are closely followed by traders worldwide. Futures market volume consistently exceeds spot market volume, often significantly. This dominance is driven by leverage, hedging, and higher liquidity on exchanges.
Yes. Future gauges, particularly equity index futures such as those of the S&P 500 or the Nasdaq, are widely considered key gauges of market sentiment because they reflect investors’ expectations for the next session’s opening price. When equity futures drop, it is a sign of risk-aversion, signaling bearish market sentiment. On the contrary, rising equity futures suggest markets are risk on.
As a futures contract approaches its maturity date, the futures price converges upon the spot price, becoming almost identical at expiration. However, prices can diverge significantly before the contract ends. A market is in contango when future prices are higher than spot prices, while the mirror image is called backwardation (when current prices are higher than future prices). For commodities, the normal state of the market is contango because holding the asset over time incurs costs such as storage or insurance fees. When markets turn from contango to backwardation – or vice versa – it signals a shift in the trend: a change from contango to backwardation is taken as a bullish sign, while going from backwardation to contango is generally considered bearish.
Artigos Recomendados


