


Dow Jones Industrial Average turns lower following strong US manufacturing data
- Dow Jones corrects lower following strong US manufacturing activity data.
- Real Estate and Health sectors are leading losses, while Communication Services and Energy advance.
- DJIA corrects lower after rejection at the 40,000 psychological level.
The Dow Jones Industrial Average (DJIA) is going through a significant pullback on Monday. The positive surprise in the US ISM Manufacturing PMI Index confirms strong US economic momentum and pours cold water on the US Federal Reserve’s (Fed) easing expectations.
The US manufacturing sector’s activity expanded again after more than one year of contraction. The headline PMI rose to 50.3 from 47.8 in March, beating expectations of a milder increase to 48.4. Beyond that, the Prices Paid sub-index surged to 55.8, its highest reading since July 2022 and a positive contribution to inflationary trends.
These figures will likely back Fed hawks’ view that there is no rush to start lowering borrowing costs. This week we have a string of Fed speakers and key employment figures to provide more clues about the central bank’s plans.
Dow Jones news
The Dow Jones Index dropped 0.56% during the Monday morning session, with most sectors in the red. The Real Estate and Health sectors are the biggest losers, dropping 1.29% and 1.16% each. On the positive side, Communication Services picked up 1%, and the Energy sector advanced 0.32%.
Home Depot (HD) shares are leading the decline with a 2.32% drop to $374.69, followed by Nike (NKE), down 2.16% to $91.97. Boeing (BA) continued bleeding with the company under a major crisis that has led to the replacement of the board. The planemaker loses 1.59% to $189.92.
On the positive side, 3M (MMM) outperformed the rest of the companies in the Index with a 3.63% jump to $91.90, followed by Microsoft (MSFT), up 0.7% to $423.82.
Dow Jones technical outlook
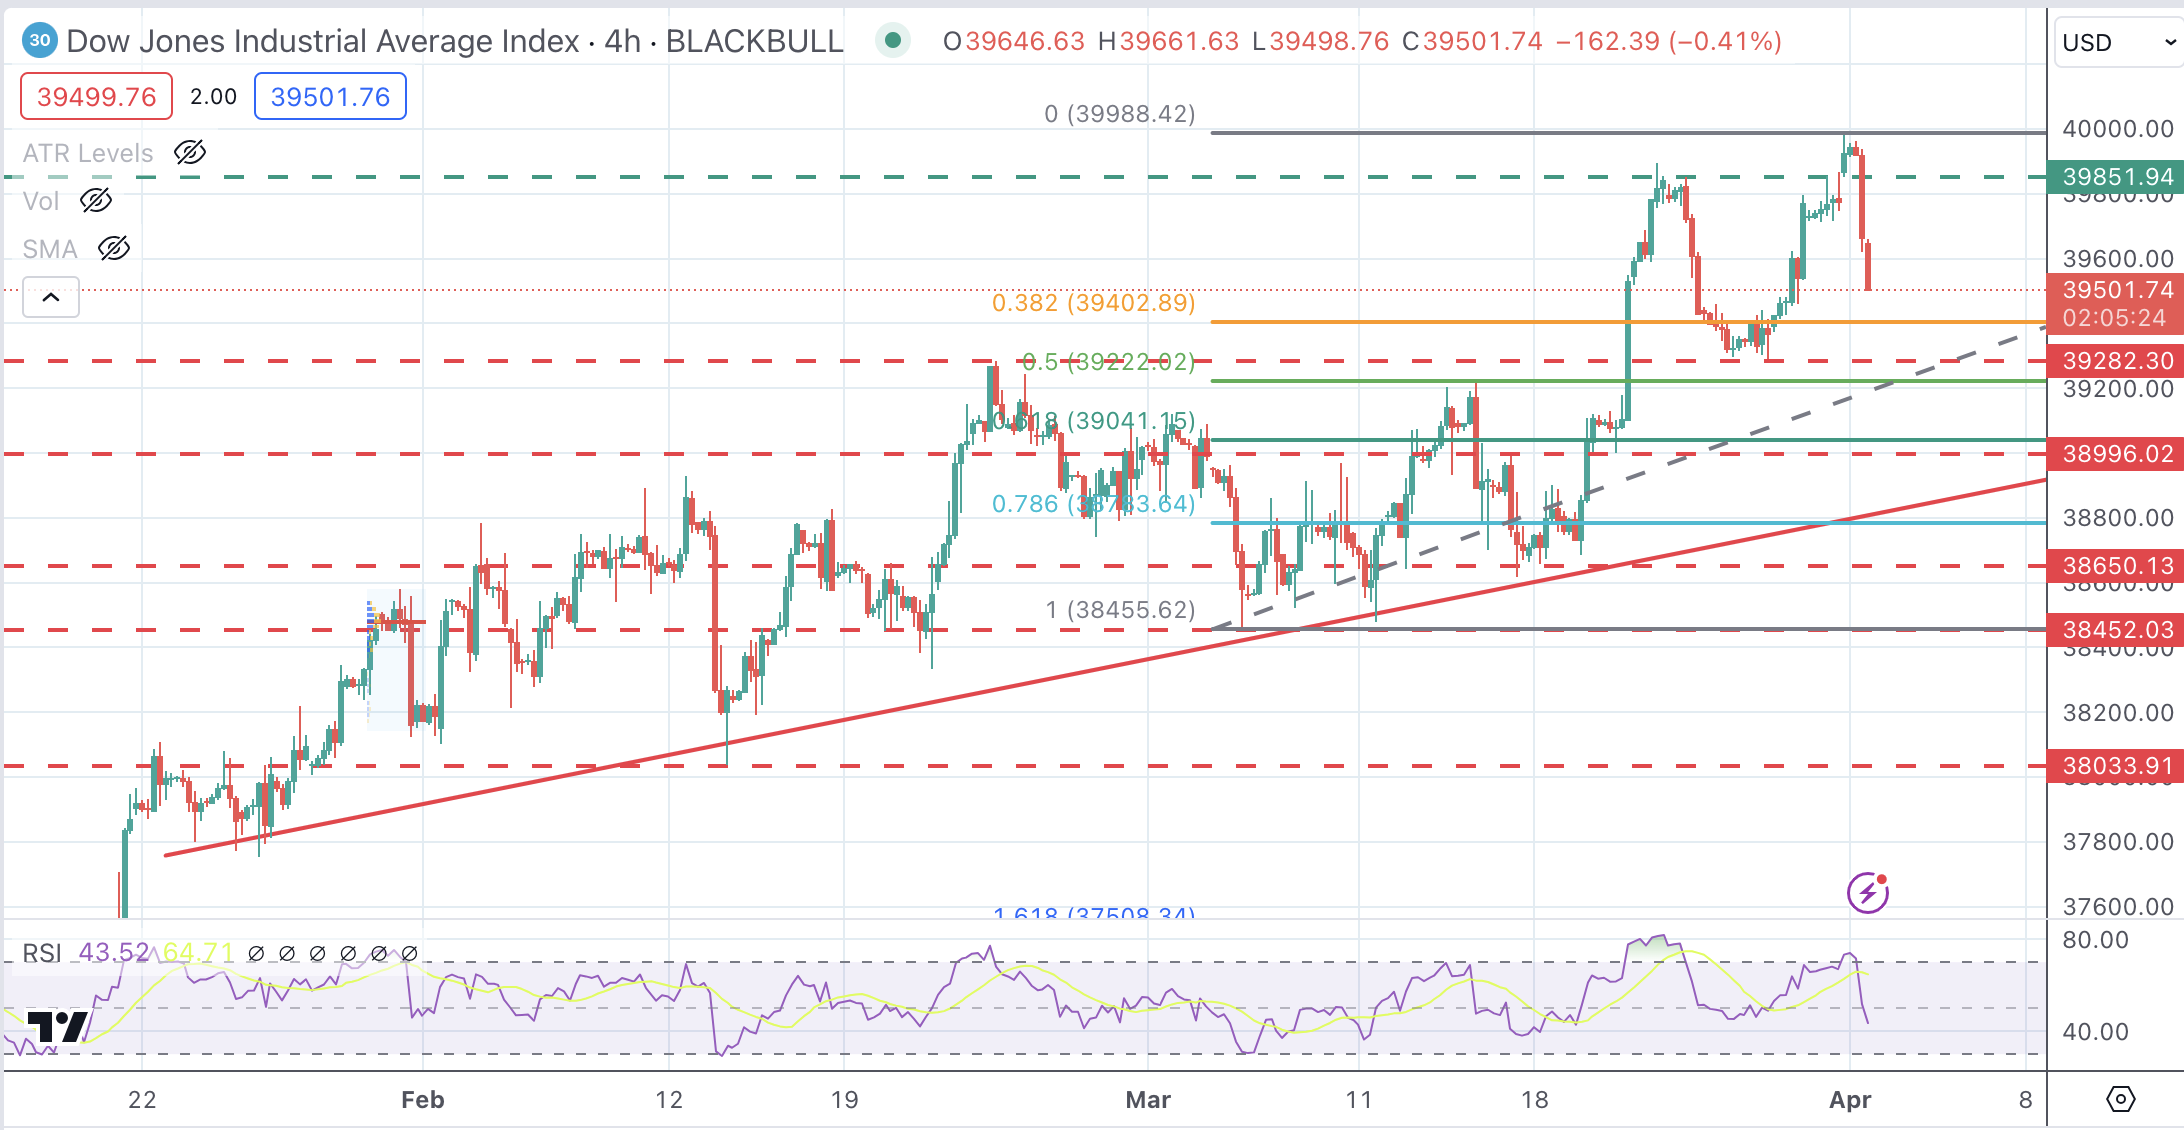
The Dow Jones Index is going through a significant downward correction on Monday, giving away half of the ground taken last week. The overall trend remains bullish, but the pullback from all-time highs gives bears hopes of testing support at the previous resistance level of 39,240.
DJIA remains bullish, standing comfortably above previous highs and the 4-hour 50 Simple Moving Average (SMA) at 39,250. Below here, the next downside targets lie at the 39,000 level and the trendline support at 38,775.
Further down, the trendline resistance from late January lows at 38,850 would be next.
On the upside, the resistance area between 39,850 and the 40,000 psychological levels seems a tough nut to crack for bulls.
DJIA 4-Hour Chart
Dow Jones FAQs
The Dow Jones Industrial Average, one of the oldest stock market indices in the world, is compiled of the 30 most traded stocks in the US. The index is price-weighted rather than weighted by capitalization. It is calculated by summing the prices of the constituent stocks and dividing them by a factor, currently 0.152. The index was founded by Charles Dow, who also founded the Wall Street Journal. In later years it has been criticized for not being broadly representative enough because it only tracks 30 conglomerates, unlike broader indices such as the S&P 500.
Many different factors drive the Dow Jones Industrial Average (DJIA). The aggregate performance of the component companies revealed in quarterly company earnings reports is the main one. US and global macroeconomic data also contributes as it impacts on investor sentiment. The level of interest rates, set by the Federal Reserve (Fed), also influences the DJIA as it affects the cost of credit, on which many corporations are heavily reliant. Therefore, inflation can be a major driver as well as other metrics which impact the Fed decisions.
Dow Theory is a method for identifying the primary trend of the stock market developed by Charles Dow. A key step is to compare the direction of the Dow Jones Industrial Average (DJIA) and the Dow Jones Transportation Average (DJTA) and only follow trends where both are moving in the same direction. Volume is a confirmatory criteria. The theory uses elements of peak and trough analysis. Dow’s theory posits three trend phases: accumulation, when smart money starts buying or selling; public participation, when the wider public joins in; and distribution, when the smart money exits.
There are a number of ways to trade the DJIA. One is to use ETFs which allow investors to trade the DJIA as a single security, rather than having to buy shares in all 30 constituent companies. A leading example is the SPDR Dow Jones Industrial Average ETF (DIA). DJIA futures contracts enable traders to speculate on the future value of the index and Options provide the right, but not the obligation, to buy or sell the index at a predetermined price in the future. Mutual funds enable investors to buy a share of a diversified portfolio of DJIA stocks thus providing exposure to the overall index.
Artigos Recomendados


