


Solana Price Forecast: SOL rally remains capped as ETF inflows ease
- Solana hovers around $120 on Monday, ticking lower after four consecutive days of recovery.
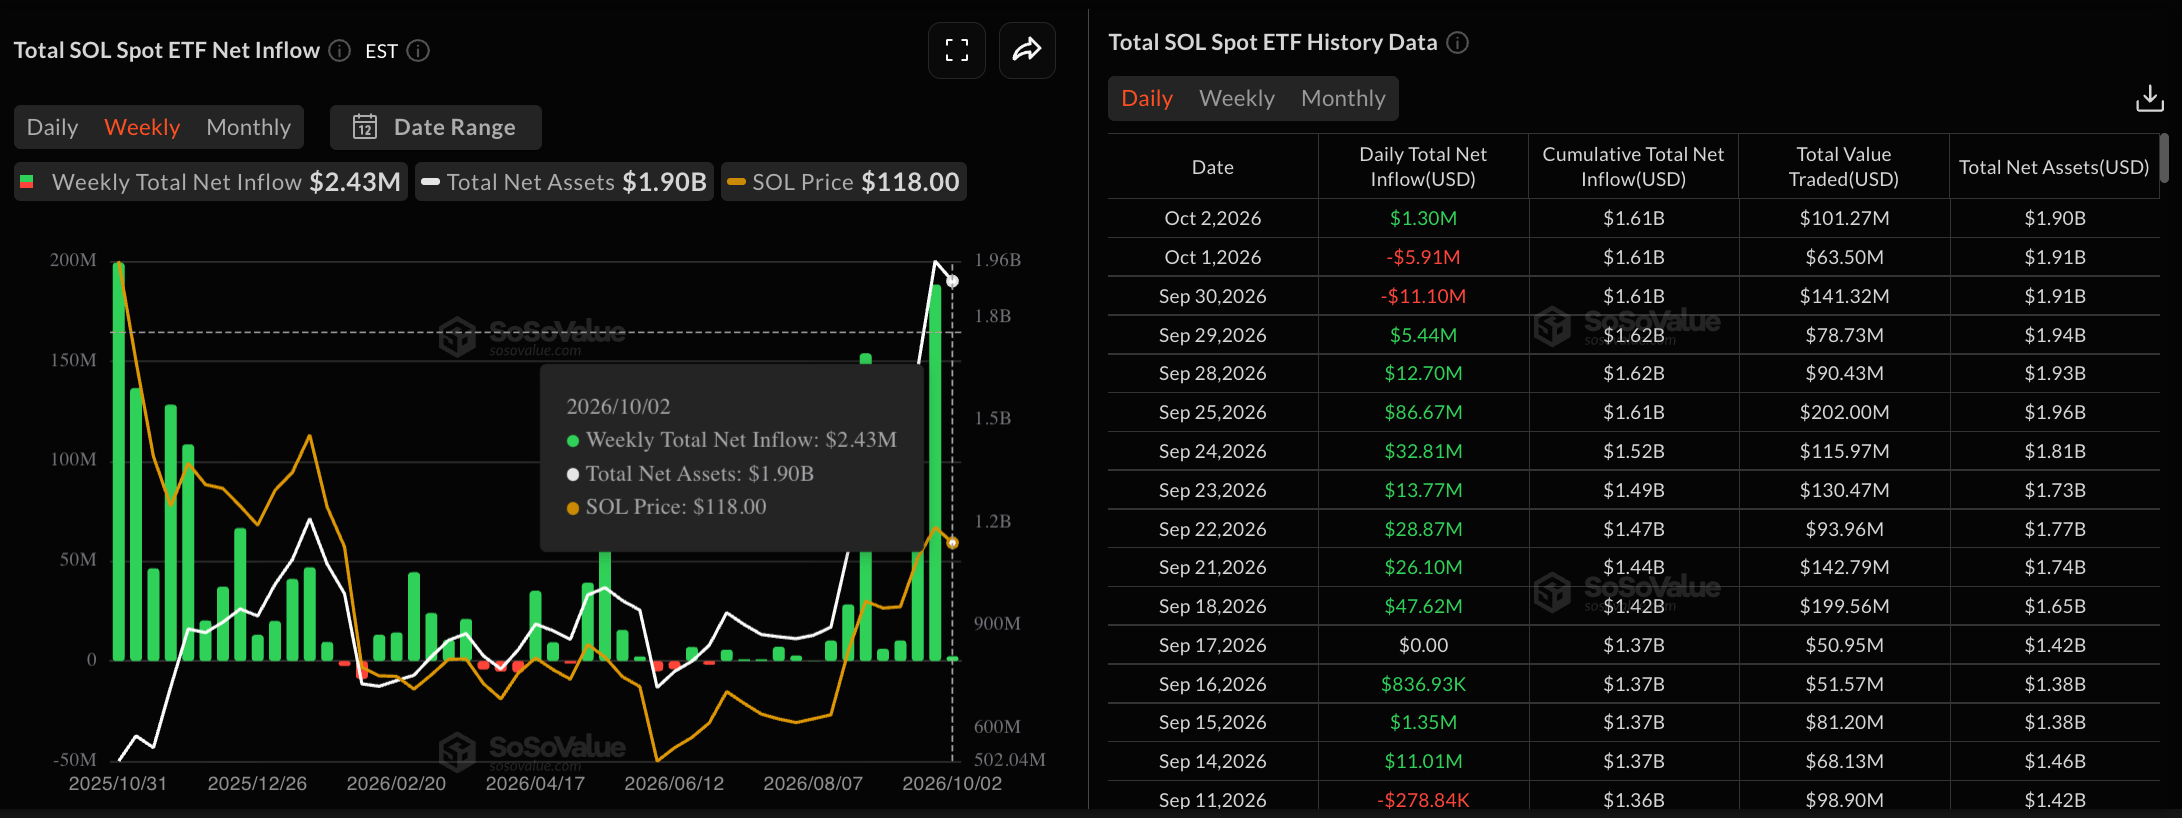
- SOL-focused ETF inflows fell below $2.50 million last week, suggesting easing institutional demand.
- The technical outlook for SOL remains mildly bullish, with a triangle pattern forming on the four-hour chart.
Solana (SOL) price edges lower on Monday, hovering around $120 after four consecutive days of trading in the green. The institutional support for SOL eased last week, with total inflows of less than $2.50 million, from over $188 million in the previous week. The technical outlook for SOL remains mildly bullish, forming a triangle pattern on the four-hour chart.
Mixed institutional support
Solana sees a steep decline in total weekly inflows from Exchange-Traded Funds (ETFs). SoSoValue data shows SOL-focused ETFs recorded $2.43 million in inflows last week, down from $188.22 million, marking its 14th consecutive positive week but significantly reduced institutional demand.
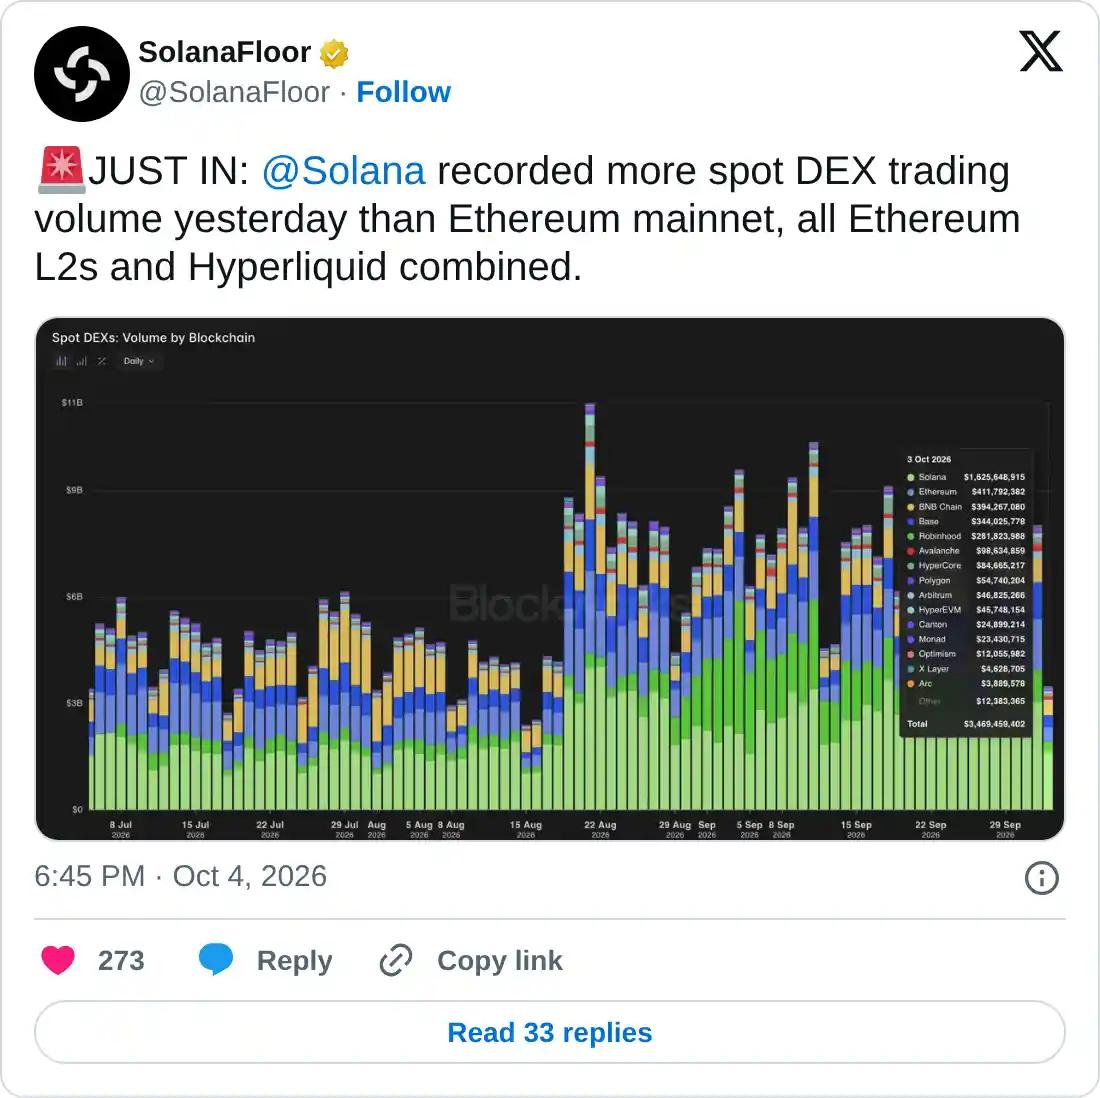
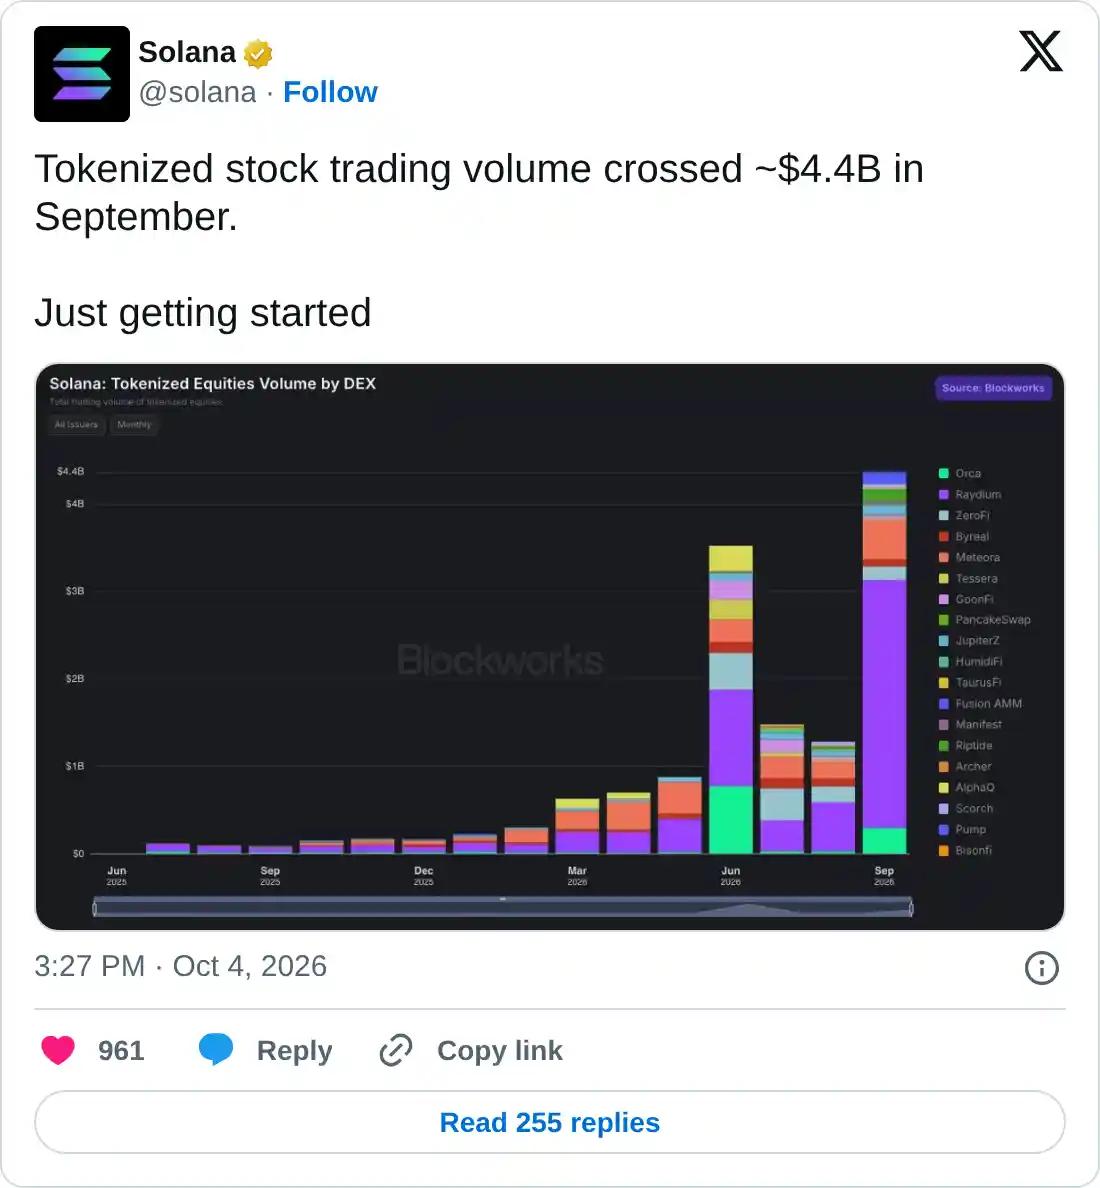
The Solana network shows steady growth despite easing institutional inflows. SolanaFloor data shows that Solana DEX trading volume on Sunday surpassed the combined volume of Ethereum mainnet, its Layer-2 protocols, and Hyperliquid. In addition, the Real-World Assets (RWAs) trading on Solana witnessed over $4.4 billion in volume from tokenized stocks. This suggests early signs of bringing traditional equities to the Solana ecosystem to bridge the gap between crypto and the broader capital markets.
Technical outlook: Solana holds stable as bullish bias persists
Solana edges lower on Monday after a steady recovery seen over the last four days. SOL holds a constructive bullish bias as price remains above the 50-, 100-, and 200-period Exponential Moving Averages (EMAs) on the four-hour chart around $119.24, $116.43, and $110.44.
From a technical perspective, SOL is positioned well above the upward support trendline at $119.16, keeping the recent recovery phase intact, while an overhead near-term resistance trendline near $123 suggests a triangle pattern.
Momentum on the daily chart is constructive, with a mildly positive Moving Average Convergence Divergence (MACD) and a Relative Strength Index (RSI) near 54, suggesting bullish momentum.
A confirmed breakout of the resistance cluster formed by the trendline near $123 and September's high of $124.95 could further extend the Solana rally. The Fibonacci retracement measured from $95.82 to $124.95 projects the 127.2% extension level at $132.87 as the next bullish target.
On the downside, immediate support is seen at the 50-period EMA near $119.25, reinforced by the reclaimed rising trendline at $119.16 and the 78.6% Fibonacci retracement at $118.71. A break below these would expose deeper cushions at the 100-period EMA around $116.43.
(The technical analysis of this story was written with the help of an AI tool. Know more.)
Artigos Recomendados


