


Ripple and Stellar outlook: XRP and XLM rebound amid mixed signals
- XRP extends its rebound, trading at $1.300 on Thursday after finding support around the key EMAs the previous day.
- XLM trades at $0.184 after recovering over 4% on Wednesday.
- Mixed derivatives and on-chain data suggest indecisiveness and a cautious stance among traders.
Ripple (XRP) and Stellar (XLM) extend their recovery at the time of writing on Thursday after finding support at key technical levels. However, mixed derivatives and on-chain data for both altcoins suggest that traders remain cautious and have yet to show strong conviction in a sustained rebound.
Mixed derivatives metrics signal
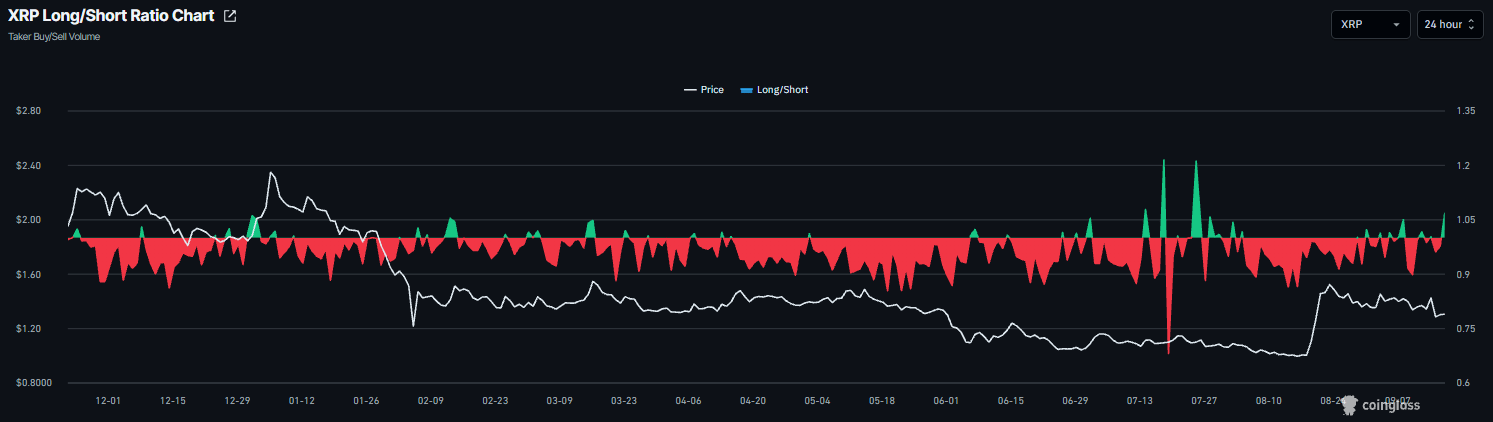
Derivatives data shows a mixed and cautious outlook among traders. CoinGlass’ long-to-short ratios for Ripple read 1.06 on Thursday, nearing the highest level over a month. A ratio above one indicates bullish sentiment, as traders bet that asset prices will rise.
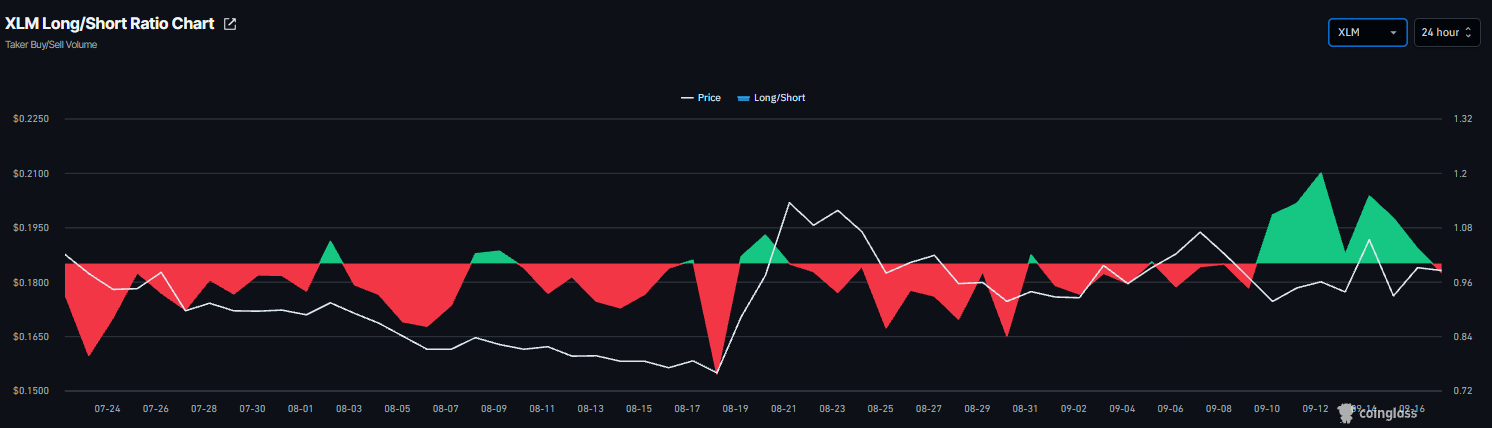
Meanwhile, XLM’s ratio read 0.97 on Thursday. A ratio below one indicates bearish sentiment, as traders bet that asset prices will fall.
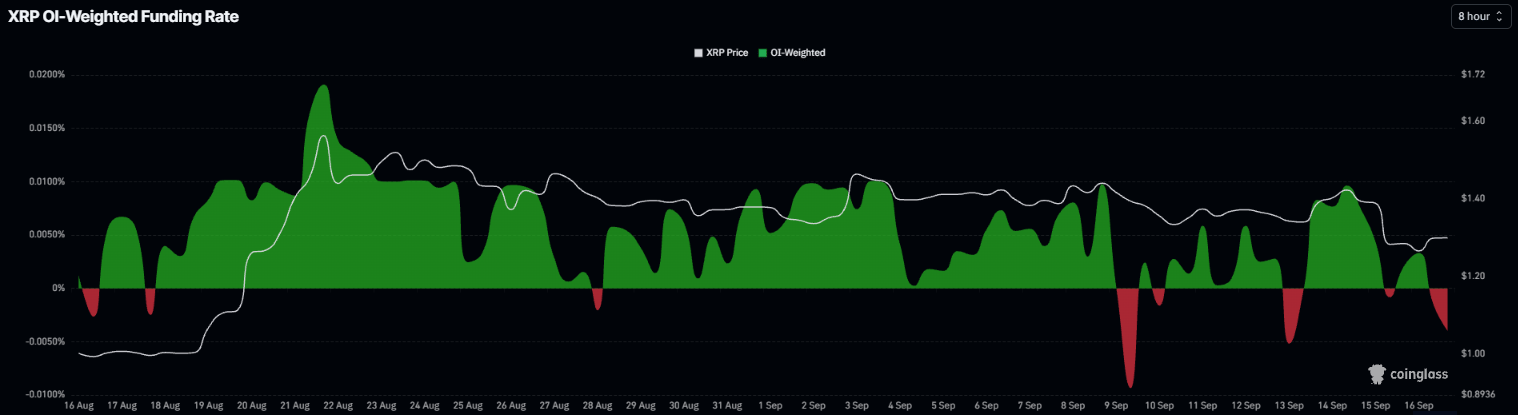
In addition, the XRP funding rate flipped negative on Wednesday, reading -0.0040% on Thursday. This indicates shorts are paying longs, reflecting a bearish outlook for XRP.
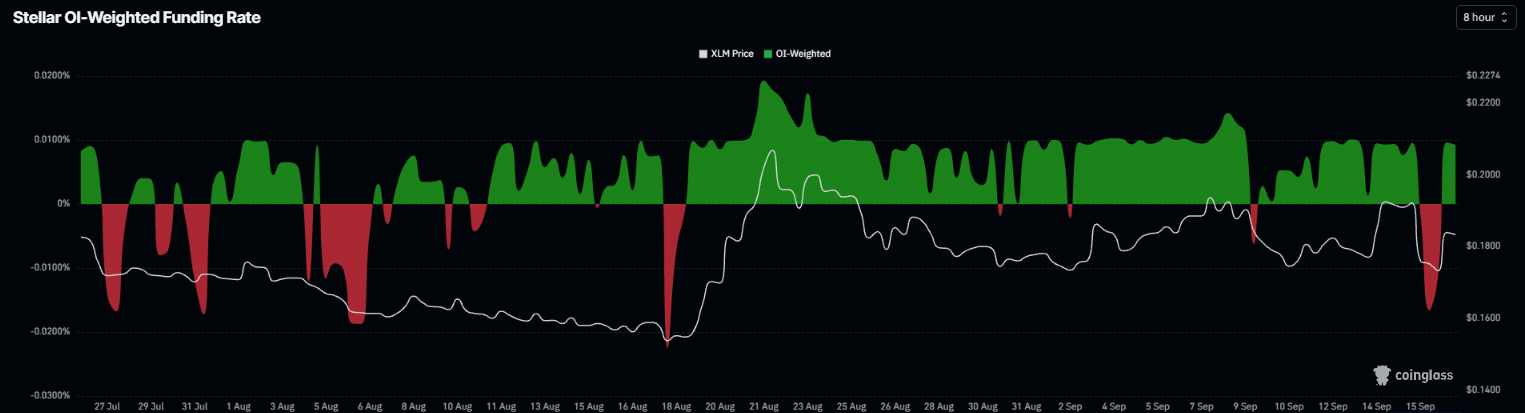
Meanwhile, the XLM funding rate flipped positive on Wednesday, reading 0.0093% on Thursday. This indicates longs are paying shorts, reflecting a bullish outlook for Stellar.
On-chain data shows slight bearish tilt
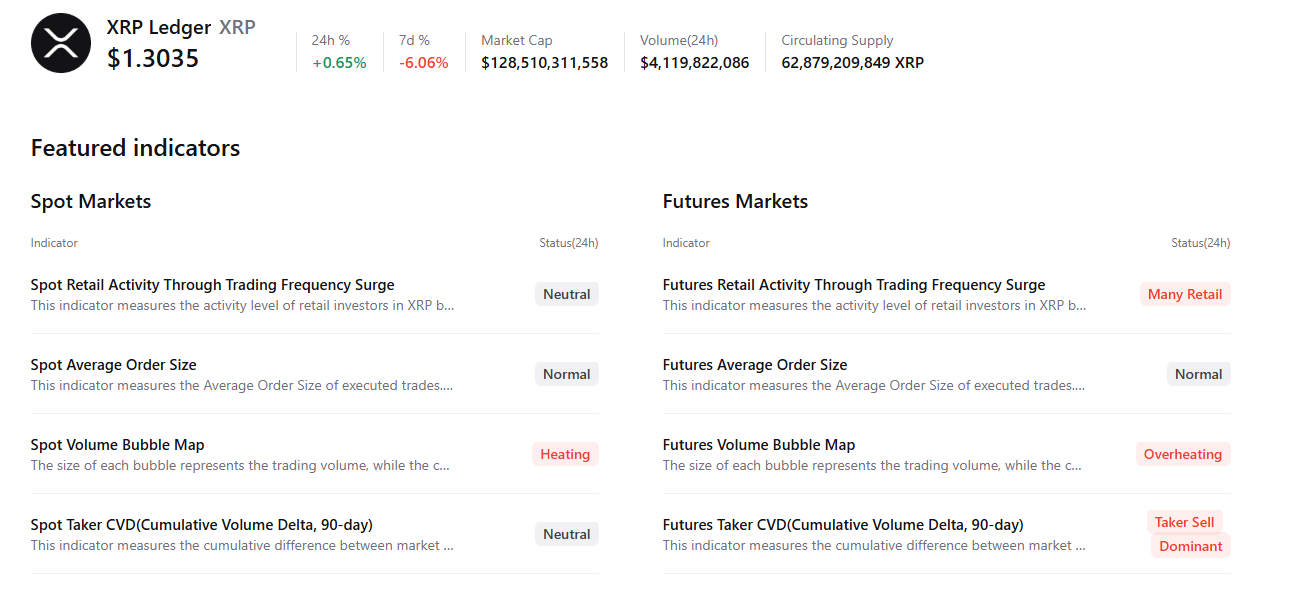
CryptoQuant’s summary data shows cautious signs for both altcoins. XRP’s spot and futures markets show overheating conditions, while the futures market shows sell-side dominance, and retail traders are active. These highlight a bearish, cautious sentiment bias among Ripple traders.
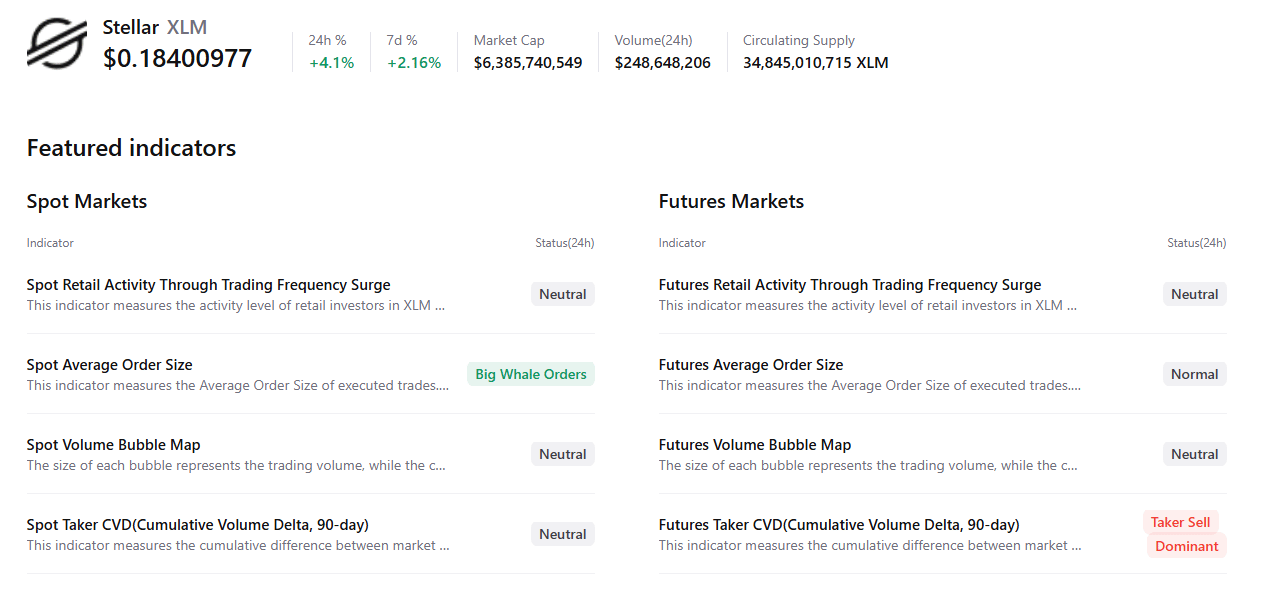
For XLM, spot shows large whale orders; however, the futures market also shows sell-side dominance, indicating a negative outlook among Stellar traders.
XRP technical outlook: Key support holds
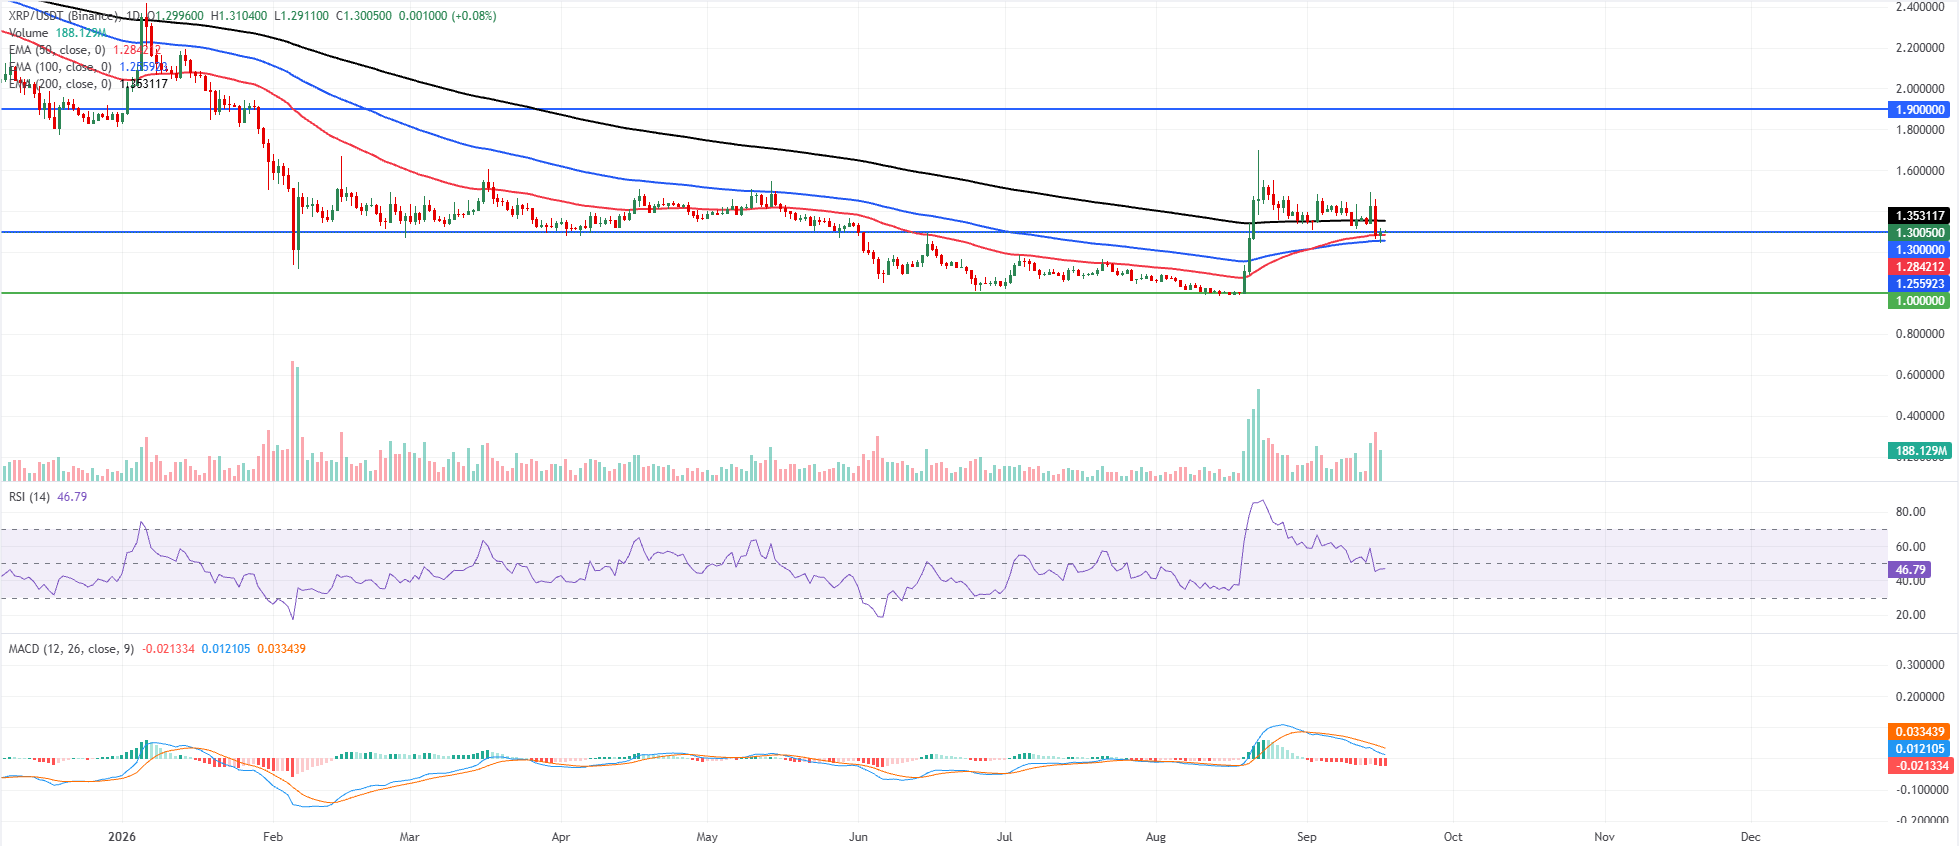
XRP price trades at $1.300 on Thursday, holding a neutral, range-bound stance as it sits between clustered moving averages and higher trend resistance. XRP is marginally above the 50-day and 100-day Exponential Moving Averages (EMAs) at $1.284 and $1.255, which together suggest underlying demand in the $1.250–$1.280 area, but it remains capped by the 200-day EMA at $1.353 overhead.
Momentum has cooled, with the Relative Strength Index (RSI) slipping toward a neutral 46 and the Moving Average Convergence Divergence (MACD) below zero, hinting at waning bullish pressure and favoring consolidation rather than a sustained directional move as price oscillates around the $1.300 handle.
On the downside, initial support is clustered just under the market at $1.300, backed by the 50-day EMA at $1.284 and the 100-day EMA at $1.255, which together define a broader demand band that would need to give way to expose the next major floor near $1.000.
On the topside, immediate resistance is located at the 200-day EMA at $1.353; a daily close above this barrier would open the path toward the distant horizontal resistance near $1.900, while failure to clear $1.353 keeps XRP trapped in its current range and leaves the $1.300 area vulnerable to a corrective pullback.
XLM technical outlook: Finds support around key zone
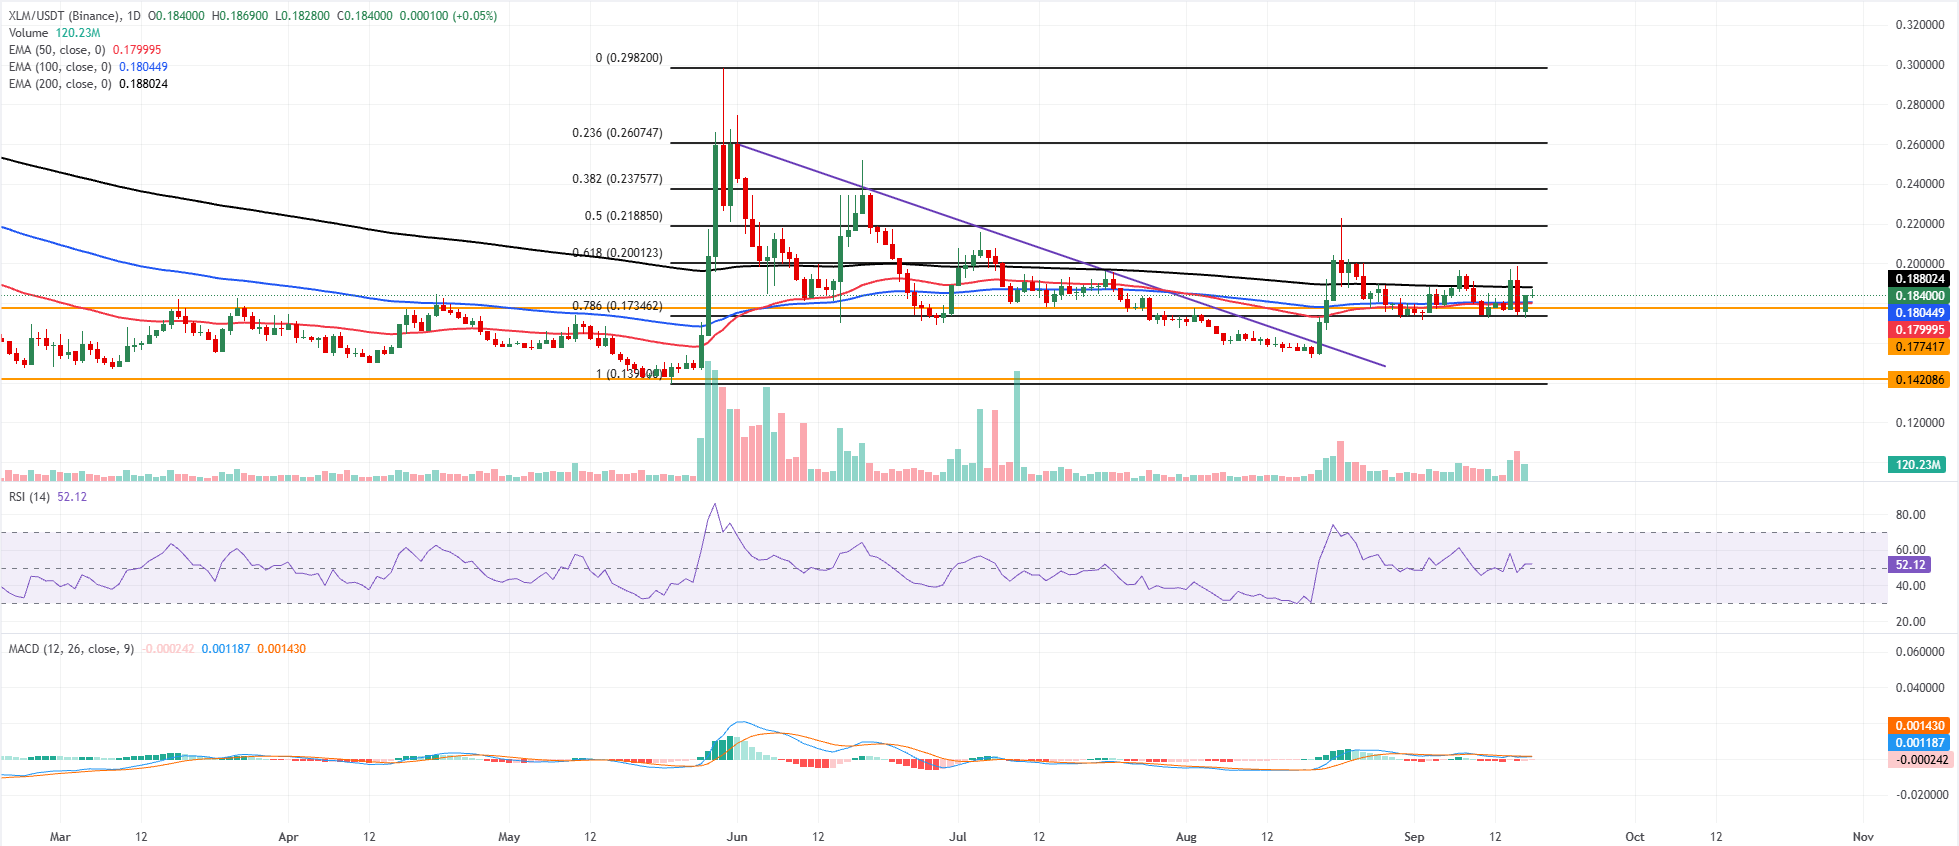
XLM price trades at $0.184 on Thursday, holding above the 50-day and 100-day EMAs clustered near $0.180, which lends a tentative constructive tone, but the pair remains capped by the 200-day EMA at roughly $0.188.
The RSI around 52 suggests neutral-to-mildly bullish momentum, while the MACD indicator sits marginally negative, hinting at waning upside as price consolidates just below the longer-term trend barrier.
On the topside, initial resistance is located at the 200-day EMA near $0.188, ahead of a more significant hurdle at the 61.8% Fibonacci retracement of the latest swing at $0.200; a daily close above these levels would open the way toward the 50% retracement at $0.218 and the higher Fibonacci cluster between $0.237 and $0.260.
On the downside, immediate support emerges at the horizontal level around $0.177, reinforced by the 78.6% Fibonacci retracement at $0.173, while a deeper pullback would expose the next structural floor near $0.142.
(The technical analysis of this story was written with the help of an AI tool. Know more.)
Artigos Recomendados


