


Ethereum Price Forecast: ETH shows bottom signs but relative performance against Bitcoin not there yet
Ethereum price today: $1,860
- Ethereum's decline to a yearly low against Bitcoin has sparked calls of an ETH bottom, which eventually expands into an altcoin season.
- However, ETH/BTC valuation metrics have yet to reach extreme levels that historically align with an ETH bottom.
- ETH risks a decline to $1,800 if it fails to bounce off the 20- and 50-day EMAs.
Ethereum (ETH) is showing early signs of a market bottom relative to Bitcoin (BTC), but has to confirm several other key bottoming signals before an outperformance can be expected, according to CryptoQuant.
In a report released late Thursday, the analyst at the on-chain analytics firm noted that Ethereum has underperformed Bitcoin for nearly a year, evidenced by the ETH/BTC ratio declining to 0.028, marking its lowest level since last August.
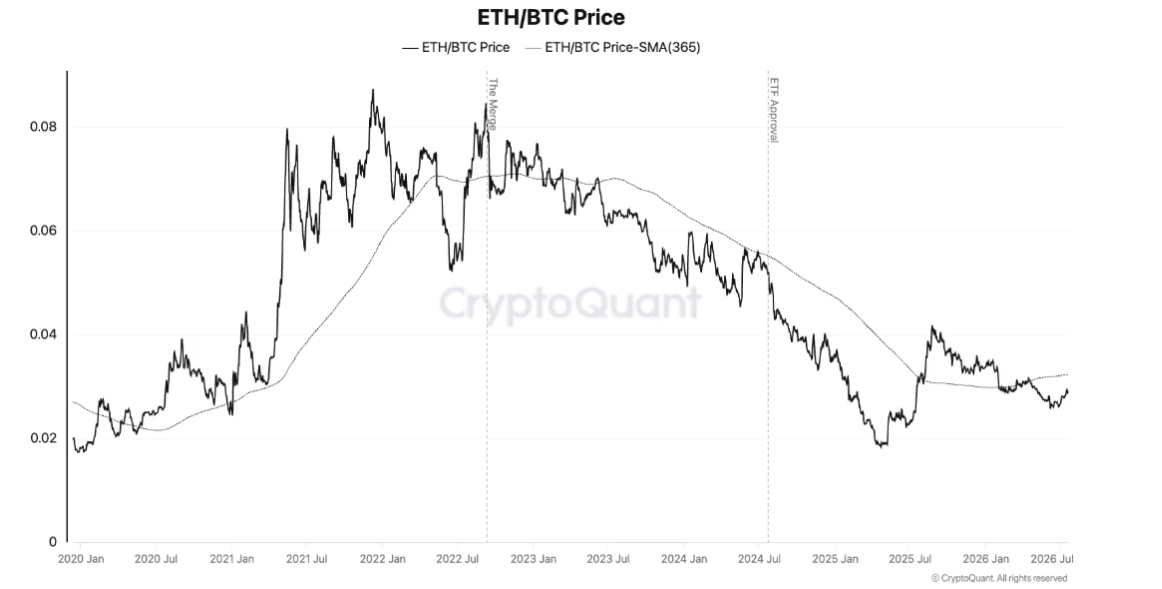
Such conditions usually spike sentiment around a potential ETH bottom, which eventually expands into an altcoin season.
"The question for investors is whether ETH is now cheap enough to mark a durable bottom - the precondition for ETH outperformance and, historically, for a broader altcoin season," the analysts wrote.
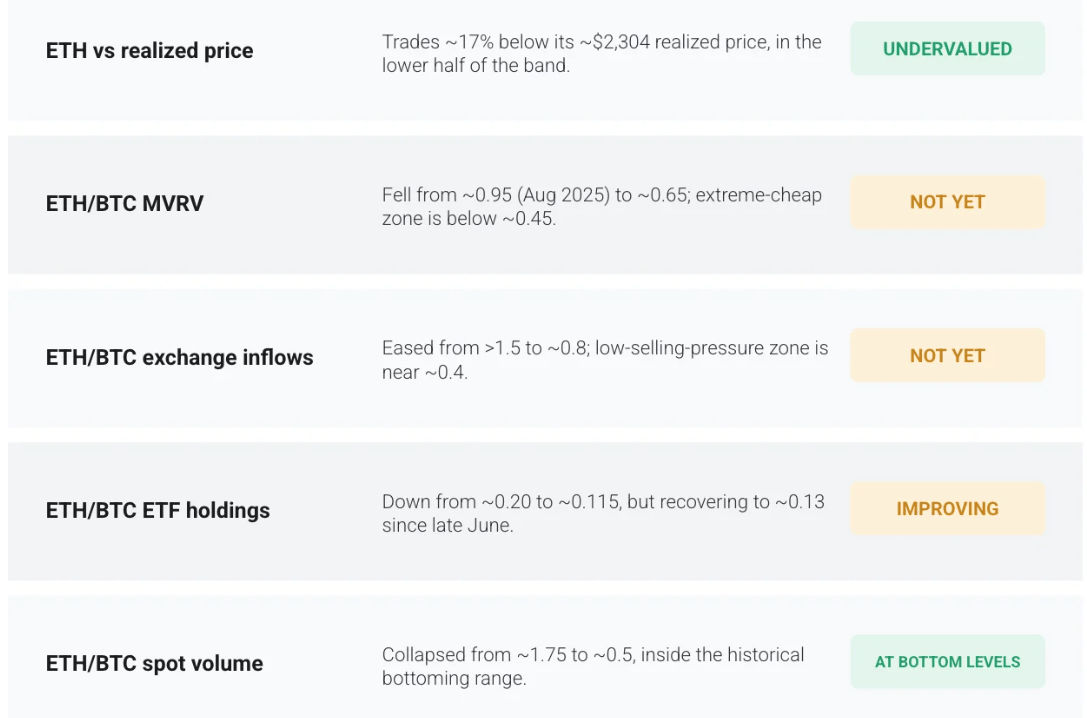
The report argued that Ethereum is closer to a market bottom with less downside risk compared to upside, as it is trading near $1,900, roughly 17% below the realized price or average on-chain cost basis of all ETH tokens, which is at $2,304. The move toward $1,900 came after ETH fell from an all-time high of $4,946 last year to a low of $1,400 in June.
"On a standalone basis, Ethereum is already cheap. Trading below the aggregate cost basis means the marginal holder is sitting on losses, which historically exhausts sellers and compresses downside," CryptoQuant stated.
However, the analysts argued that bottom signals have not fully emerged for ETH when compared to Bitcoin using other key on-chain data.
ETH/BTC metrics yet to reach extreme levels
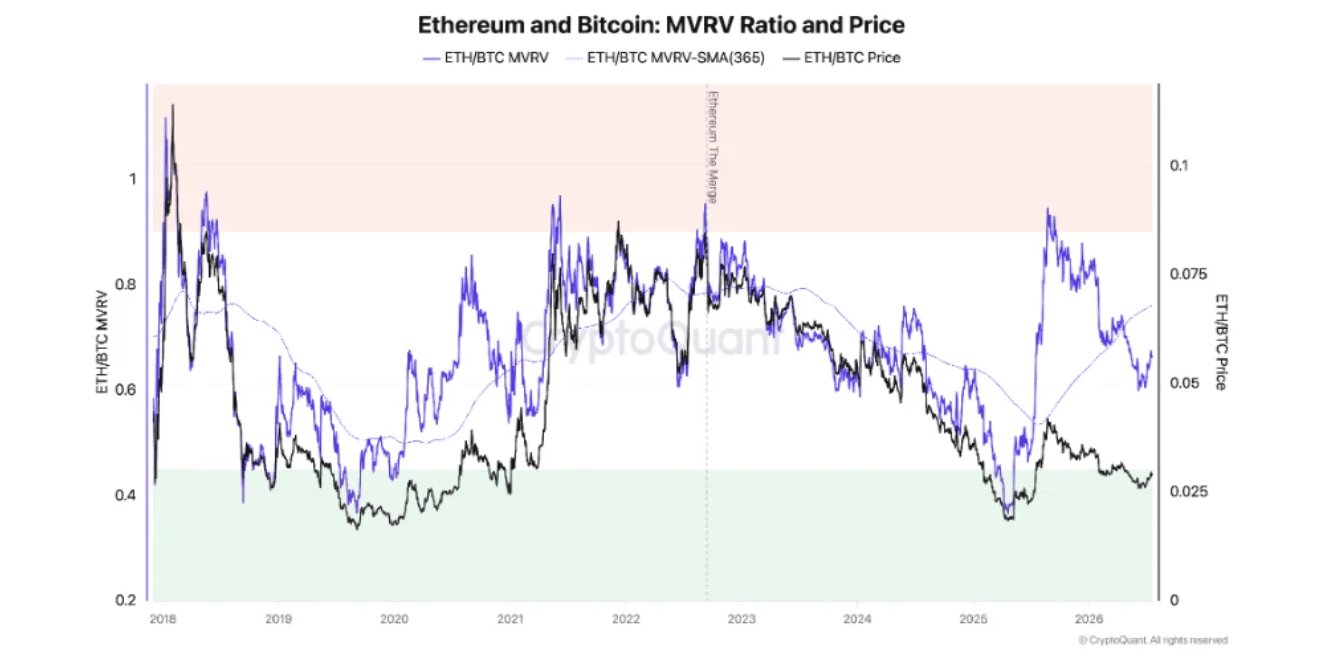
The report highlights that the ETH/BTC Market Value to Realized Value (MVRV) has declined from 0.95 last August to near 0.65, indicating a shift from overvaluation to neutral levels. ETH forms a "durable bottom" when the metric drops below 0.45, as seen in 2019-20 and early 2025, CryptoQuant noted.
A similar trend is evident in the ETH/BTC exchange inflow, which has eased to 0.8 after peaking above 1.5 in August, indicating a drop in the amount of ETH versus Bitcoin sent to exchanges. Bottoms have often formed when the metric drops toward 0.4, the analysts argued.
Additionally, the ETH/BTC exchange-traded fund (ETF) holdings show institutional allocators have been shifting back toward Ethereum since late June after months of underperformance. The metric saw a modest recovery to 0.13 in July, after dropping from a peak of 0.205 in August/September 2025 to 0.115 in June.
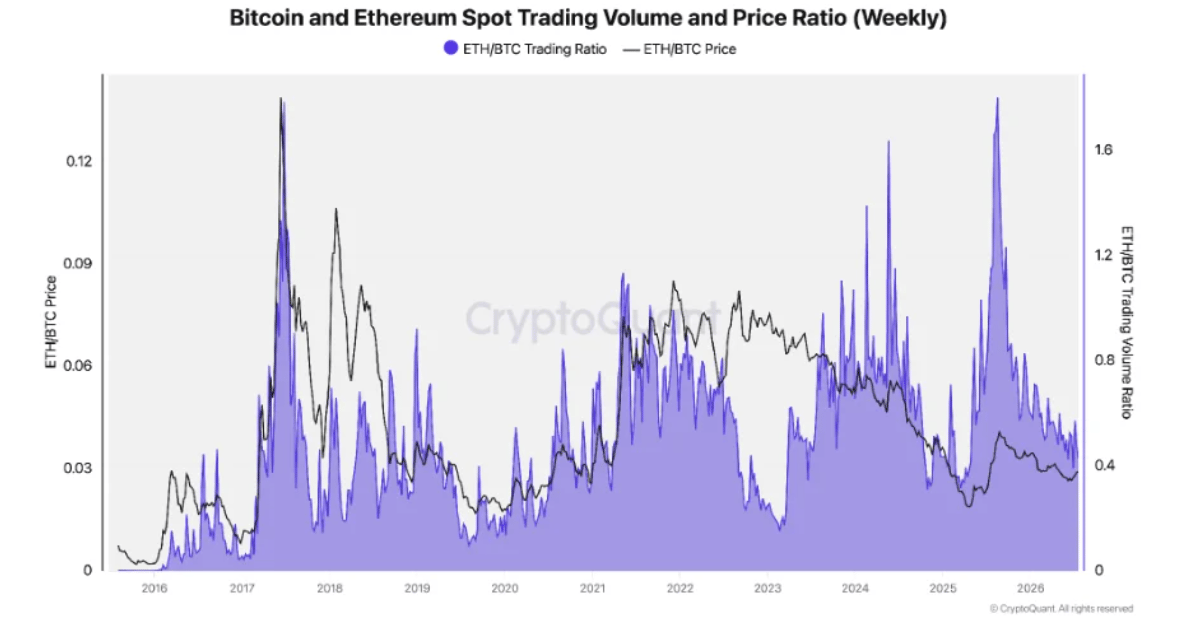
While these metrics have yet to validate a bottom, the ETH/BTC relative spot trading volume is an outlier. The metric has dropped sharply from 1.75 in August to around 0.5, a level that has historically coincided with ETH's price bottoms.
"[ETH] is already cheap against its own cost basis, relative selling pressure has halved. ETF demand has begun to turn and trading activity sits at levels that marked prior bottoms. But MVRV and exchange inflows are not yet at the extremes that have historically confirmed a floor - so a final bottom, and the ETH outperformance that would follow, may still take more time to form," CryptoQuant analysts concluded.
Earlier in the week, FXStreet reported that ETH's recent recovery comes after it triggered the MVRV Buy Signal, which has also historically aligned with price bottoms for the top altcoin.
Ethereum Price Forecast: ETH risks further decline if it drops below the 20- and 50-day EMAs
Ethereum has recorded $67.79 million in liquidations over the past 24 hours, led by $44.18 million in long liquidations.
On the daily chart, ETH risks returning to a bearish structure as it is testing the 20- and 50-day Exponential Moving Averages (EMAs) at $1,839 and $1,831, respectively. Momentum gauges hint at declining buying pressure with the 14-day Relative Strength Index (RSI) and Stochastic Oscillator (Stoch) easing to 54 and 53, respectively.
On the upside, initial resistance is seen at the horizontal barrier around $1,909, ahead of the 100-day EMA at $1,936 and the $2,019 zone, where prior supply has emerged. Further north, additional caps are located at $2,108 and $2,211, with more distant resistance clustered near $2,389 and $2,746.
On the downside, immediate support is provided by the 20- and 50-day EMAs, followed by the recent structural floor near $1,806. A break below there would expose the next key supports around $1,741 and then $1,524.
(The technical analysis of this story was written with the help of an AI tool. Know more.)
Artigos Recomendados


