


Ripple Price Forecast: XRP stages relief rally following market sell-off
- XRP knee-jerk rally accelerates, pushing price action above $1.36.
- Modest ETF inflows signal renewed optimism despite declining retail interest.
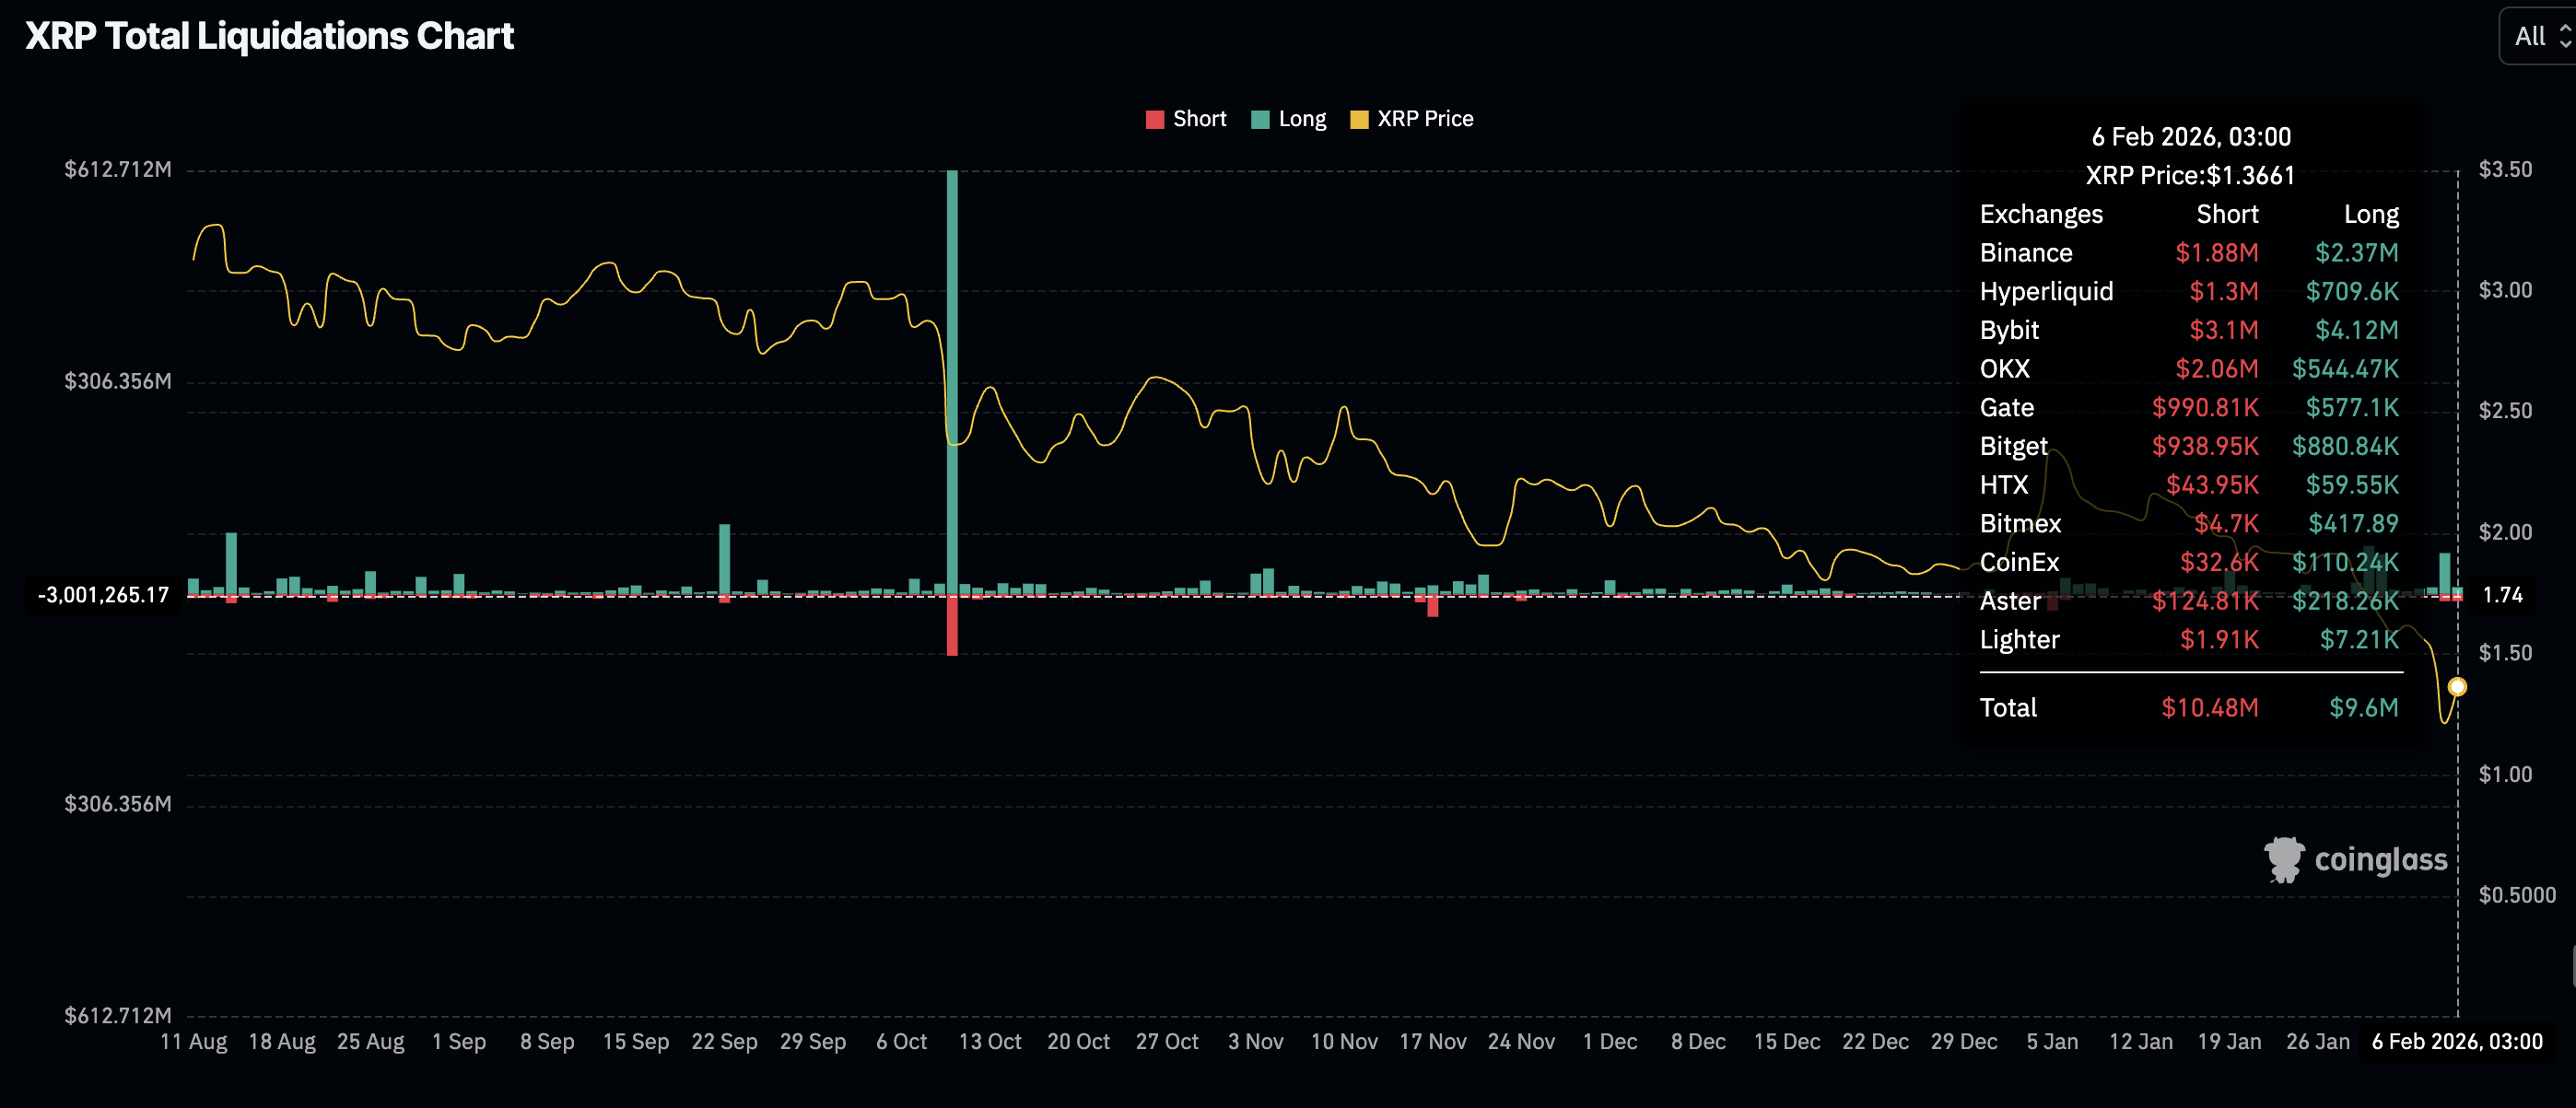
- Liquidation of leveraged XRP positions balances amid the recovery, with traders incurring $20 million in losses on Friday.
Ripple (XRP) is accelerating its recovery, trading above $1.36 at the time of writing on Friday, as investors adjust their positions following a turbulent week in the broader crypto market. The remittance token is up over 21% from its intraday low of $1.12.
Mild ETF inflows support XRP recovery
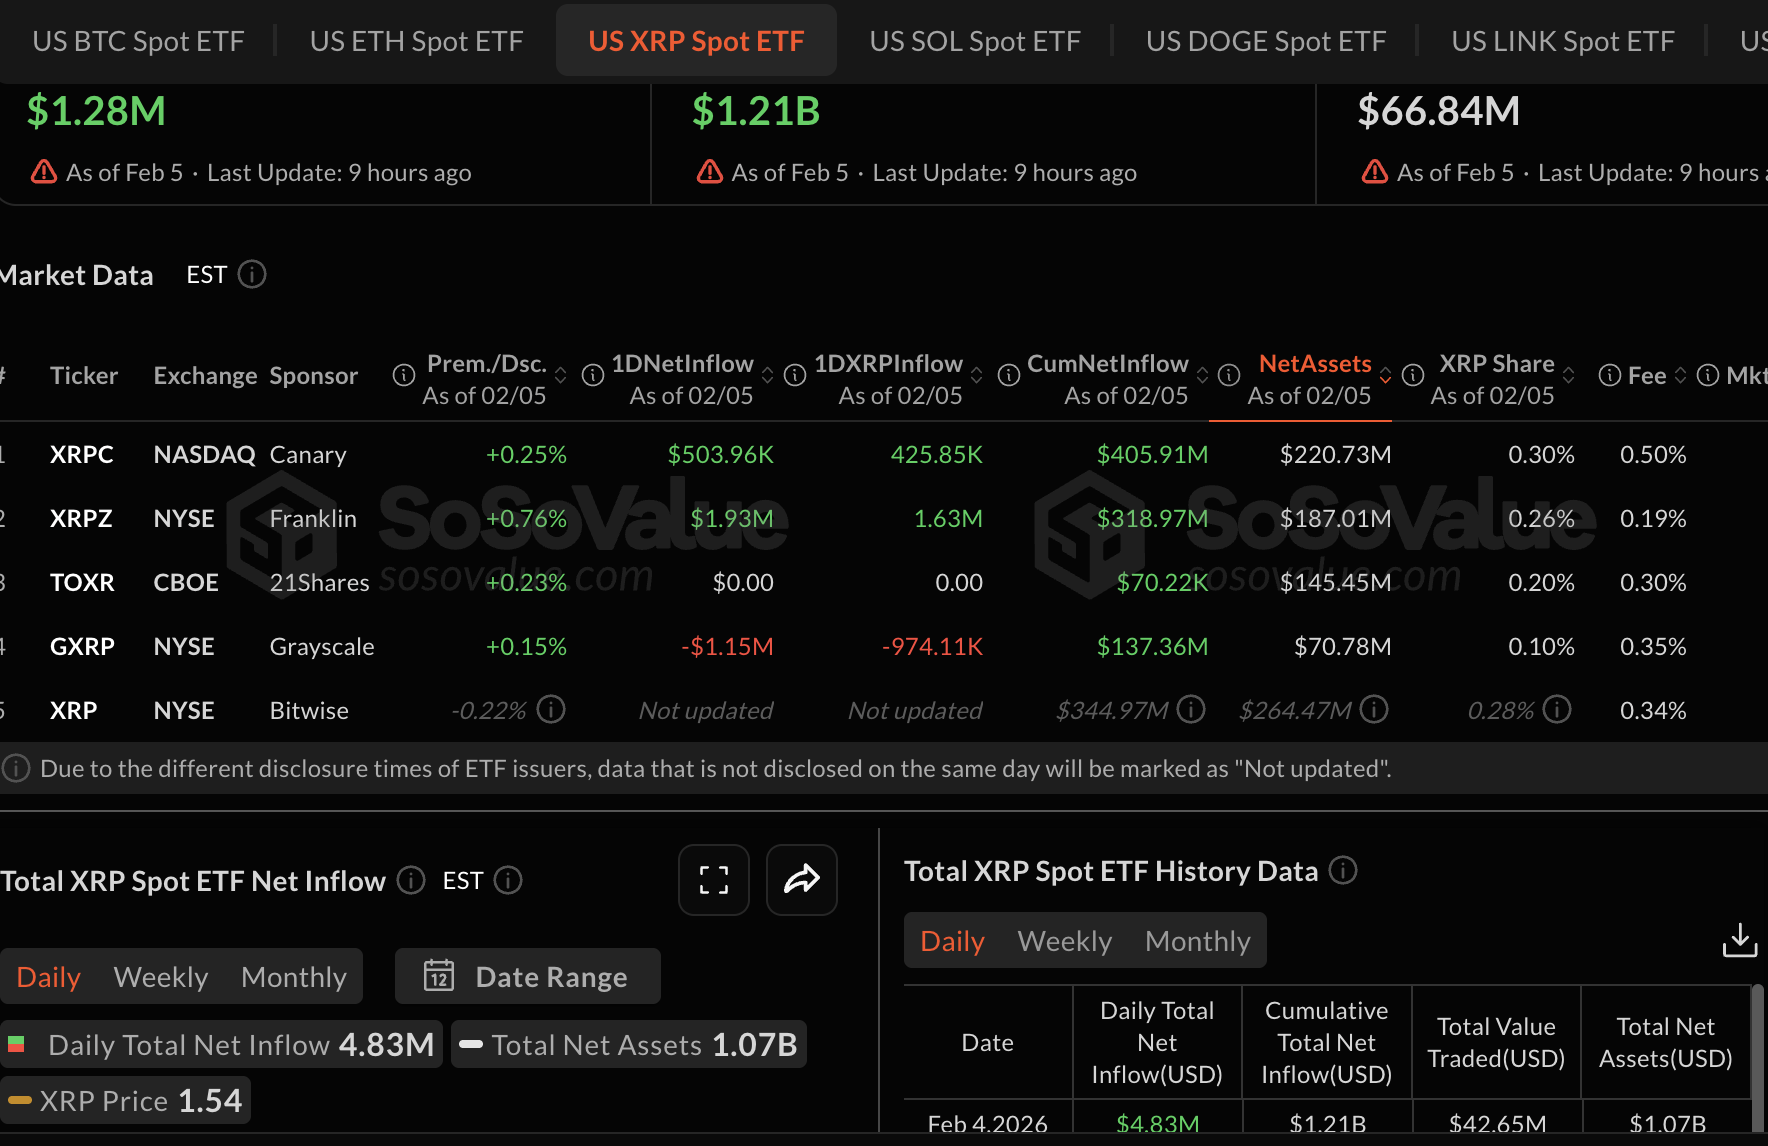
Institutional investors continued accumulating XRP spot Exchange-Traded Funds (ETFs), with $1.28 million in inflows on Thursday despite ongoing price volatility.
According to SoSoValue data, US-listed XRP ETFs recorded three consecutive days of net inflows, following approximately $19.5 million on Tuesday and $4.8 million on Wednesday.
The cumulative inflows stand at $1.21 billion, and net assets under management at approximately $888 million. Sustained ETF inflows typically reflect positive investor sentiment and can often correlate with bullish momentum in the underlying asset.
Meanwhile, the XRP derivatives market extends its weakness, with futures Open Interest (OI) declining to $2.40 billion on Friday, the lowest level since early January 2025, from $2.61 billion on Thursday.
OI tracks the notional value of outstanding futures contracts, which gauges retail interest. A persistent decline suggests low conviction in the asset’s ability to sustain a steady price increase.
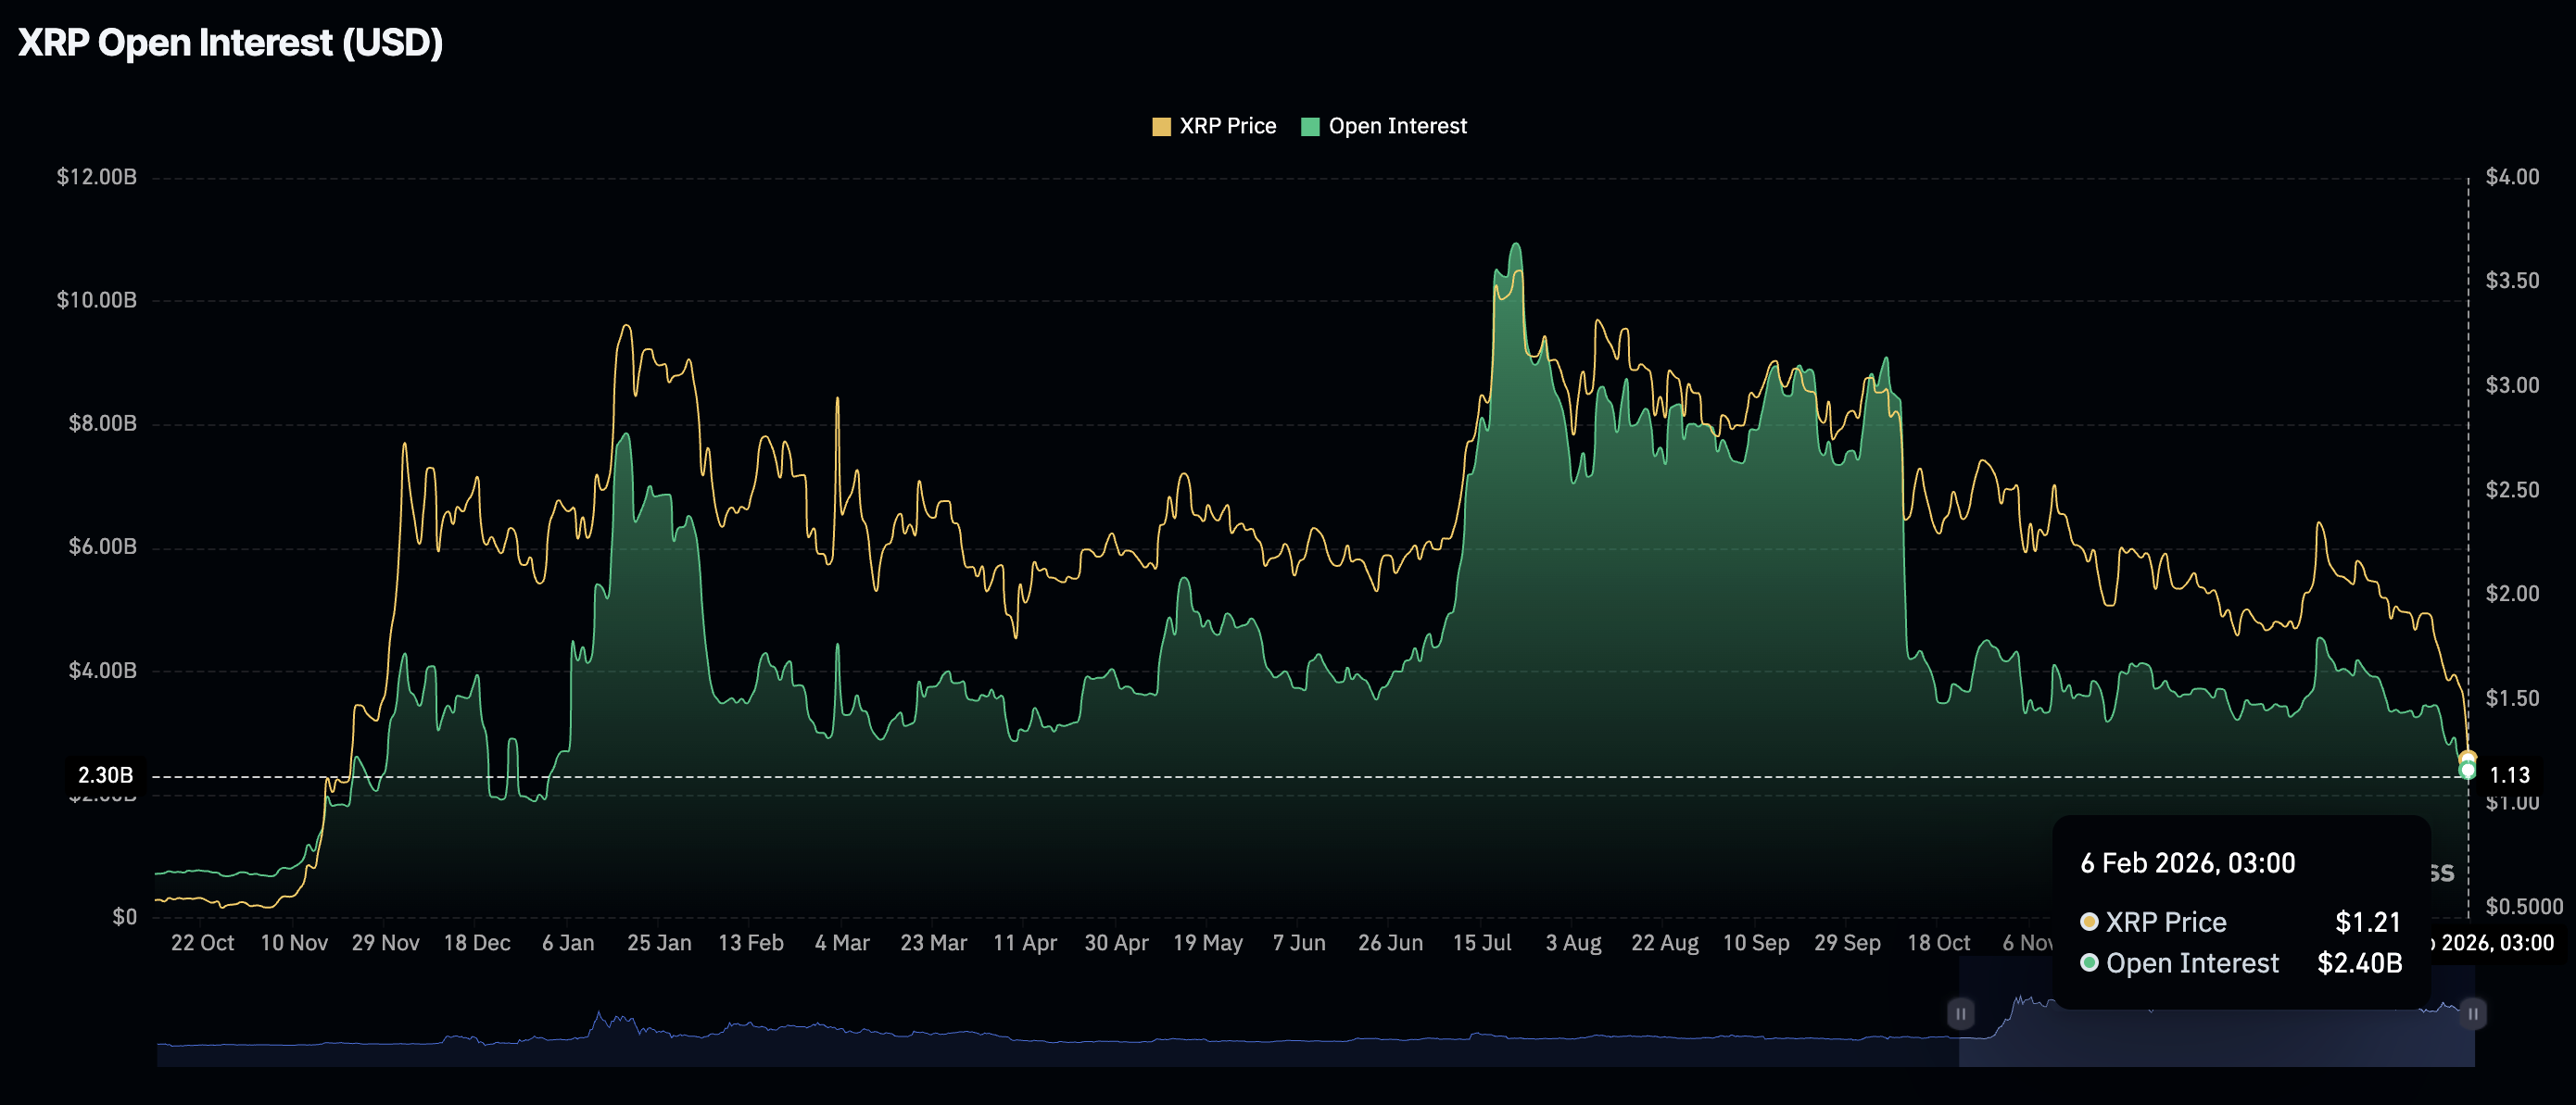
XRP’s ongoing recovery lacks the support of the retail market, while institutional interest remains low. Therefore, traders should closely monitor OI trends to maintain an optimistic stance amid volatility. Meanwhile, pressure from liquidated positions has eased, given the ongoing price recovery. According to CoinGlass, approximately $10 million in longs and $10.5 million in shorts have been liquidated on Friday, compared to $59 million in longs and $11 million in shorts on Thursday. As the XRP price rises, pressure on long positions is poised to ease, potentially supporting the recovery.
Technical outlook: XRP edges higher as bulls return
XRP has extended its price action above $1.36, but remains below the 50-day Exponential Moving Average (EMA), at $1.88, the 100-day EMA at $2.05 and the 200-day EMA at $2.22. All three moving averages slope lower, reinforcing the overall bearish structure, while the descending trend line from $3.66 limits advances with resistance at $2.18.
The Moving Average Convergence Divergence (MACD) is in negative territory on thedaily chart, with its line below the signal line and a contracting negative histogram suggesting that bearish momentum is gradually easing. Meanwhile, the Relative Strength Index (RSI) at 29 on the same chart is still oversold despite the intraday increase. Any bounce in the RSI could face supply against nearby dynamic resistances.
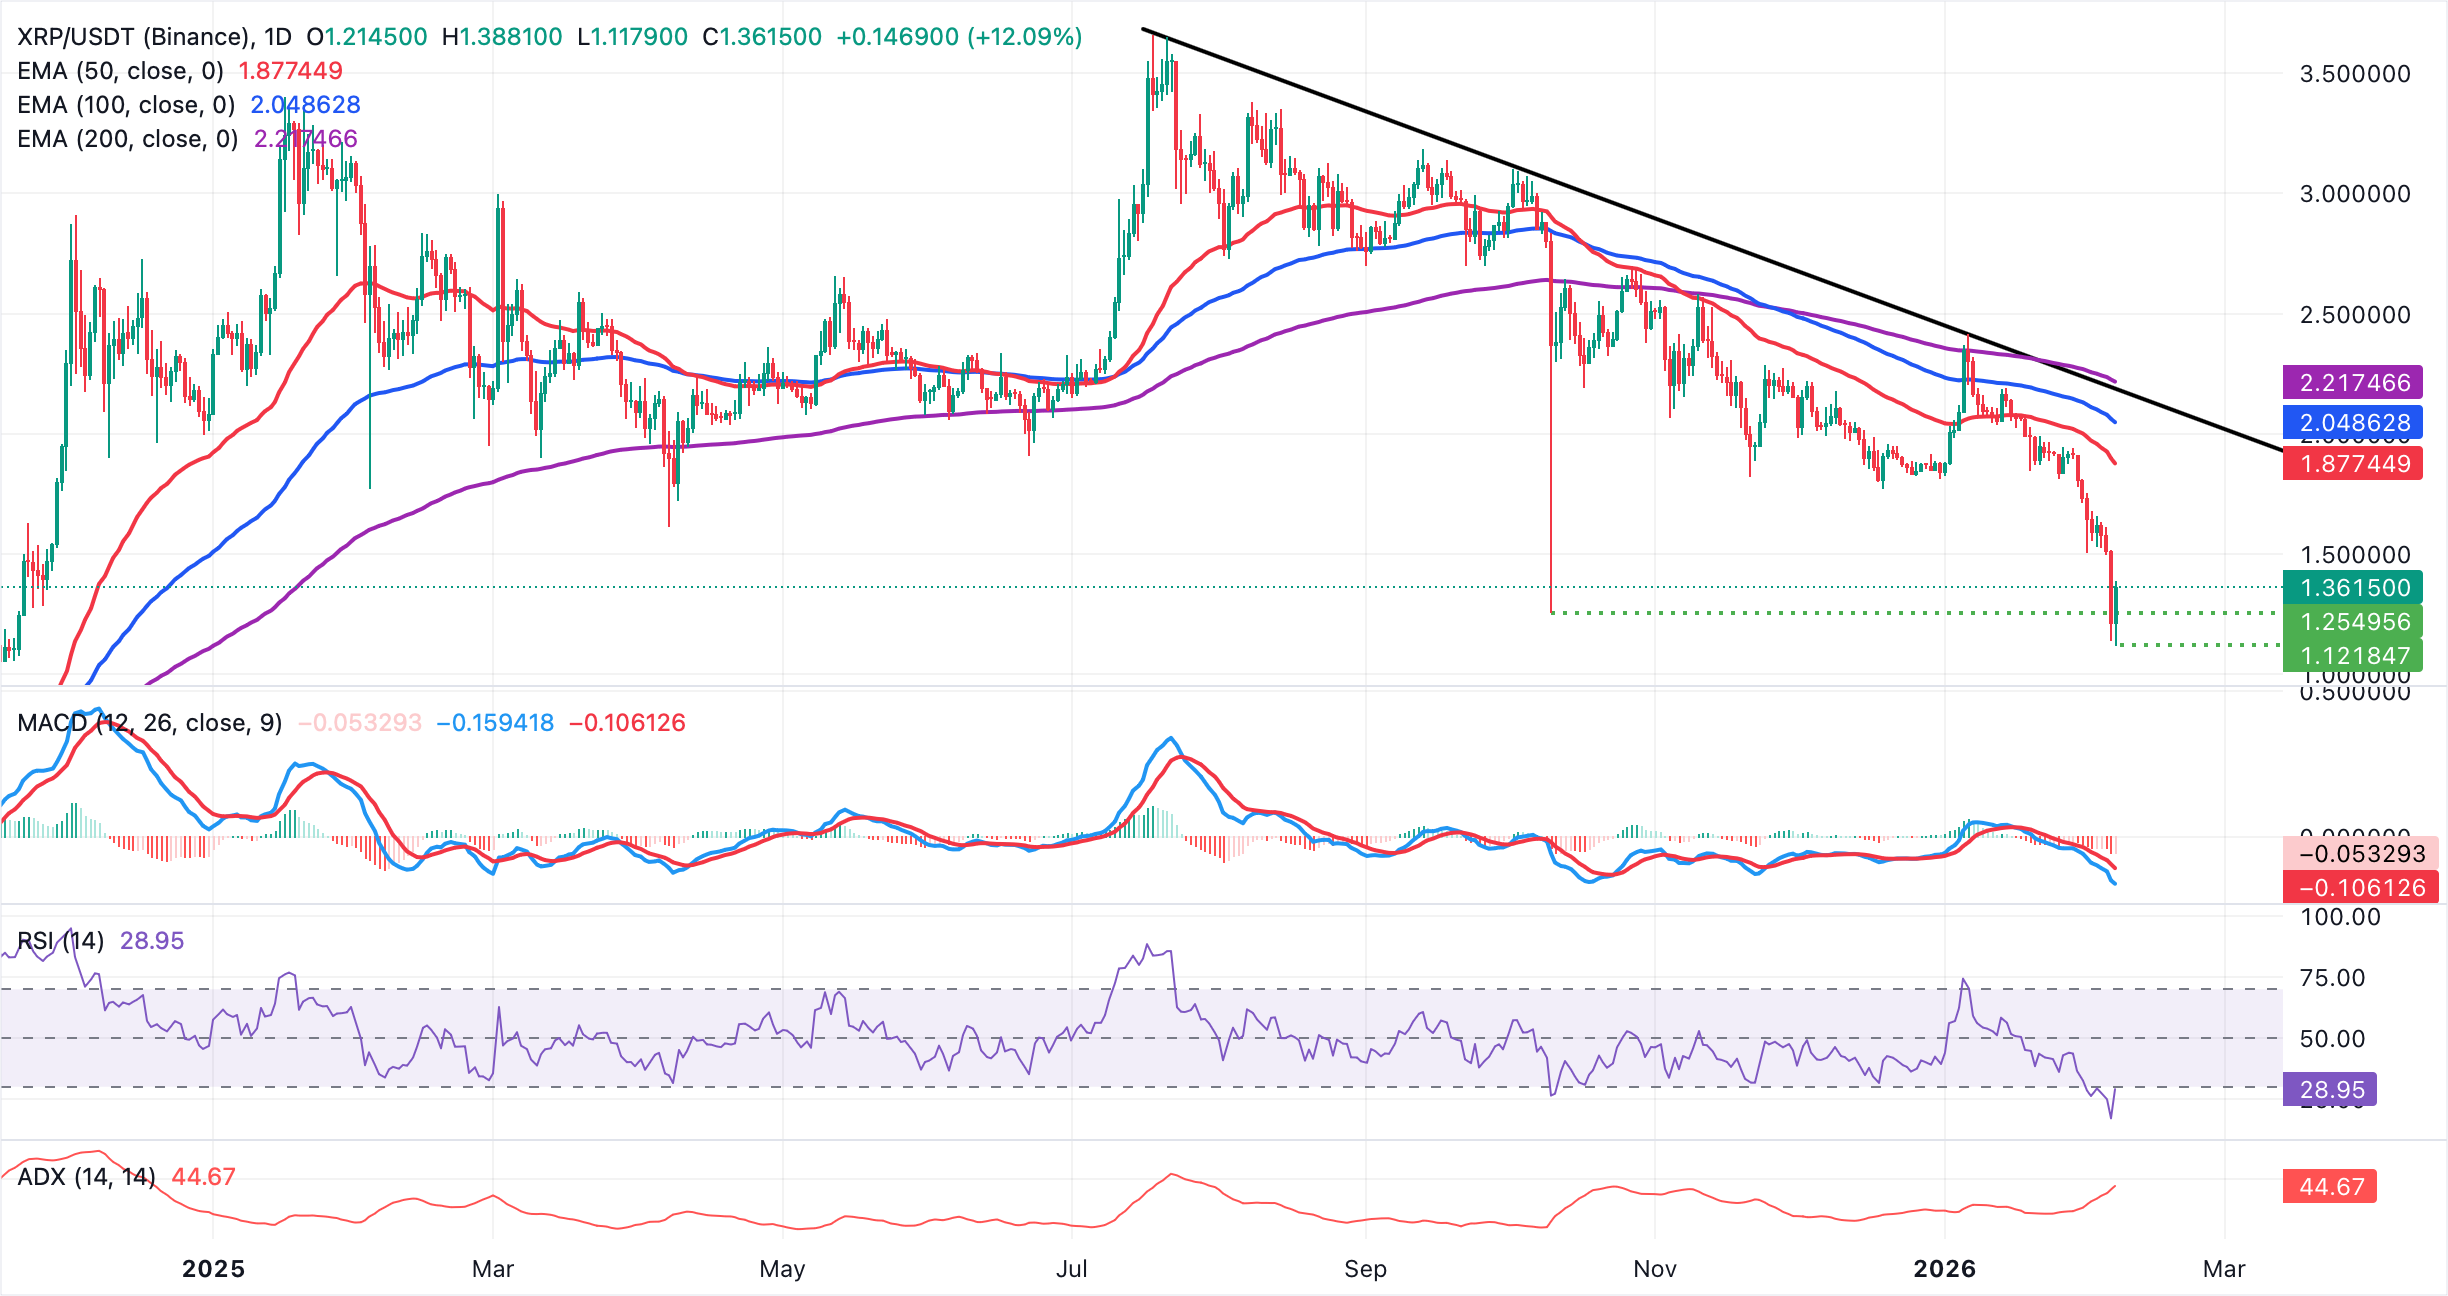
A close above the threshold at $1.40 may accelerate the uptrend beyond the next hurdle at $1.50. However, the overall downtrend, as portrayed by the moving averages, could push XRP to retest its intraday low at $1.12.
Open Interest, funding rate FAQs
Higher Open Interest is associated with higher liquidity and new capital inflow to the market. This is considered the equivalent of increase in efficiency and the ongoing trend continues. When Open Interest decreases, it is considered a sign of liquidation in the market, investors are leaving and the overall demand for an asset is on a decline, fueling a bearish sentiment among investors.
Funding fees bridge the difference between spot prices and prices of futures contracts of an asset by increasing liquidation risks faced by traders. A consistently high and positive funding rate implies there is a bullish sentiment among market participants and there is an expectation of a price hike. A consistently negative funding rate for an asset implies a bearish sentiment, indicating that traders expect the cryptocurrency’s price to fall and a bearish trend reversal is likely to occur.
(The technical analysis of this story was written with the help of an AI tool.)
Artigos Recomendados


