


Pi Network Price Forecast: PI struggles to surpass key resistance as large investor exits
- Pi Network holds above $0.20 but struggles to surpass the 50-period EMA on the 4-hour chart.
- A large wallet investor offloaded over 1 million PI tokens in the last 24 hours, suggesting reduced confidence among investors.
- The technical outlook remains mixed, as PI struggles to clear a dynamic resistance level.
Pi Network (PI) holds steady above the $0.2000 psychological level after breaking out above a descending channel pattern on the 4-hour chart. However, the investors' confidence continues to decline as PiScan data reveals a large wallet investor, commonly referred to as a whale, deposited over 1 million on an exchange. The technical outlook for PI remains mixed as PI struggles to extend its recovery.
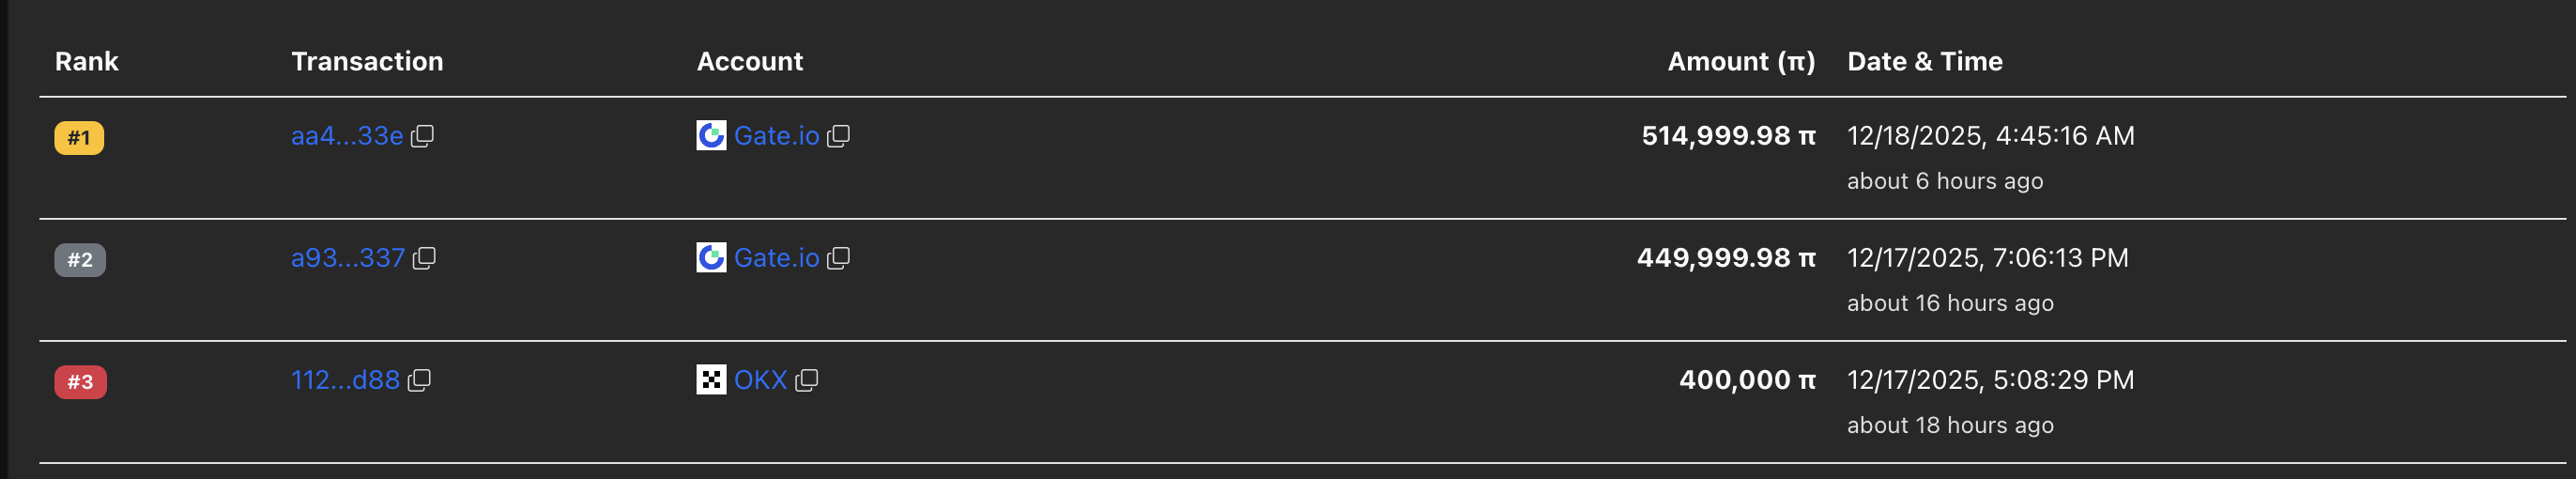
Whale offloads over 1 million PI tokens
PiScan data shows a whale deposited over 1 million PI tokens on Gate.io exchange in two transactions over the last 24 hours. Typically, such large deposits on exchanges add to selling pressure and reflect a lack of investor confidence. Still, the investor is left with 7.9 million PI tokens, which could indicate a strategic sell-off to reduce risk.
Pi Network’s recovery stalls near the 50-period EMA
Pi Network struggles to clear the 50-period Exponential Moving Average (EMA) on the 4-hour chart at $0.2065 after surpassing a resistance trendline connecting the November 30 and December 6 highs. Additionally, the Supertrend indicator line is near the 50-period EMA, and a close above the moving average would confirm a bullish trend and trigger a buy signal.
If PI secures a close above $0.2065, it could extend the uptrend to the resistance zone between the R1 Pivot Point at $0.2179 and the 200-period EMA at $0.2221.
The technical indicators on the 4-hour chart indicate that the selling pressure has significantly reduced. The Relative Strength Index (RSI) at 50 fluctuates above the halfway line while the Moving Average Convergence Divergence (MACD) indicator steadies an upward trend toward the zero line.
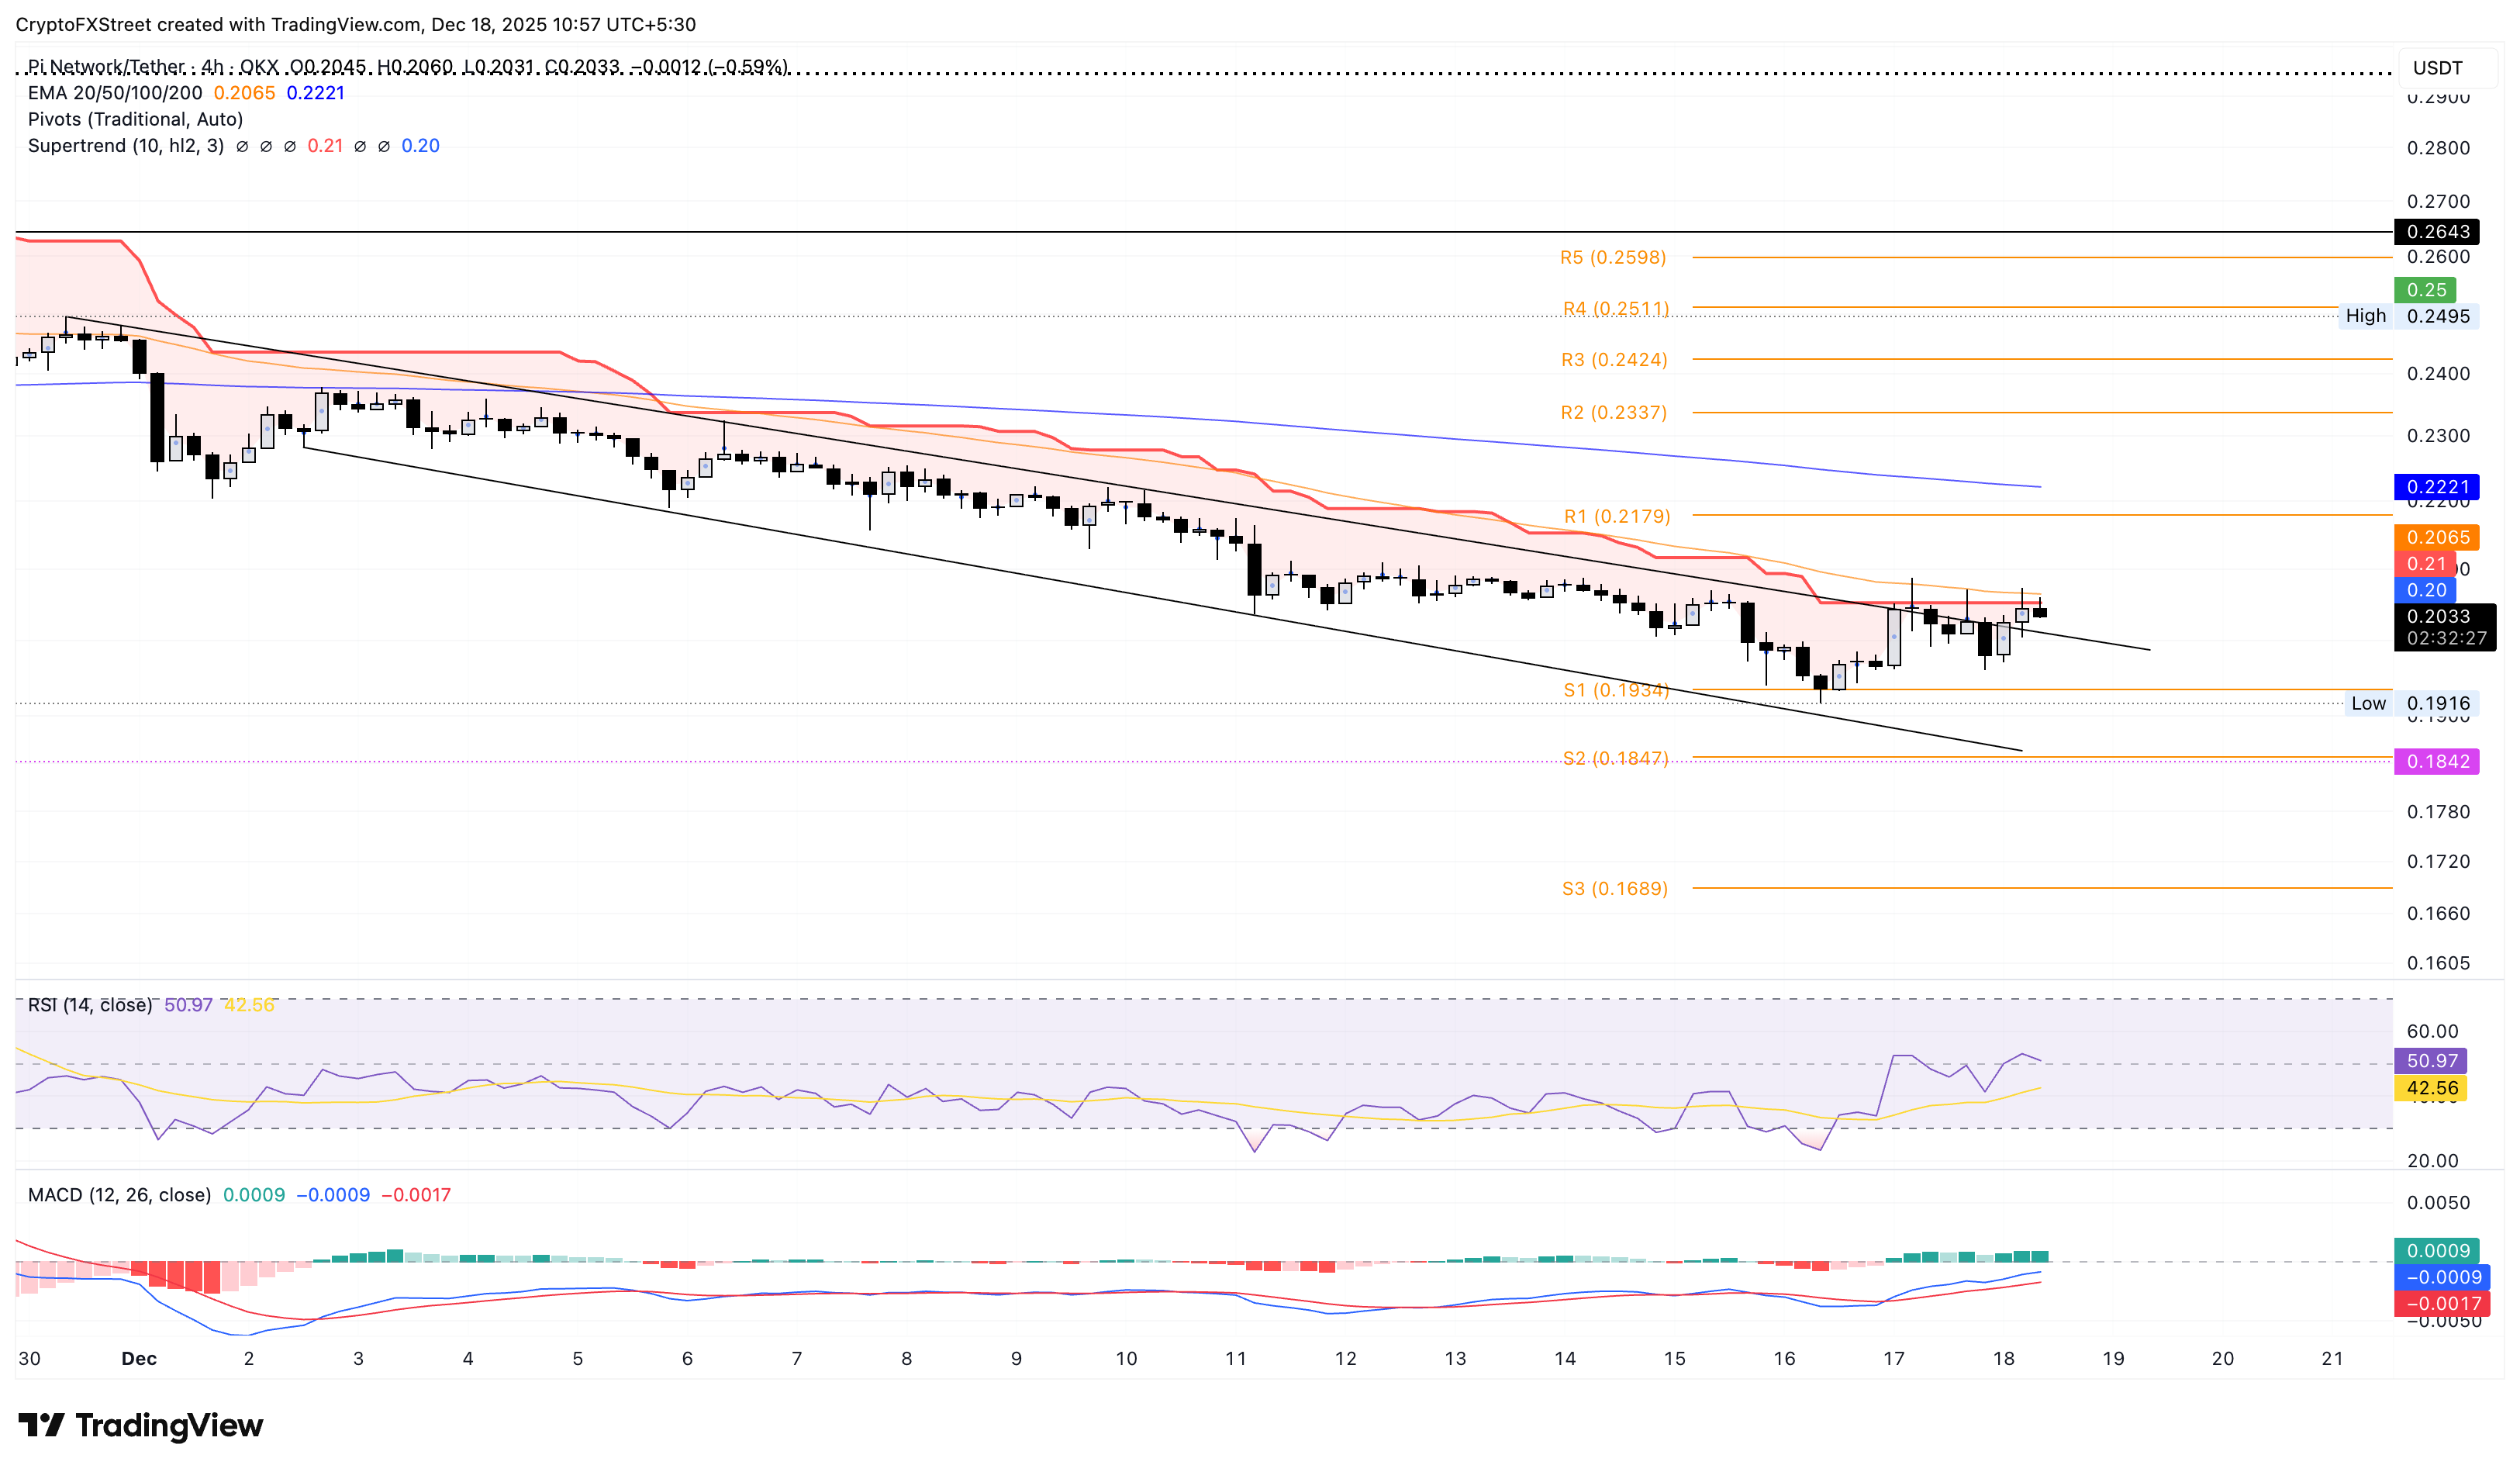
Looking down, if PI reverses below $0.2000, it could retest the S1 Pivot Point at $0.1934, followed by the S2 Pivot Point at $0.1847.
Artigos Recomendados


