


Crypto Today: Bitcoin, Ethereum, XRP shake out weak hands amid volatility spike
- Bitcoin resumes sell-off, breaking two consecutive days of recovery in the wake of last week’s flash crash.
- Ethereum declines below the $4,000 level, testing the 100-day EMA support.
- Headwinds suppress the chances of XRP recovery despite stability in the derivatives market.
Bitcoin (BTC) faces increasing volatility, falling below $112,000 on Tuesday. Altcoins, including Ethereum (ETH) and Ripple (XRP), are extending losses alongside BTC, with ETH trading around the $4,000 level and XRP below the $2.50 short-term resistance.
Interest in cryptocurrencies remains largely subdued as traders lick their wounds following last week’s capitulation event. The United States (US) government shutdown, growing macroeconomic tensions between the US and China, and the overall uncertainty about the performance of cryptocurrencies in the fourth quarter are some of the factors contributing to the headwinds.
Data spotlight: Bitcoin, Ethereum slide as institutional demand shrinks
Demand for Bitcoin spot Exchange Traded Funds (ETFs) has taken a hit over the last few days, reflecting negative market sentiment. According to SoSoValue data, BTC ETFs in the US experienced net outflows of $327 million on Monday and $4.5 million on Friday, building on last week’s bearish structure.

Bitcoin spot ETF stats | Source: SoSoValue
Institutions are also shunning Ethereum ETFs, which experienced net outflows of $429 million on Monday, $175 million on Friday and approximately $9 million on Thursday.
If risk exposure dwindles further, it would be difficult for bulls to sustain recovery as institutions tend to shape sentiment, especially for Ethereum and Bitcoin.
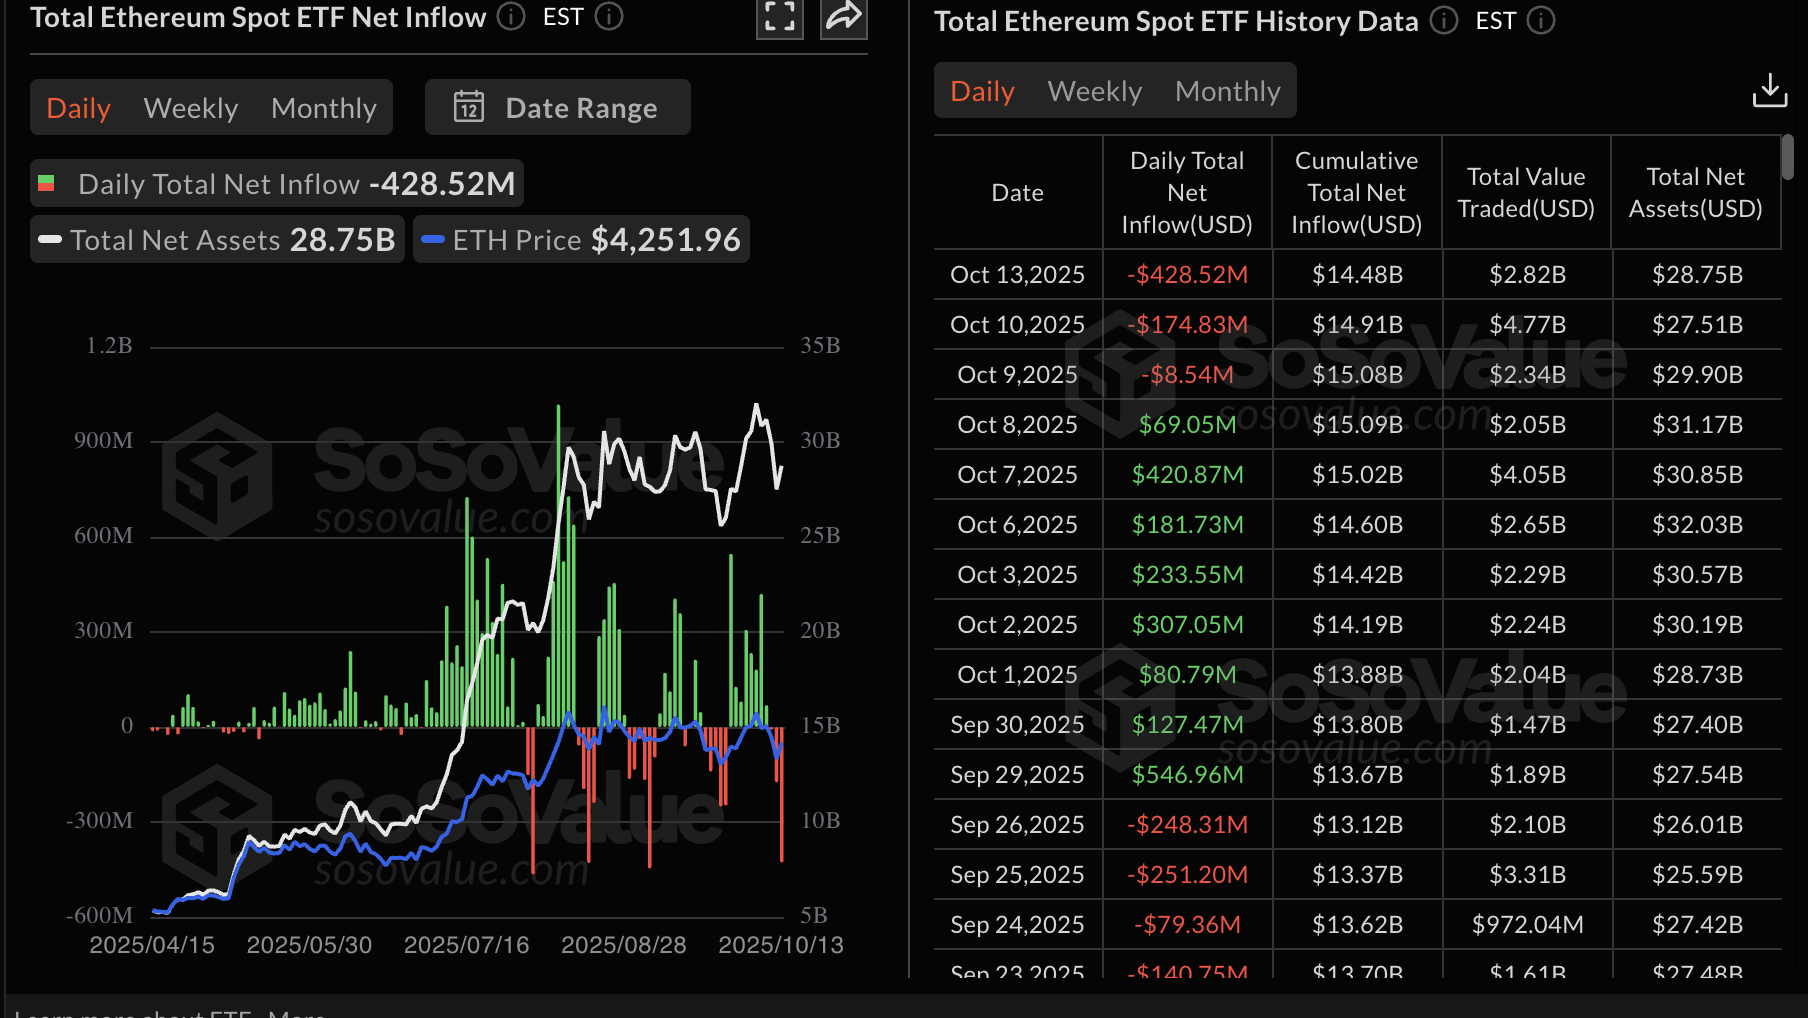
Ethereum spot ETF stats | Source: SoSoValue
Meanwhile, retail interest in XRP has stabilized over the past few days but remains subdued following last week’s deleveraging event, which triggered massive liquidations.
The XRP futures Open Interest (OI) averages $4.34 billion as of writing, after peaking at approximately $9 million on October 7. Still, a minor uptick from a four-month low of $4.2 billion, recorded on Sunday, suggests that XRP has the potential to attract retail demand.
An increasing OI trend would indicate that investors are gaining confidence in the token’s ability to sustain recovery.
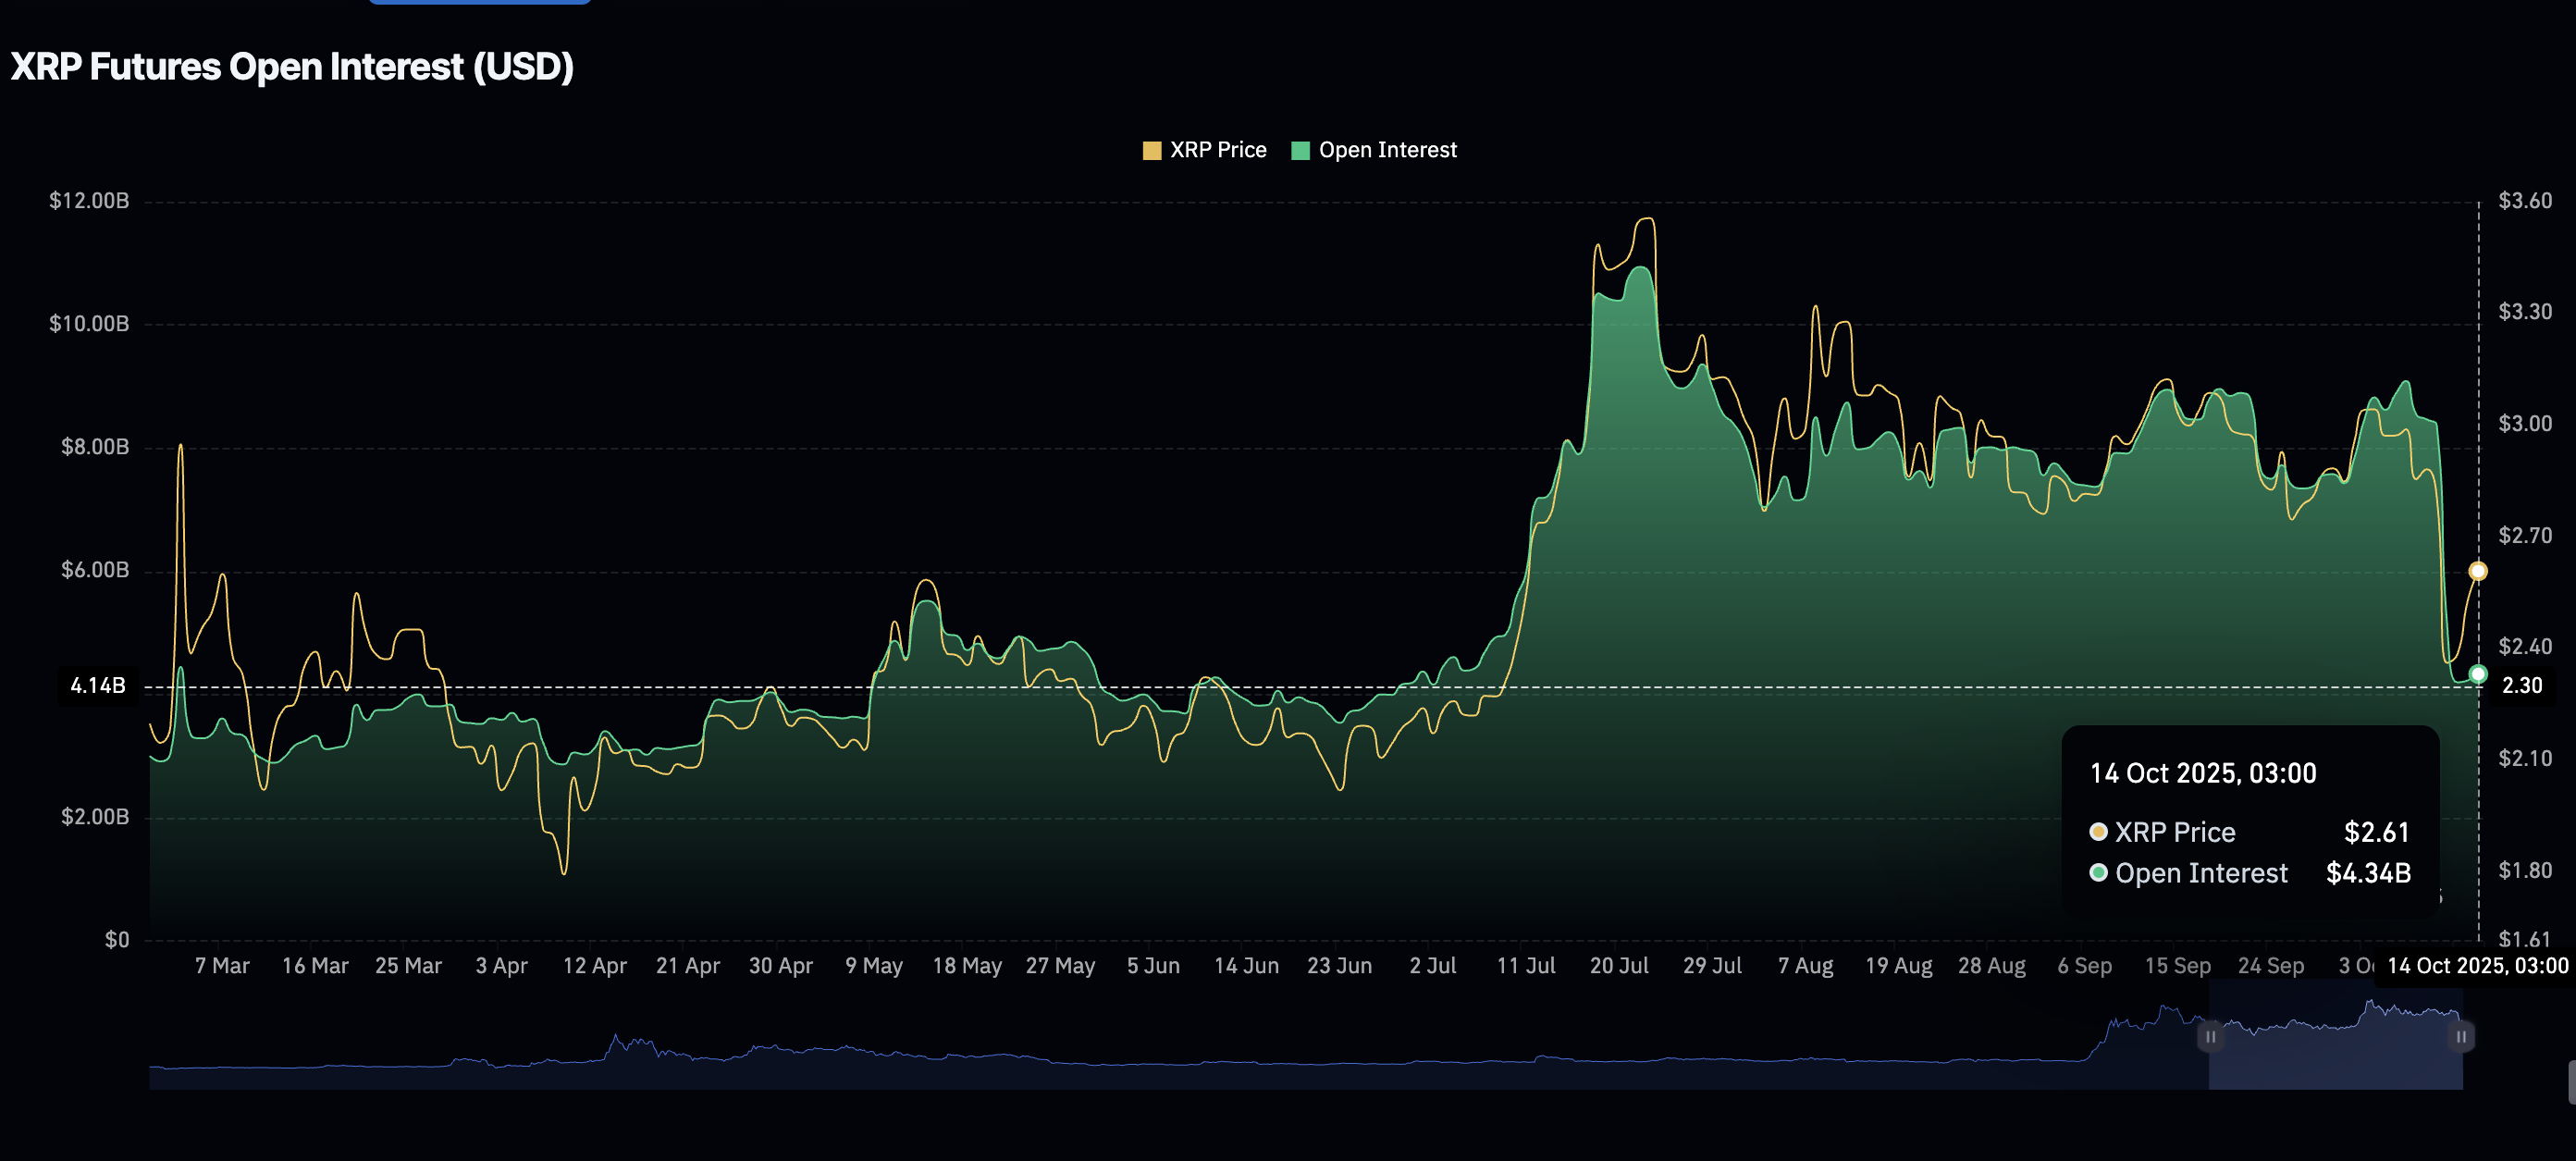
XRP Open Interest | Source: CoinGlass
Chart of the day: Bitcoin offers bearish signals
Bitcoin is trading below $112,000 at the time of writing on Tuesday. It is also positioned below key moving averages, including the 50-day Exponential Moving Average (EMA) at $115,473 and the 100-day EMA at $113,483, highlighting the bearish structure on the daily chart.
The sharp decline in the Relative Strength Index (RSI) to 42 after hitting overbought territory last week indicates that bearish momentum is increasing.
A sell signal maintained by the Moving Average Convergence Divergence (MACD) since Friday encourages investors to reduce risk exposure, contributing to selling pressure.
Key areas of interest include the 200-day EMA at $108,018, which should hold as support to prevent the down leg from stretching to test the previous week’s low at around $102,000. On the other side, the 50-day and 100-day EMAs could boost BTC’s bullish outlook if reclaimed as support levels.
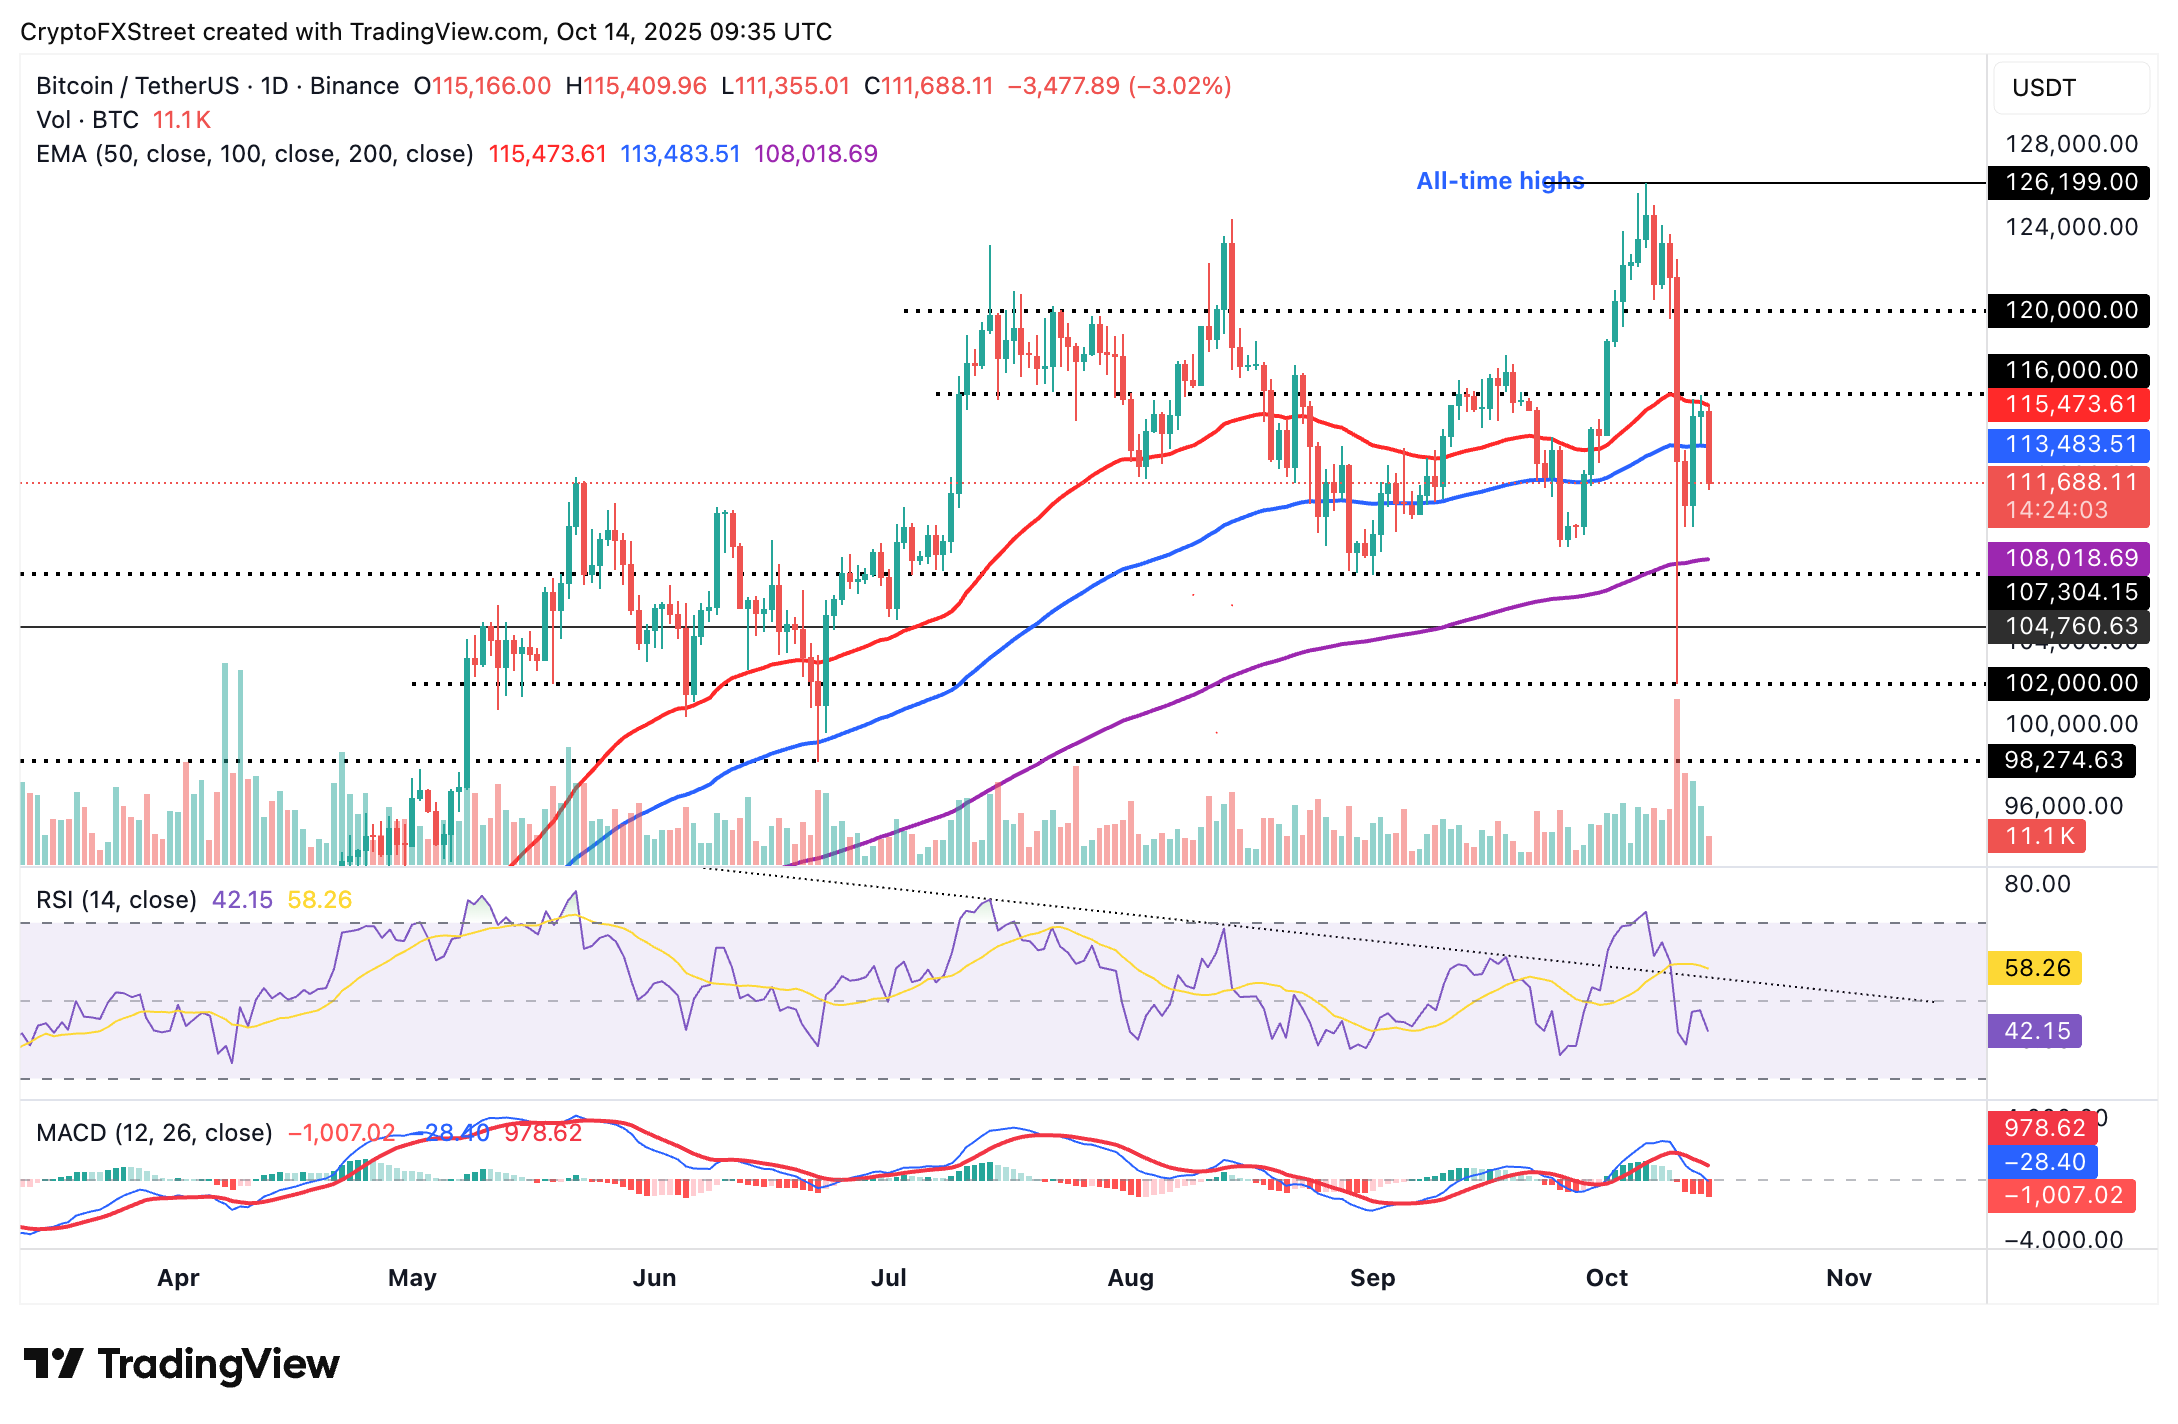
BTC/USDT daily chart
Altcoins update: Ethereum, XRP testing support
Ethereum remains largely in bearish hands on Tuesday, underpinned by multiple sell signals on the daily chart. The MACD indicator has maintained a sell signal since Friday, encouraging investors to adopt a bearish stance.
Another sell signal from the SuperTrend indicator also triggered on Friday, suggesting that sellers have the upper hand.
The RSI’s position in the bearish region marks yet another bearish signal. If the decline continues toward oversold territory, the path of least resistance will remain downward, increasing the chances of ETH developing a downtrend below the $4,000 level.
Still, a recovery is possible if the 100-day EMA support at $3,975 holds and investors buy the dip. A subsequent upswing above the 50-day EMA at $4,240 would affirm the bullish outlook.
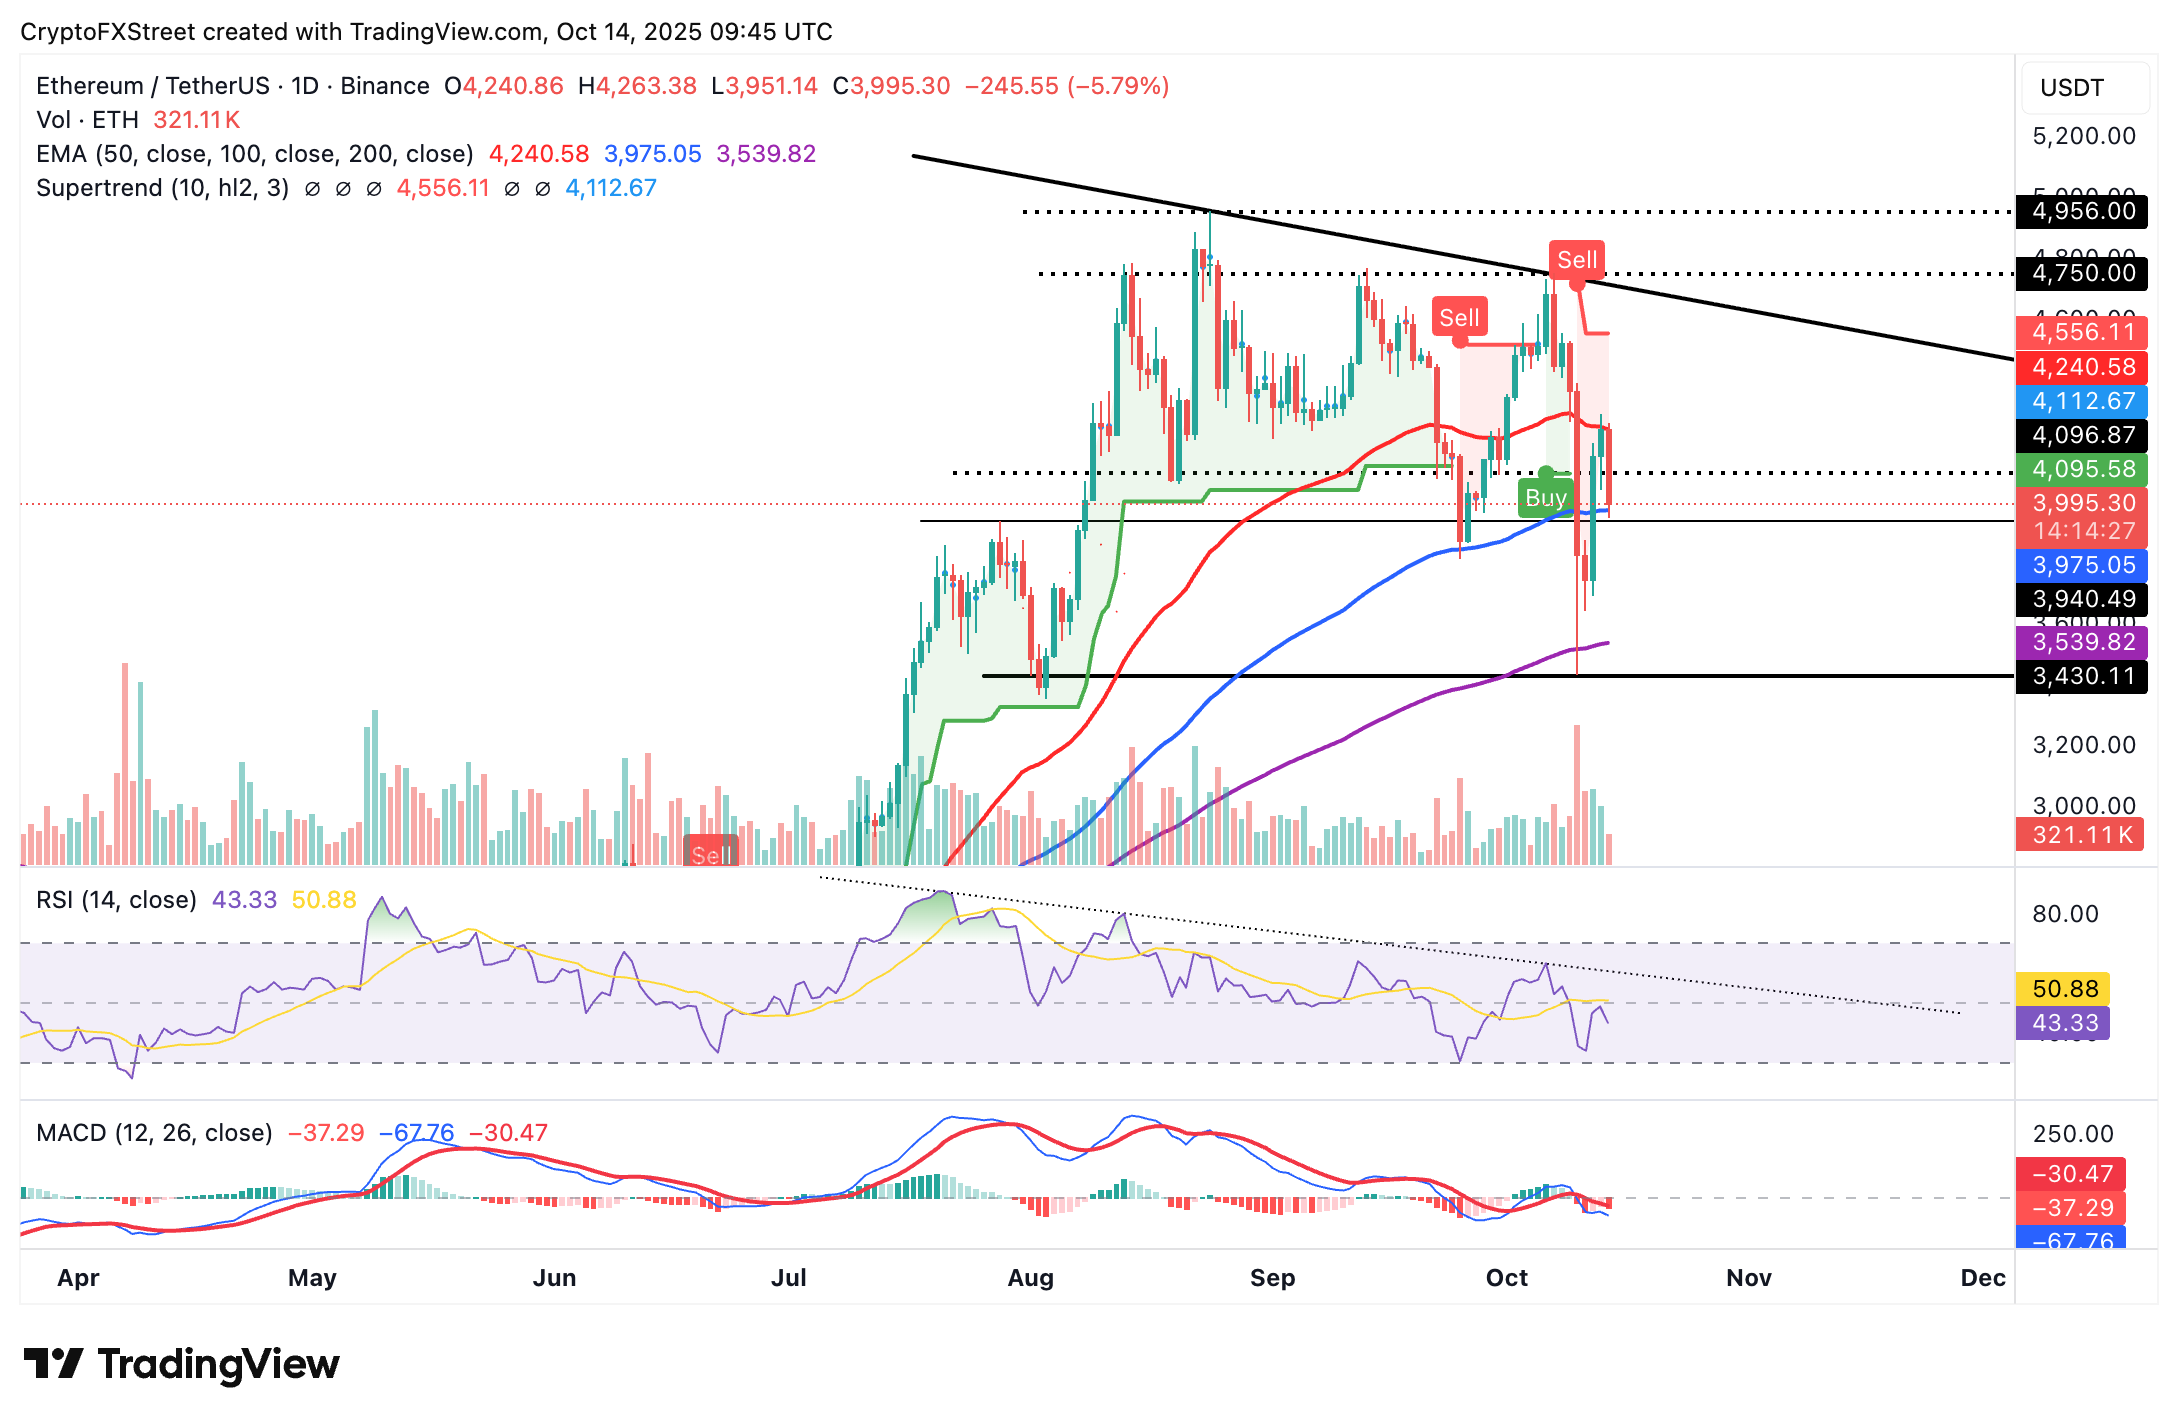
ETH/USDT daily chart
As for XRP, selling pressure has broken three consecutive days of recovery, which had propelled the token to test the 200-day EMA resistance at $2.63 on Monday. The cross-border money remittance token is trading above $2.40 at the time of writing, a short-term support level on the daily chart.
A sell signal from the MACD indicator reinforces the bearish outlook, while the RSI slides toward overbought territory.
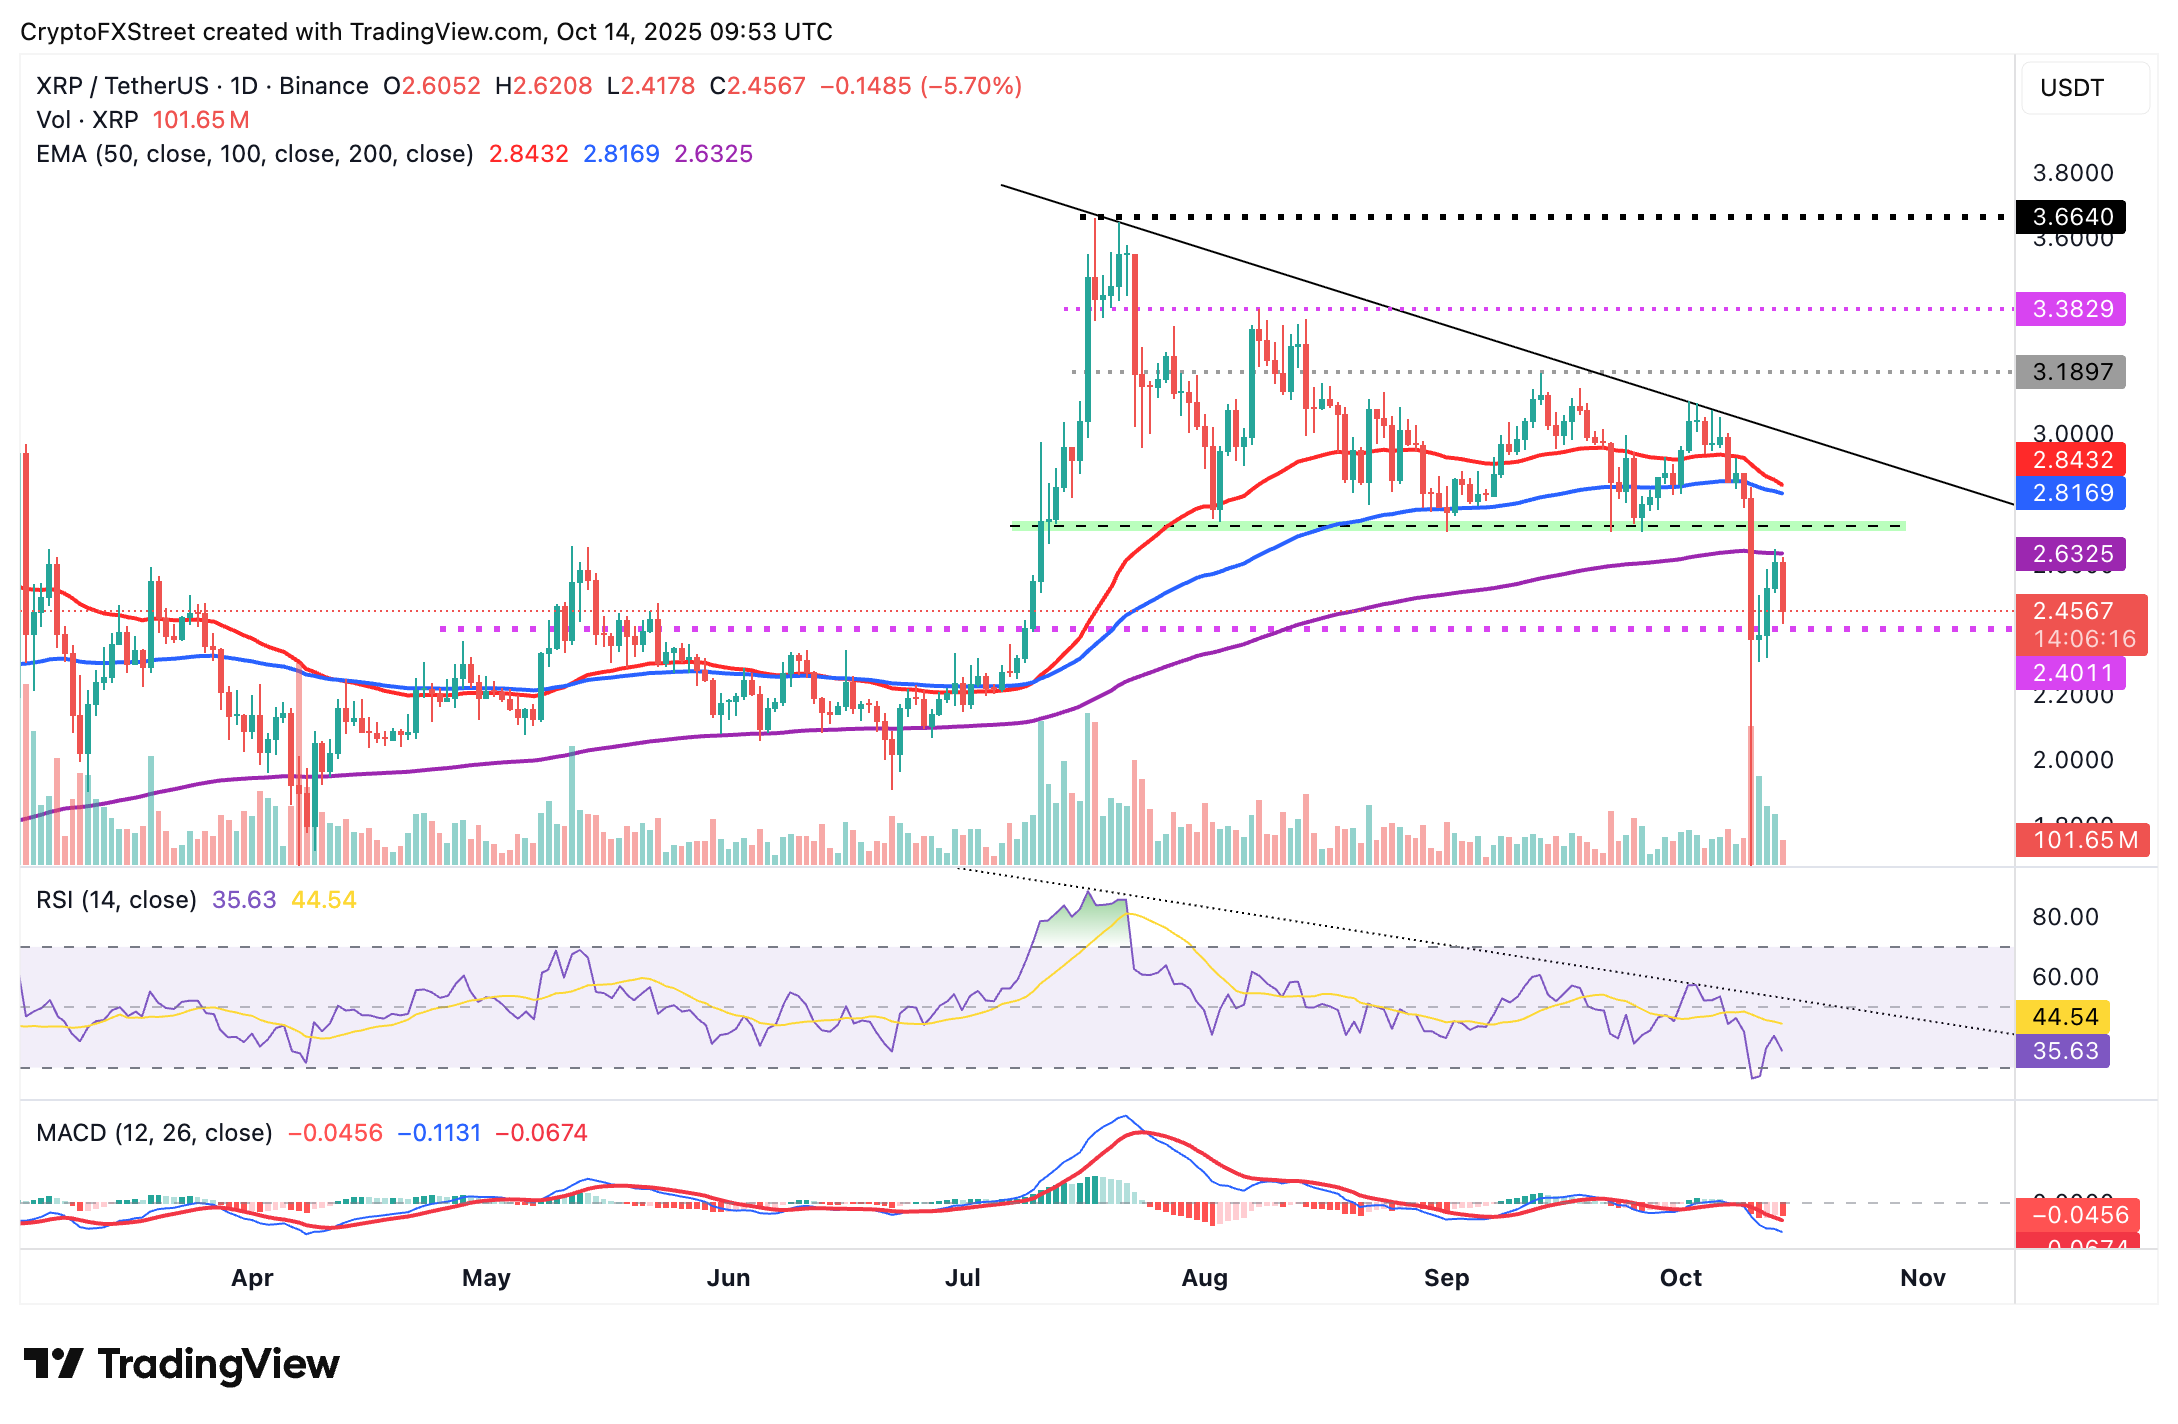
XRP/USDT daily chart
XRP could extend the down leg toward $2.00 if support at $2.40 is broken. However, bulls could reinforce their grip on reclaiming the 200-day EMA support at $2.63, increasing the odds of a breakout above the $3.00 psychological level.
Cryptocurrency metrics FAQs
The developer or creator of each cryptocurrency decides on the total number of tokens that can be minted or issued. Only a certain number of these assets can be minted by mining, staking or other mechanisms. This is defined by the algorithm of the underlying blockchain technology. On the other hand, circulating supply can also be decreased via actions such as burning tokens, or mistakenly sending assets to addresses of other incompatible blockchains.
Market capitalization is the result of multiplying the circulating supply of a certain asset by the asset’s current market value.
Trading volume refers to the total number of tokens for a specific asset that has been transacted or exchanged between buyers and sellers within set trading hours, for example, 24 hours. It is used to gauge market sentiment, this metric combines all volumes on centralized exchanges and decentralized exchanges. Increasing trading volume often denotes the demand for a certain asset as more people are buying and selling the cryptocurrency.
Funding rates are a concept designed to encourage traders to take positions and ensure perpetual contract prices match spot markets. It defines a mechanism by exchanges to ensure that future prices and index prices periodic payments regularly converge. When the funding rate is positive, the price of the perpetual contract is higher than the mark price. This means traders who are bullish and have opened long positions pay traders who are in short positions. On the other hand, a negative funding rate means perpetual prices are below the mark price, and hence traders with short positions pay traders who have opened long positions.
Artigos Recomendados


