
Dogecoin's DOJE ETF launch delayed to Friday – can DOGE hold gains?
- Dogecoin approaches the critical $0.25 hurdle as risk-on sentiment stabilizes across crypto markets.
- Dogecoin's DOJE ETF will go live in the US on Friday, per Bloomberg's Eric Balchunas.
- Retail demand for Dogecoin grows as futures Open Interest rises to $4.33 billion.
Dogecoin (DOGE) offers bullish signals, trading marginally below the critical $0.25 level on Thursday. The largest meme coin by market capitalization has weathered the volatility triggered by the United States (US) Consumer Price Index (CPI) report, increasing its value for two consecutive days.
A break above the short-term $0.25 hurdle could validate the meme coin's bullish outlook ahead of the launch of Dogecoin's Exchange Traded Fund (ETF) by Rex-Osprey (REX Shares and Osprey Funds).
Dogecoin steadies uptrend ahead of DOJE ETF launch
Rex-Osprey's DOJE ETF launch has been pushed to Friday amid delays confirmed by Bloomberg's analyst Eric Balchunas. As initially reported, the DOJE ETF was expected to start trading on Thursday.
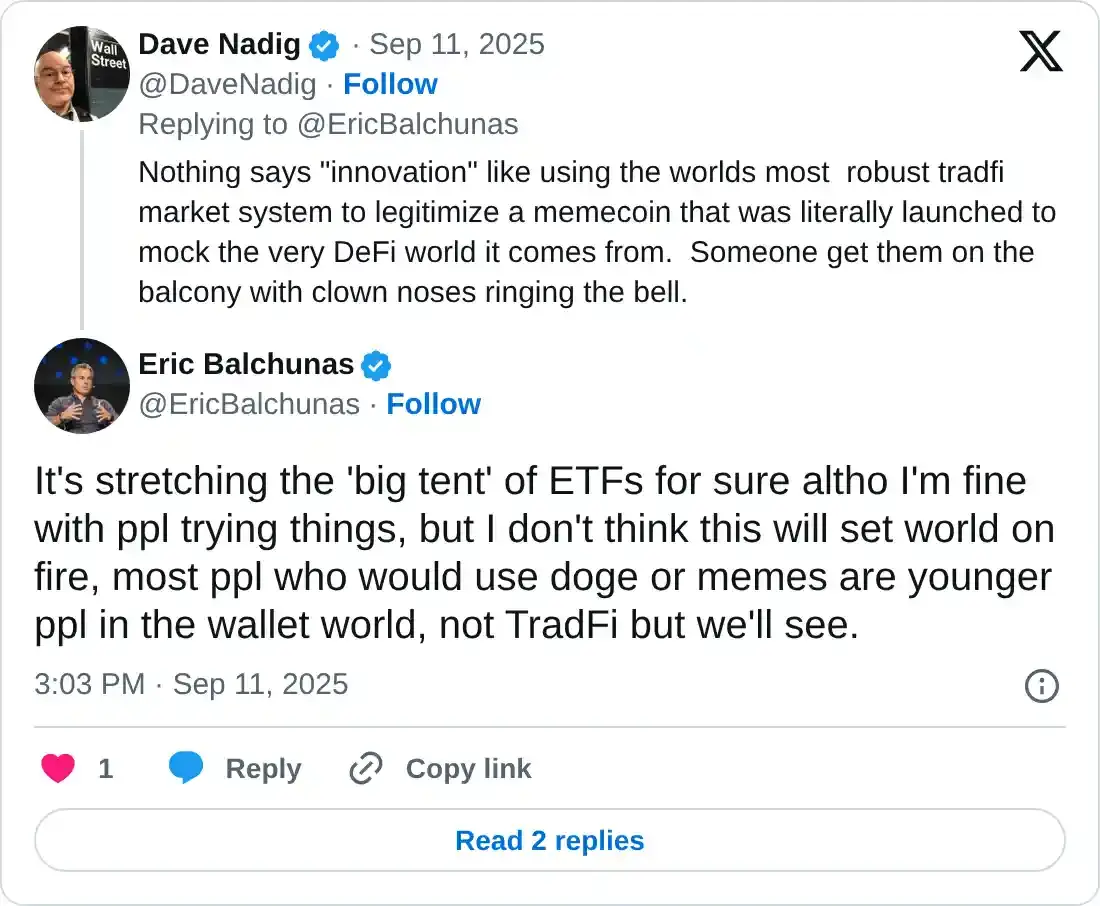
The launch of the DOJE ETF could mark a significant milestone for the meme coin sector and a new era for traditional finance (TradFi), which will, for the first time, have access to "something that has no utility on purpose."
Balchunas added that the DOJE ETF could imply "stretching the 'big tent' of ETFs," citing that fewer people will likely prefer exposure to meme coins. The analyst argued that "most people who would use DOGE or memes are younger people in the wallet world, not TradFi."
The Rex-Osprey DOJE ETF is incorporated in the US. It seeks investment outcomes, before fees and expenses, that align with the real-time performance of Dogecoin. Rex-Osprey will invest 80% of its net assets in the underlying asset (DOGE) and other assets that provide exposure to the Dogecoin price.
Meanwhile, retail demand for Dogecoin is steadily increasing, evidenced by the futures Open Interest (OI). CoinGlass data shows that OI, referring to the notional value of outstanding futures contracts, averages $4.33 billion, up from $3.3 billion on Sunday.
The rising trend in OI suggests that investors have a strong conviction in Dogecoin's ability to sustain the current uptrend, targeting the $0.28 hurdle, last tested on July 21.
Technical outlook: Dogecoin offers bullish signals
Dogecoin holds significantly above key moving averages, including the 50-day Exponential Moving Average (EMA) at $0.22, the 100-day EMA, and the 200-day EMA, all at $0.21.
Dogecoin bulls have the upper hand, backed by a buy signal from the Moving Average Convergence Divergence (MACD) indicator that has been in effect since Sunday. Traders often increase exposure when the MACD line in blue holds above the red signal line.
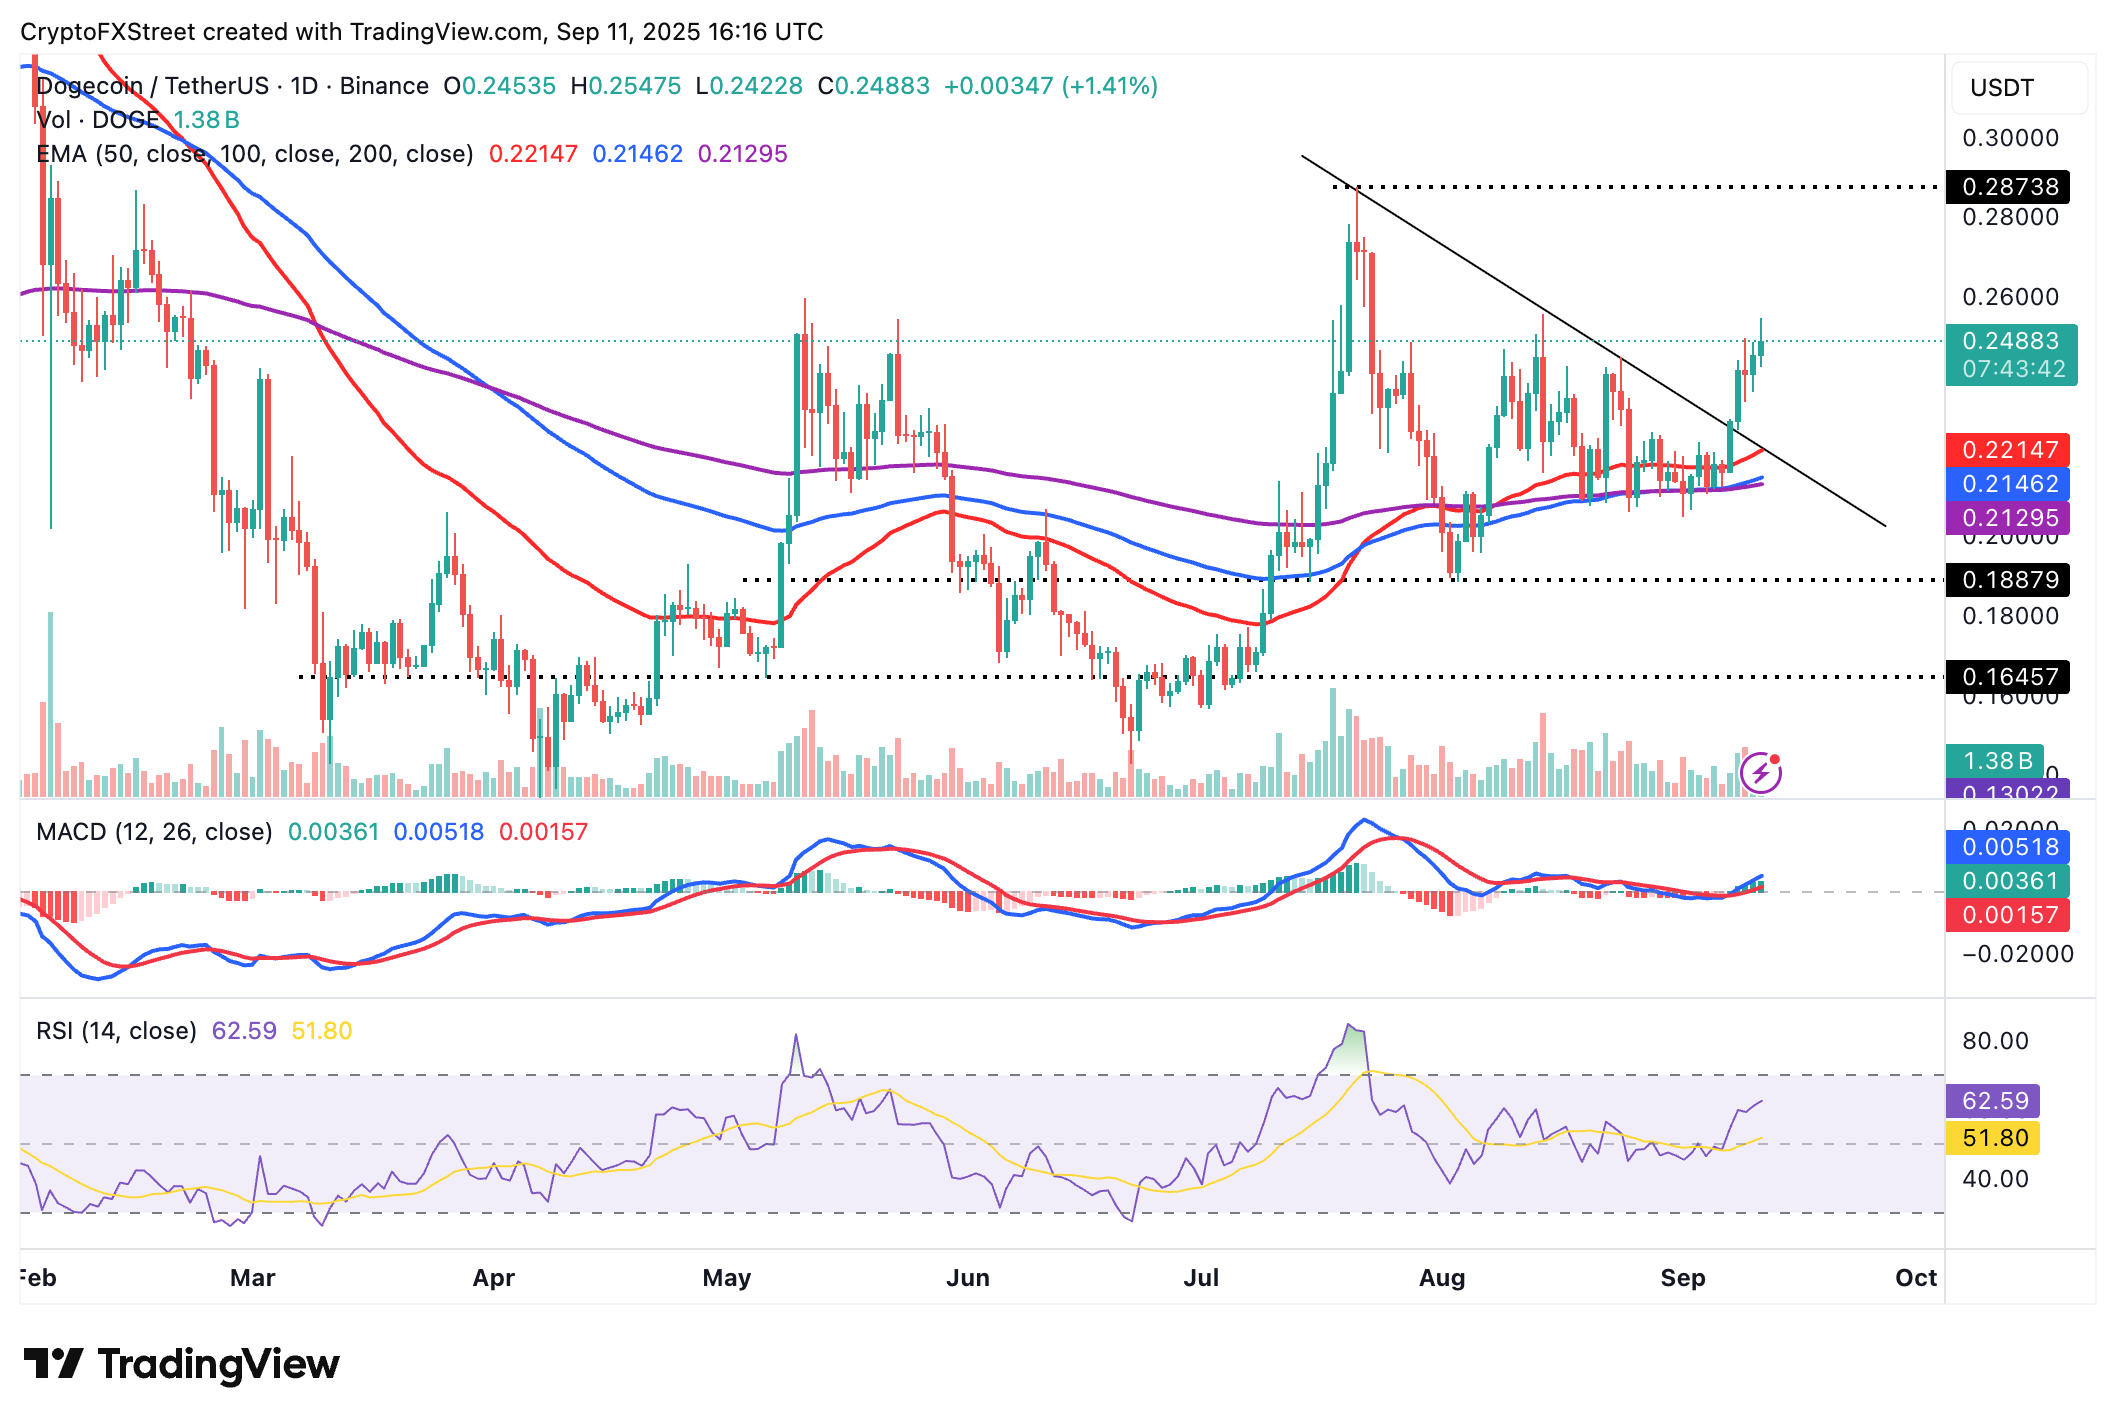
DOGE/USDT daily chart
A steady increase in the Relative Strength Index (RSI) at 65 reinforces the bullish grip. Higher RSI readings approaching the overbought region indicate bullish momentum building as selling pressure declines.
The resistance at $0.25 is worth watching over the coming days as movement on either side could shape Dogecoin's short-term outlook. In the event of aggressive selling due to potential profit-taking, traders will shift their focus to the 50-day EMA at $0.22, as well as the 100-day and 200-day EMAs at $0.21, to provide support.
Open Interest, funding rate FAQs
Higher Open Interest is associated with higher liquidity and new capital inflow to the market. This is considered the equivalent of increase in efficiency and the ongoing trend continues. When Open Interest decreases, it is considered a sign of liquidation in the market, investors are leaving and the overall demand for an asset is on a decline, fueling a bearish sentiment among investors.
Funding fees bridge the difference between spot prices and prices of futures contracts of an asset by increasing liquidation risks faced by traders. A consistently high and positive funding rate implies there is a bullish sentiment among market participants and there is an expectation of a price hike. A consistently negative funding rate for an asset implies a bearish sentiment, indicating that traders expect the cryptocurrency’s price to fall and a bearish trend reversal is likely to occur.
Artigos Recomendados


