
Will institutions outperform Bitcoin? If so, then how?
- Institutional interest in Bitcoin continues to shape market dynamics, including demand and supply.
- Bitcoin spot ETFs accumulate over 1.2 million BTC in approximately 18 months, significantly reducing the circulating supply.
- Publicly-listed companies with exposure to BTC eke out a spot in the global equities market, promising growth and an inflation hedge.
Bitcoin (BTC) is slowly gaining traction in the global equities market as an alternative investment asset, particularly for institutions seeking exposure via spot exchange-traded funds (ETFs).
Since their approval in the United States (US) in January 2024, spot ETFs have accumulated over 1.2 million BTC, underscoring their influence on key market dynamics including volatility, supply, demand and risk.
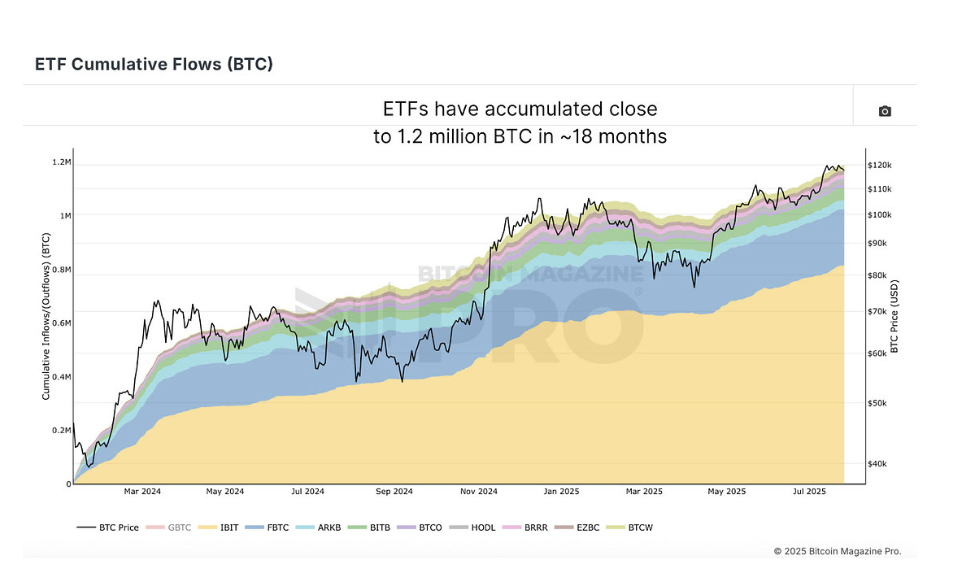
Bitcoin ETF cumulative flows
Understanding institutional influence on Bitcoin
The phrase “institutional investors” is loosely used to refer to companies investing in Bitcoin via ETFs. However, it covers an array of investors, including “high-net-worth individuals, family offices, and some actual institutional funds,” according to a Bitcoin Magazine report.
SoSoValue data shows that there are 24 non-Bitcoin mining companies actively holding BTC. Strategy is the largest corporate holder of Bitcoin, with 628,791 BTC, followed by Metaplanet, 17,795 BTC, while Tesla comes in third place with 11,509 BTC. Cumulatively, these companies hold approximately 709,420 BTC valued at around $82.38 billion.
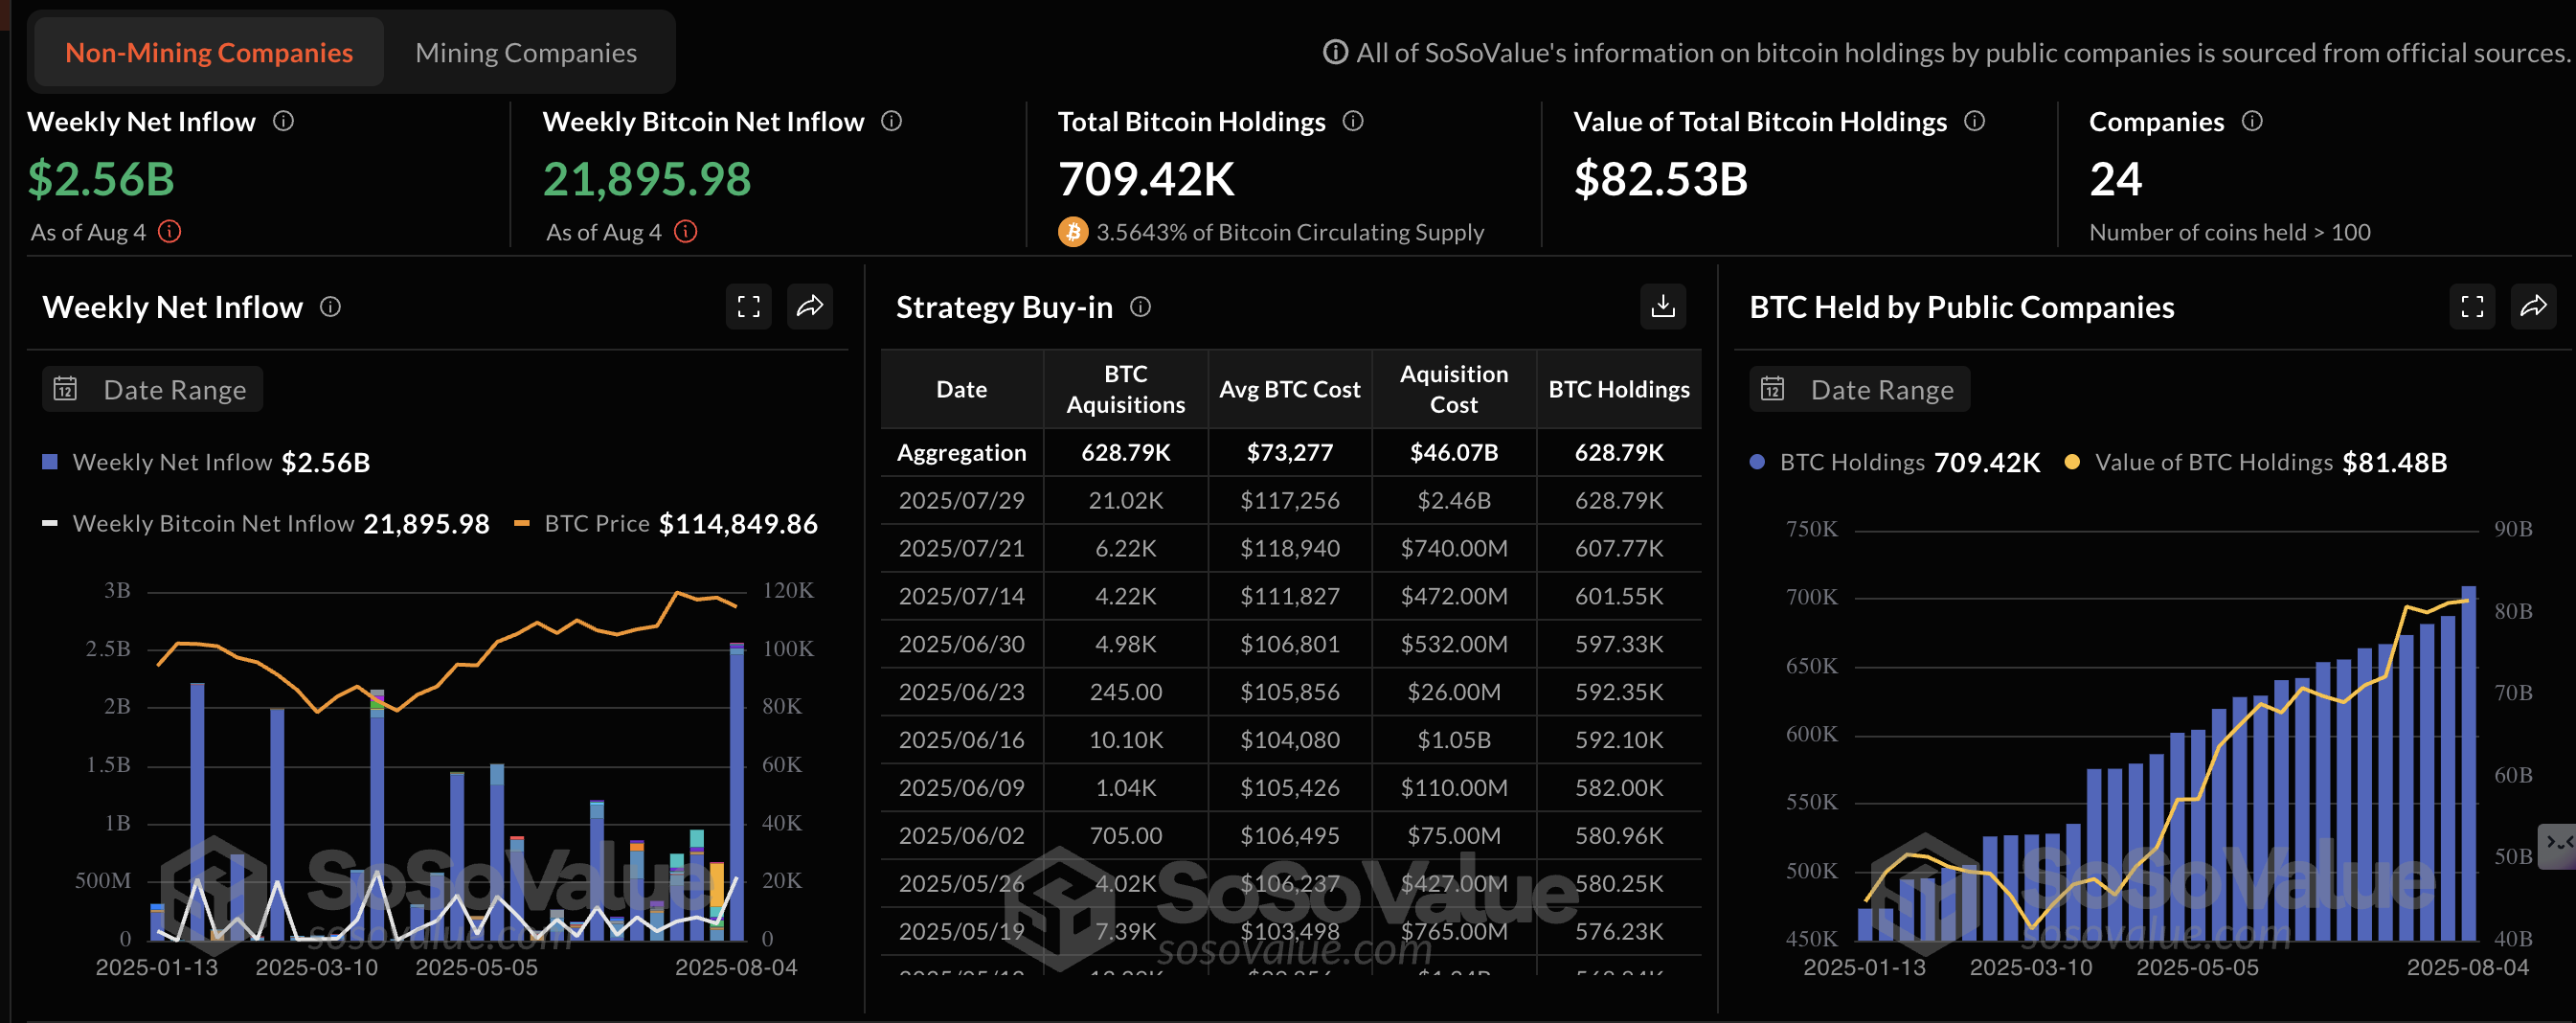
Bitcoin treasuries data | Source | SoSoValue
The rate at which non-Bitcoin mining companies are accumulating Bitcoin is steadily growing. This, paired with long-term holding behaviour as portrayed by Strategy, could alter Bitcoin’s liquidity and volatility status. Some of these coins may never return to active circulation.
ETF flows suggest that institutions are not unconcerned about the price at which they purchase Bitcoin, with some seemingly buying into local tops and even capitulating at local bottoms.
“A comparison between ETF flows and Bitcoin Funding Rates, a retail sentiment barometer, shows an uncanny synchronicity. Institutions are essentially buying and selling in lockstep with retail, not ahead of them,” the Bitcoin Magazine report states.
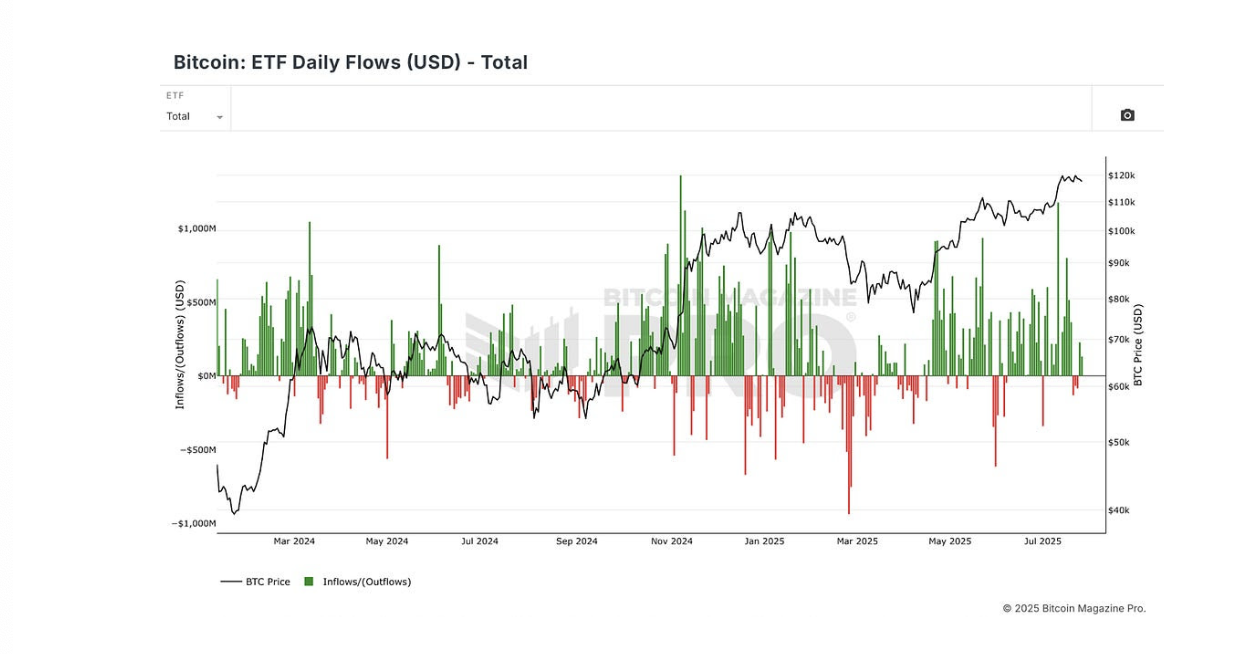
Bitcoin ETF Flows | Source: Bitcoin Magazine
Can institutions outperform Bitcoin?
Publicly-listed companies like Strategy and Metaplanet provide investors with indirect access to Bitcoin. Investors buying related equities on the stock market gain indirect exposure to Bitcoin, potentially hedging against inflation.
Bitcoin’s finite maximum supply of 21 million coins is a major factor considered by investors. In contrast, fiat currencies like the US Dollar (USD) grapple with inflation as central banks continuously print money.
As the price of Bitcoin increases, treasury companies build value for shareholders, making related stocks even more valuable. While it may take Bitcoin a rather long time to double its all-time high of $122,218, institutions on the stock exchange have the potential to increase in value, possibly outperforming BTC.
Technical outlook: Bitcoin uptrend falters
Bitcoin extended its recovery this week following last week's sell-off, reaching an intraday high of around $117,664 on Friday. A subsequent reversal has seen the price of BTC decline to $116,079, holding slightly above the 100-period Exponential Moving Average (EMA) at $115,850 on the 4-hour chart.
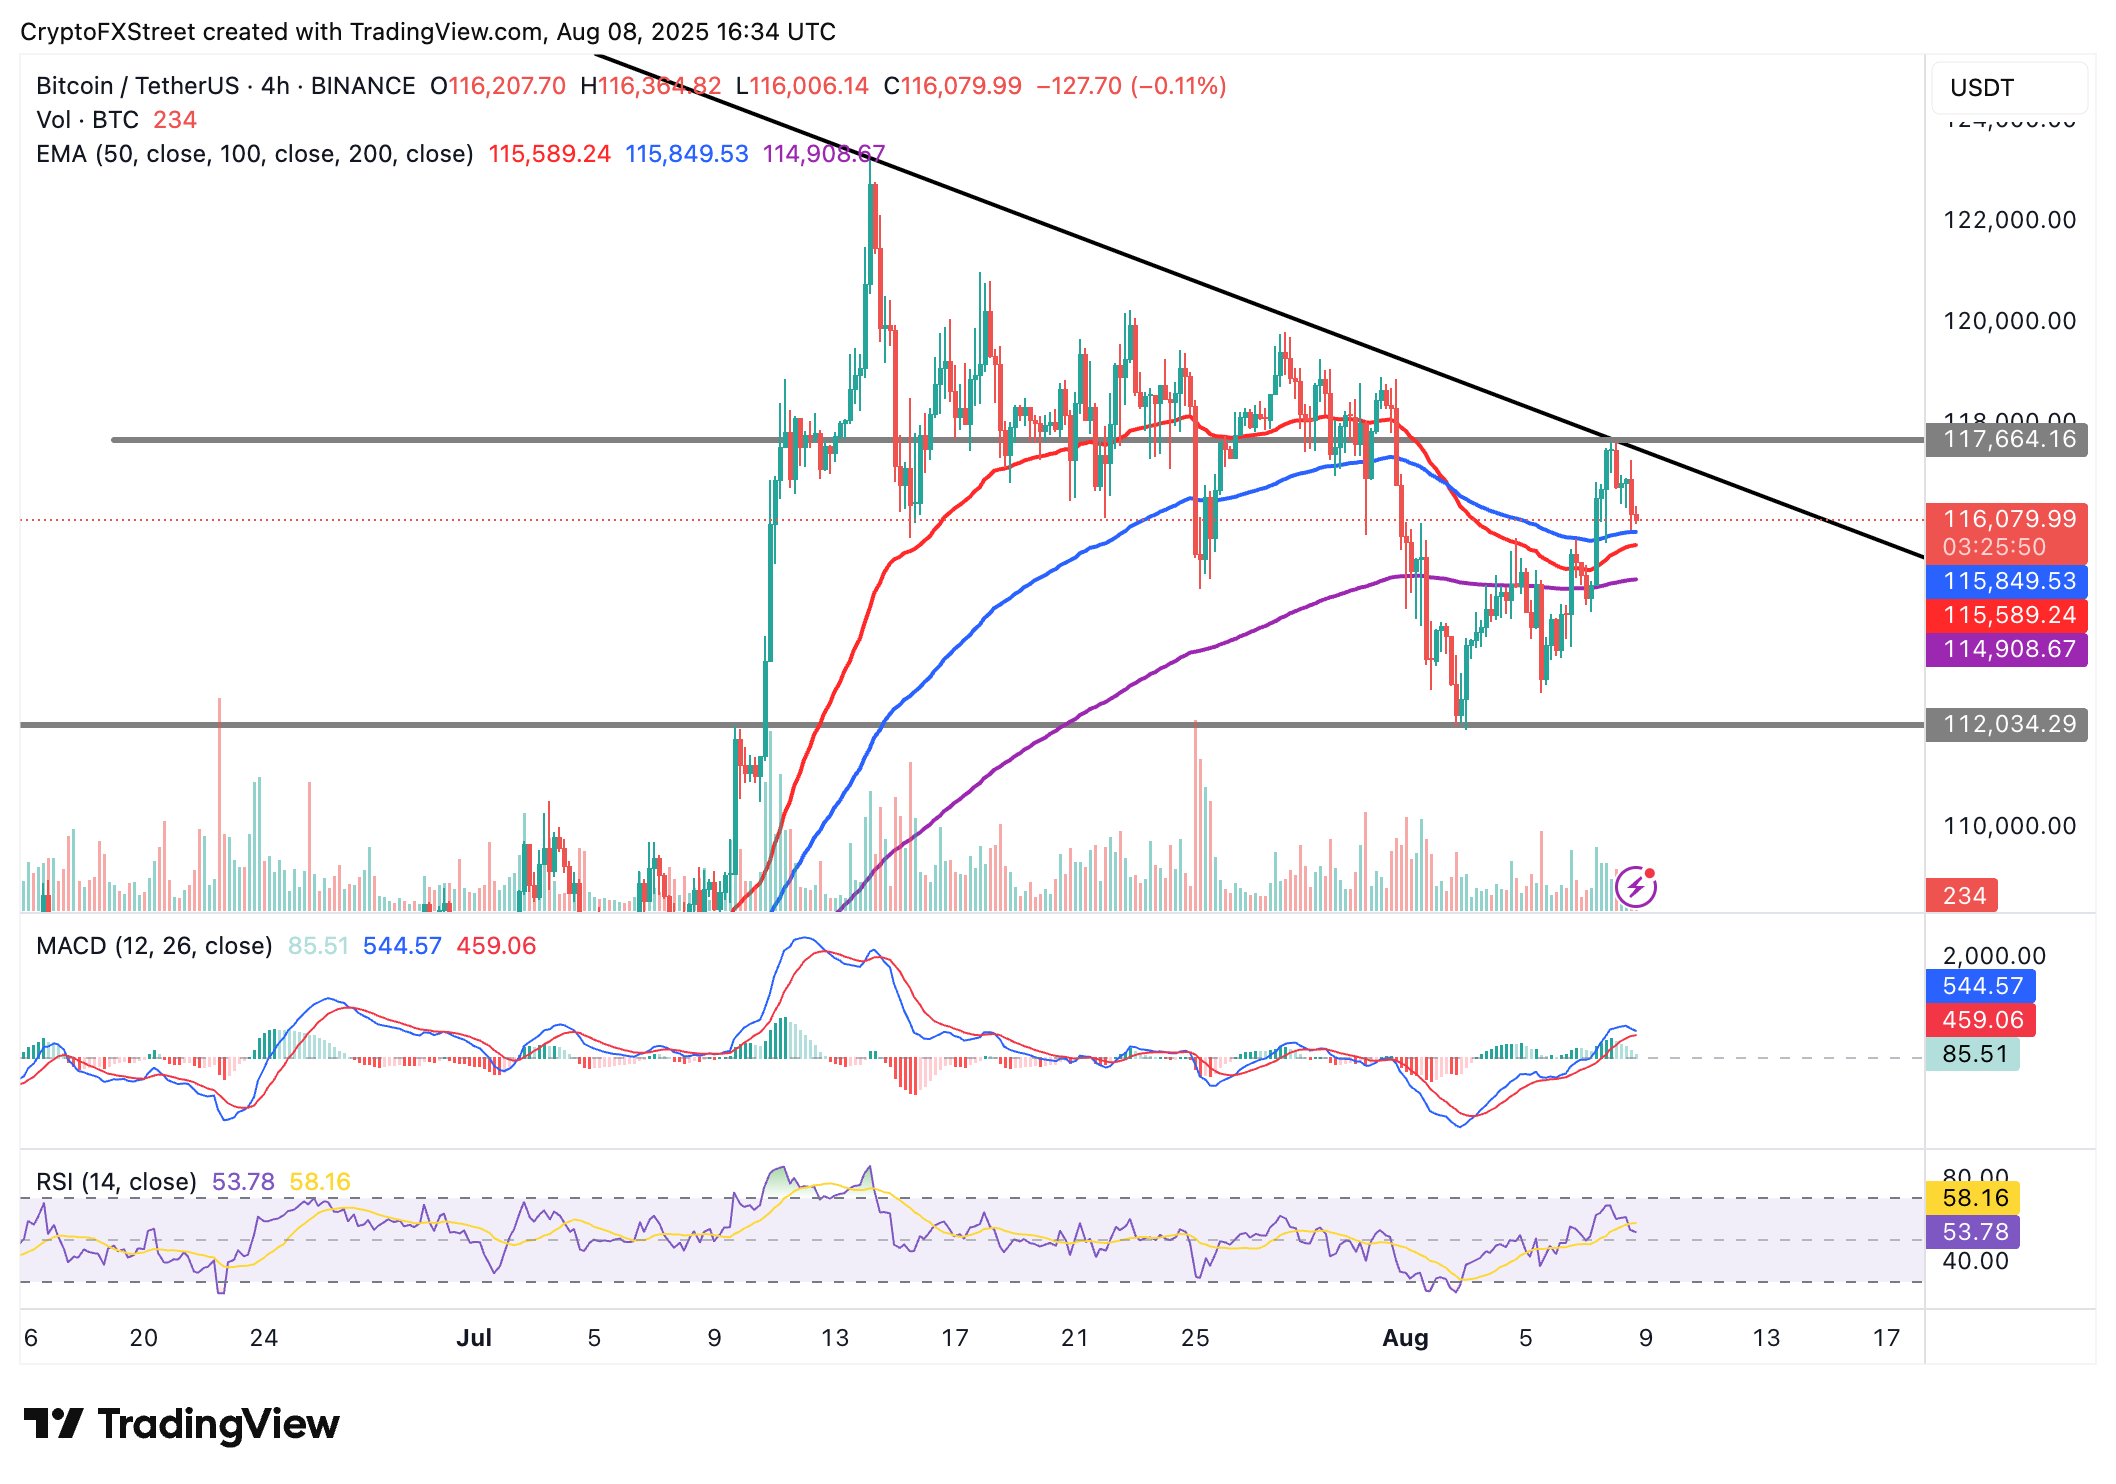
BTC/USDT 4-hour chart
The Relative Strength Index (RSI), which is retreating toward the midline, indicates waning buying pressure. Traders should also watch out for a potential short-term sell signal from the Moving Average Convergence Divergence (MACD) indicator. Such a signal manifests with the blue MACD line crossing below the red signal line, encouraging traders to reduce exposure. Bitcoin price could drop toward last week’s support at around $112,000 if supply overshadows demand.
Cryptocurrency metrics FAQs
The developer or creator of each cryptocurrency decides on the total number of tokens that can be minted or issued. Only a certain number of these assets can be minted by mining, staking or other mechanisms. This is defined by the algorithm of the underlying blockchain technology. On the other hand, circulating supply can also be decreased via actions such as burning tokens, or mistakenly sending assets to addresses of other incompatible blockchains.
Market capitalization is the result of multiplying the circulating supply of a certain asset by the asset’s current market value.
Trading volume refers to the total number of tokens for a specific asset that has been transacted or exchanged between buyers and sellers within set trading hours, for example, 24 hours. It is used to gauge market sentiment, this metric combines all volumes on centralized exchanges and decentralized exchanges. Increasing trading volume often denotes the demand for a certain asset as more people are buying and selling the cryptocurrency.
Funding rates are a concept designed to encourage traders to take positions and ensure perpetual contract prices match spot markets. It defines a mechanism by exchanges to ensure that future prices and index prices periodic payments regularly converge. When the funding rate is positive, the price of the perpetual contract is higher than the mark price. This means traders who are bullish and have opened long positions pay traders who are in short positions. On the other hand, a negative funding rate means perpetual prices are below the mark price, and hence traders with short positions pay traders who have opened long positions.
Artigos Recomendados


