


GBP/JPY Price Analysis: Bullish sentiment moderates and bears start to gear up
- Decreasing RSI on the daily chart, along with rising MACD red bars, signal an increase in selling pressure.
- On the hourly chart, there are signs of a steady positive momentum.
On Thursday, the GBP/JPY pair declined to 189.58, recording a 0.27% loss. It's noted a somewhat subdued bullish drive, with bears starting to gain ground. The negative tone is more clear on the daily chart while on the hourly chart buyers remain resilient.
On the daily chart, the GBP/JPY's Relative Strength Index (RSI) has been hovering in the positive terrain, with a decline in the latest reading, suggesting a moderation in buying pressure. Moreover, the Moving Average Convergence Divergence (MACD) also indicates a dampened bullish sentiment, as the red bars are on the rise.
GBP/JPY daily chart
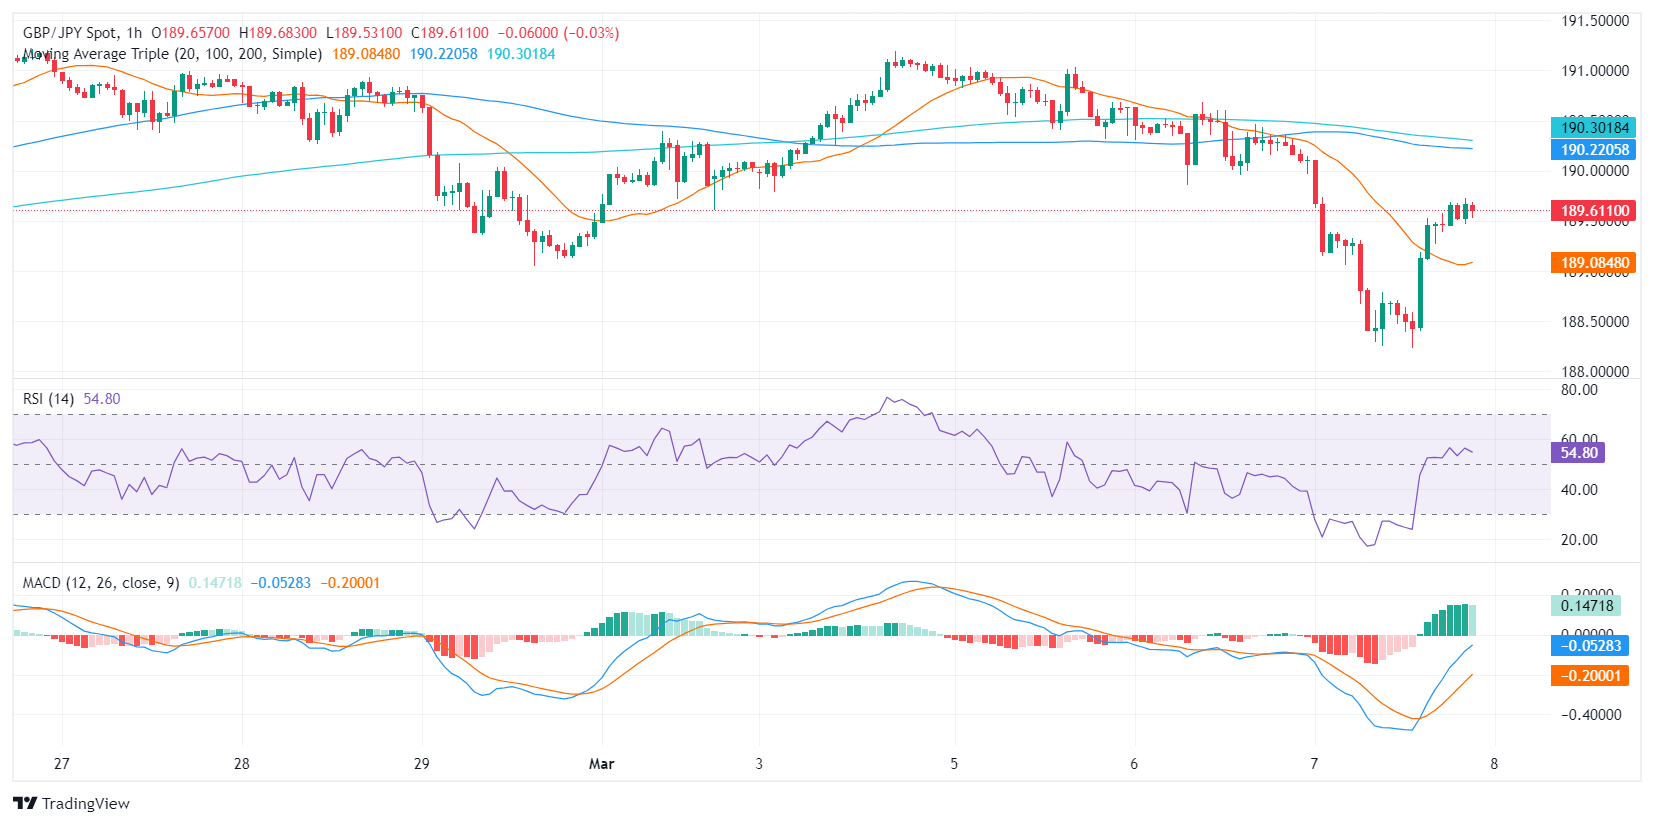
Turning to the hourly chart, the RSI similarly operates within the positive zone, trending flat in its last readings. The MACD histogram, however, reflects decreasing positive momentum, as it prints declining green bars.
GBP/JPY hourly chart
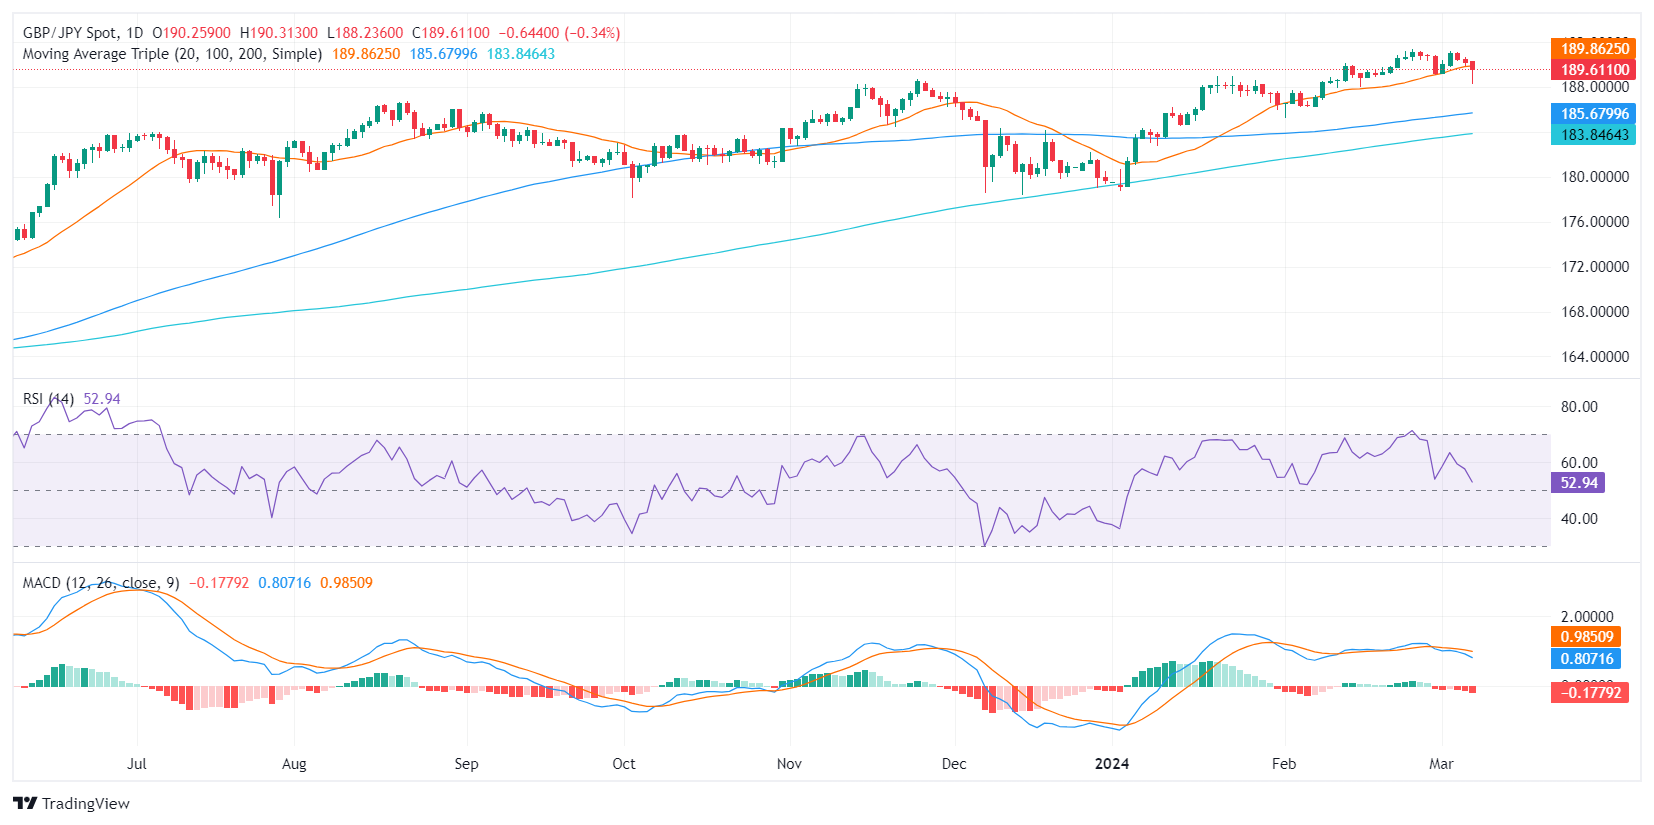
Altogether, the chart seems to be pointing to weakening bullish traction and a resurgence of the bears. However, given that the pair is above the 20,100 and 200-day Simple Moving Averages (SMAs) the overall trend remains bullish.
Artigos Recomendados


