


Shiba Inu Price Analysis: SHIB whale demand declines 88% amid two-week consolidation phase
- Shiba Inu price has been consolidating around the $0.000016 mark over the last two weeks.
- Average Transaction Size on the Shiba Inu network has declined by 88% between February 3 and Sunday.
- The RSI and EMA technical indicators signal $0.000015 breakdown risks ahead.
Shiba Inu (SHIB) price opened trading around the $0.000016 mark on Monday, having consolidated within a 5% tight range over the last two weeks. On-chain data shows whale investors have gradually reduced their exposure to SHIB amid the ongoing price stagnation phase.
Shiba Inu stagnates at $0.000016 as bullish and bearish signals counteract
Shiba Inu’s price action has been relatively muted in February as bullish and bearish catalysts counteract each other.
While it still maintains its place as the second-largest meme coin behind Dogecoin (DOGE), Shiba Inu has ceded considerable ground in the past month, with the US President Donald Trump meme token encroaching on its market share.
On the positive side, the Securities and Exchange Commission’s (SEC) acknowledgment of a Dogecoin Exchange Traded Fund (ETF) has spurred investor confidence in legacy meme coins, including SHIB.
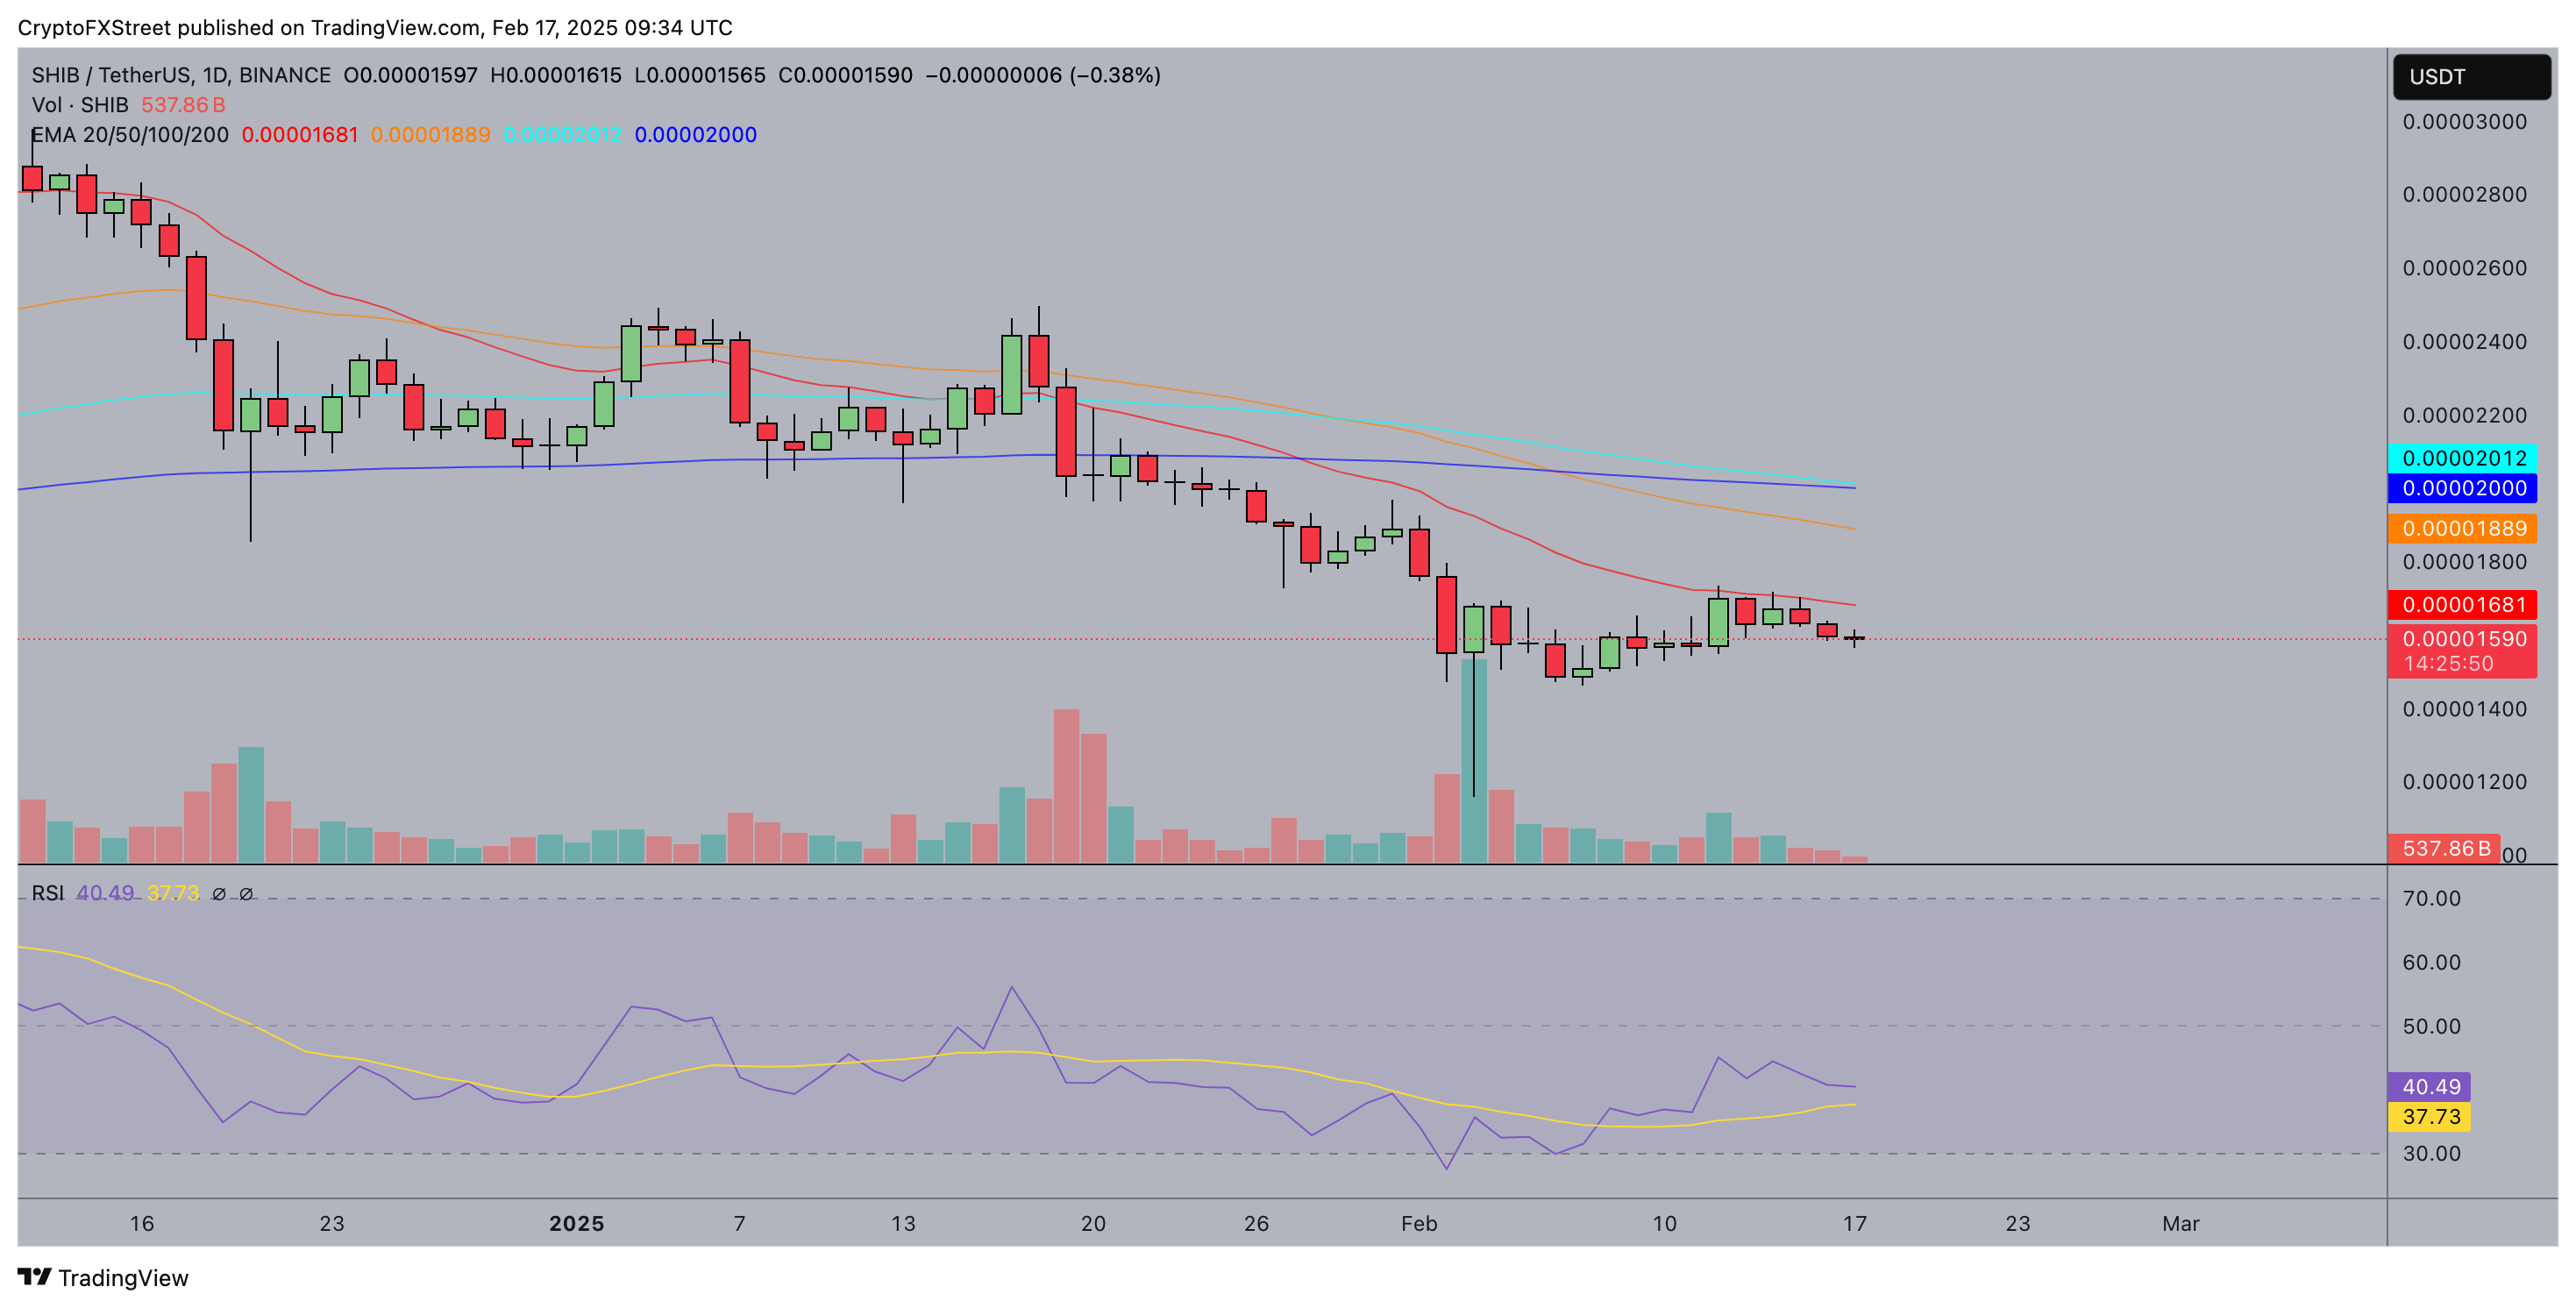
Shiba Inu price action (SHIB/USDT)
Emphasizing the neutral market sentiment, the chart above shows how SHIB’s price has trended sideways within the $0.000015 to $0.000017 range since February 8.
At press time, Shiba Inu trades at $0.000016 on Binance, with bears looking to tighten their grip.
The parabolic SAR indicator displays a cluster of dots above the price action, reinforcing the downward pressure.
Meanwhile, the RSI hovers slightly above 45, suggesting the asset remains in neutral-to-bearish territory.
If buyers fail to gain momentum, SHIB risks breaking below the $0.000015 support level.
However, a potential bounce off this level could open the door for a bullish reversal toward the $0.000017 resistance zone, contingent on increased whale demand and the broader meme coin’s sector strength.
Shiba Inu large transactions decline as price stagnates
Another key factor hinting at Shiba Inu’s struggle to break out from its extended consolidation phase is the whale accumulation patterns observed in recent weeks.
On-chain data suggests that large-scale investors have been significantly reducing their exposure to SHIB.
IntoTheBlock’s Average Transaction metric, which tracks daily buy and sell trades of whale investors, offers critical insights into market sentiment.
The metric measures the average Dollar value of all transactions executed on the Shiba Inu network on a given day.
When the average transaction size increases, it signals either retail investors deploying larger capital or whale investors executing high-volume trades.
Conversely, a decline in the metric reflects lower high-value transaction activity, often indicative of fading investor confidence.
Over the last week, SHIB’s Average Transaction Size has plummeted 88%, dropping from $39,000 on February 3 to a monthly low of $4,707 on Sunday, according to the latest on-chain data. This sharp decline underscores waning whale participation, reinforcing SHIB’s ongoing price stagnation.
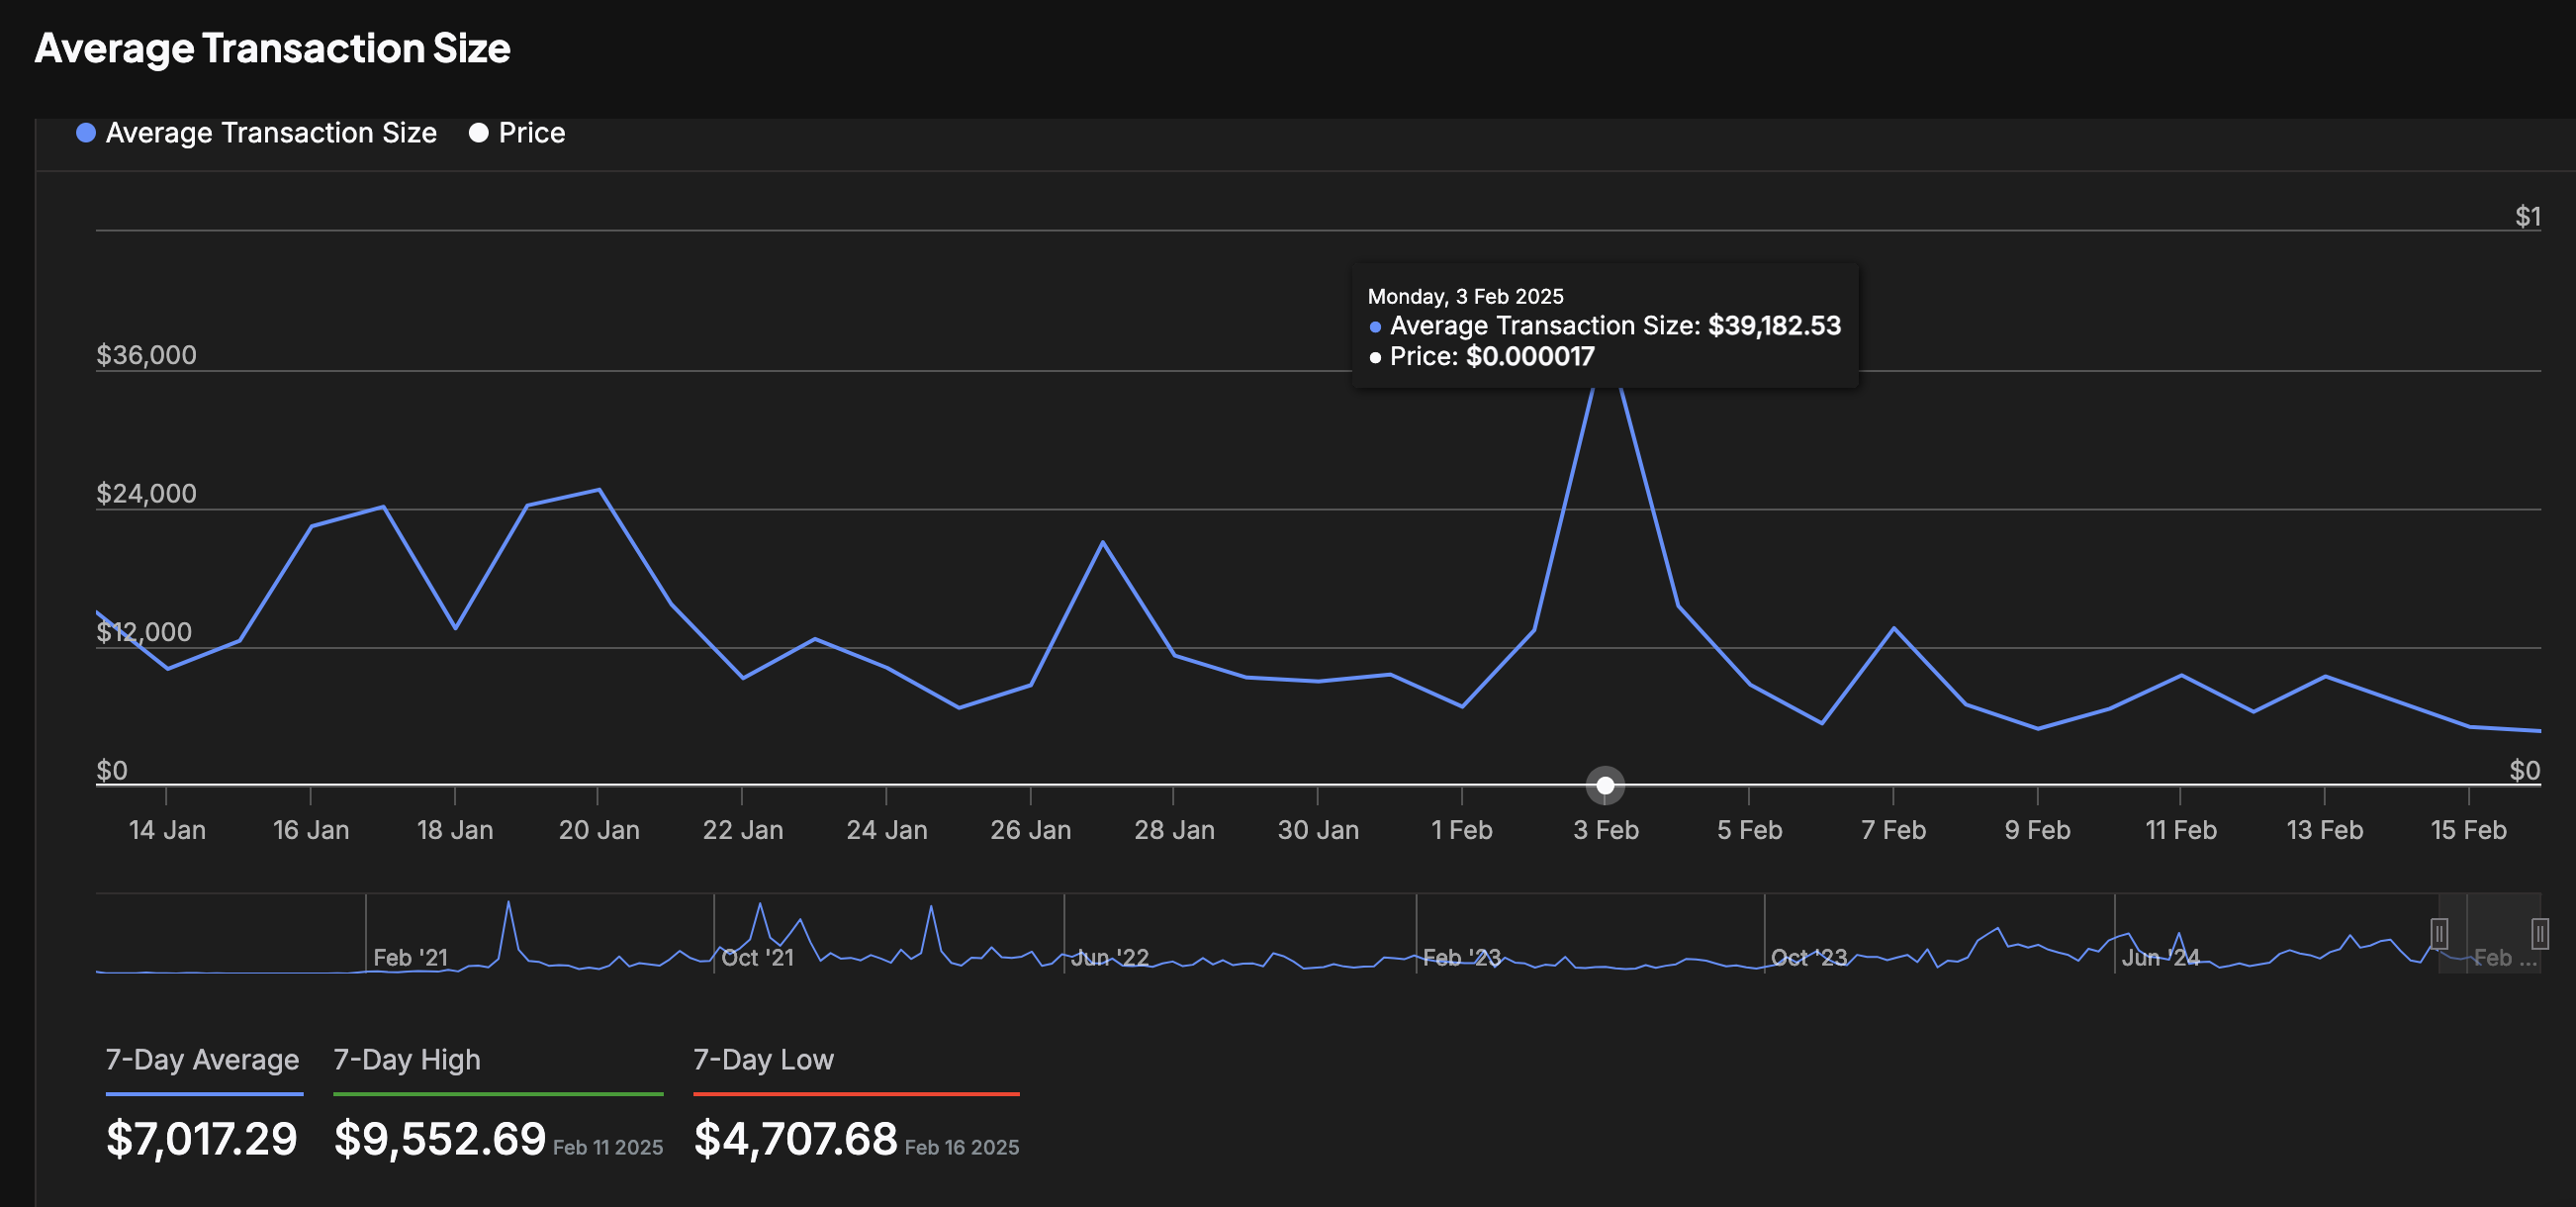
Shiba Inu Average Transaction Size | SHIB/USDT
However, such drastic reductions in large transactions have historically preceded notable price recoveries.
A sharp drop in whale trading activity can often signal a redistribution phase, where retail traders accumulate supply at lower levels before a major upward breakout.
If SHIB’s average transaction size stabilizes or begins to recover, it could indicate fresh capital inflows, potentially fueling a rally toward the $0.000018 resistance zone in the coming weeks.
Furthermore, with meme coin speculation remaining strong following the DOGE ETF acknowledgment, SHIB could see renewed bullish interest. A resurgence in whale demand, combined with improving technical indicators, could provide the necessary catalyst for a breakout from its current tight range.
Shiba Inu Price Forecast: SHIB struggles below key EMAs as bears eye $0.000015 breakdown
Shiba Inu (SHIB) remains under pressure, trading around $0.00001595 as bearish momentum lingers.
The 50-day Exponential Moving Average (EMA) at $0.00001682 and the 100-day EMA at $0.00001889 have acted as key resistance, preventing SHIB from staging a meaningful recovery. Until bulls reclaim these levels, the downside risks remain elevated.
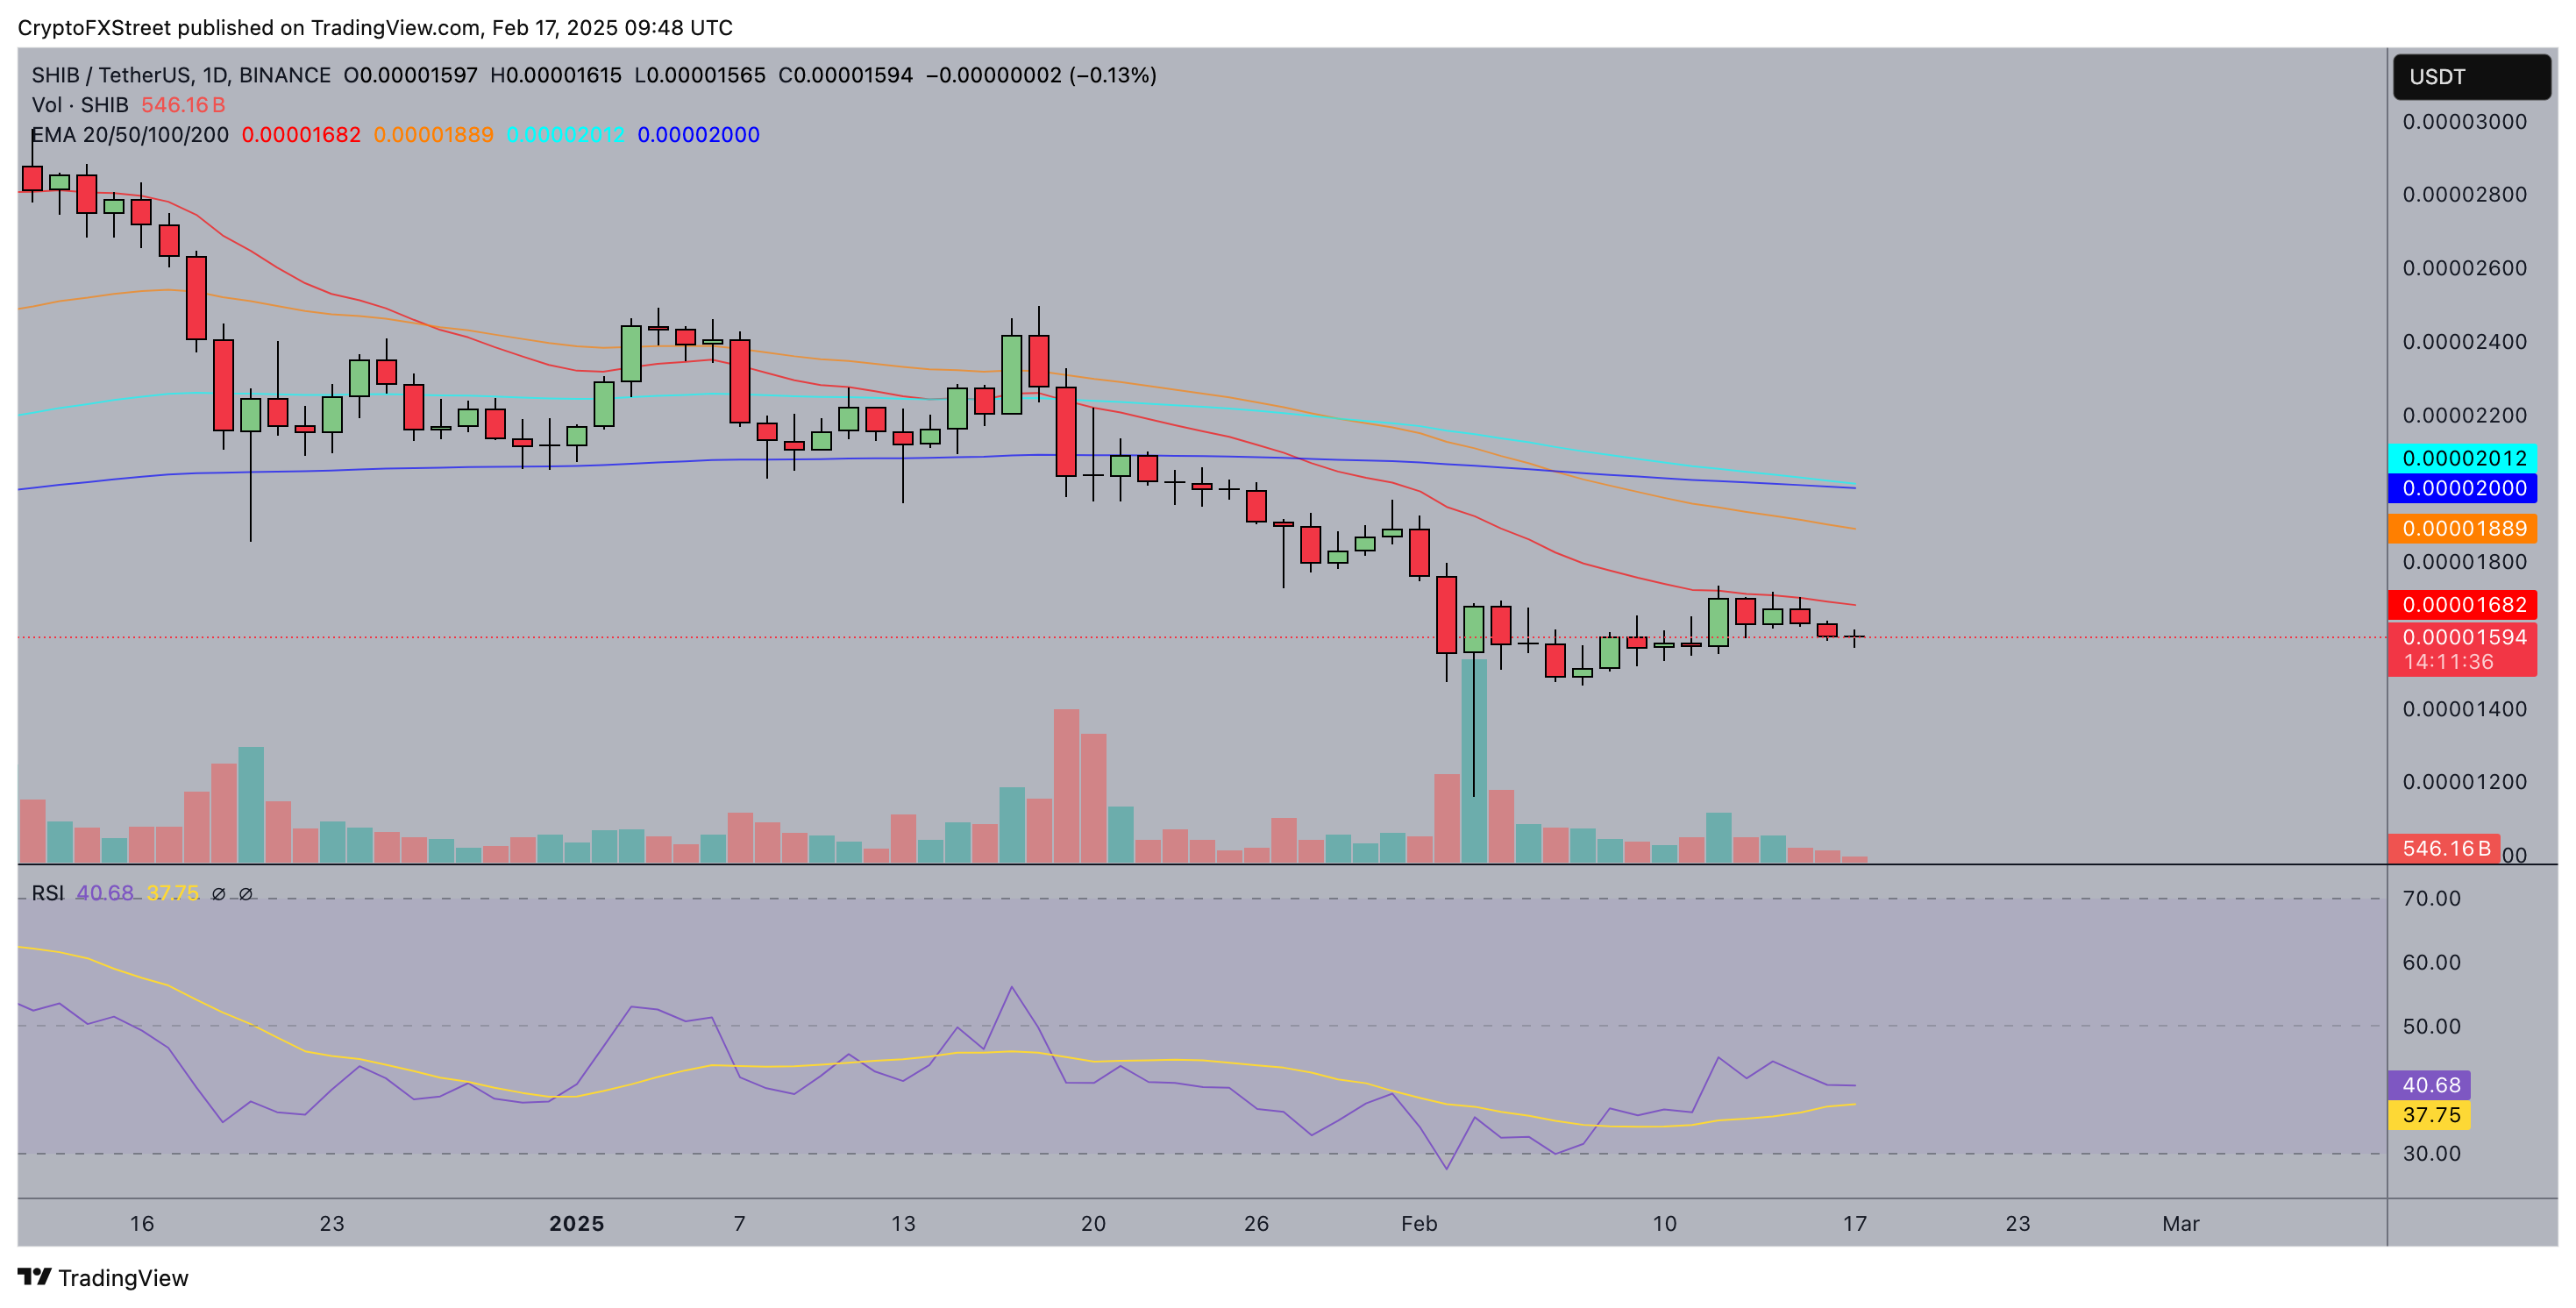
Shiba Inu (SHIB) price forecast
The Relative Strength Index (RSI) momentum indicator in the daily chart currently hovers at 40.73, signaling weakening buying interest.
A sustained drop below 37 could push SHIB deeper into oversold territory, potentially triggering further declines. The declining trading volume further underscores the lack of bullish conviction, reinforcing the likelihood of a retest of the $0.000015 support zone.
On the bullish side, SHIB has found consistent buying interest near $0.000015, preventing a sharper decline.
If bulls defend this level and push SHIB above $0.00001682, a relief rally toward the $0.000018 resistance level could emerge.
However, with momentum indicators skewed to the downside and large whale transactions declining, SHIB remains vulnerable to further losses unless buyers step in decisively.
추천 기사


