


Bitcoin and Gold Outlook: BTC slips, XAU downtrend persists as US Services PMI misses forecasts
- Bitcoin slides below $86,000 and broadly consolidates between support at $84,000 and supply at $88,000.
- Gold commences the week under selling pressure, with the price falling toward $4,100 amid a weakening technical structure.
- The US ISM Services PMI slipped to 54.9 in September, missing forecasts and highlighting a slight drop in sectoral growth.
Bitcoin (BTC) faces growing headwinds on Monday, as it trades lower below $86,000. Despite the ongoing pullback, the Crypto King remains in a broad range with the lower limit near $84,000 and the upper limit at $88,000. A break on either side of this zone would influence BTC's direction.
Gold (XAU/USD), meanwhile, retains a dominant bearish outlook as price action continues downward toward $4,100. The path of least resistance remains downward, aligning with the prevailing weak momentum indicators.
A fresh rebound could ensue as buyers reengage near the pivotal $4,000. Still, traders should temper expectations, as a recovery is likely to be an uphill task given the clustered moving-average resistance between roughly $4,300 and $4,330.
US ISM Services PMI declines to 54.9 in September
The United States (US) Institute for Supply Management (ISM) report released on Monday showed Services PMI weakening to 54.9 in September, below market forecasts of 55 and the previous month’s reading of 55.4. This decline underscores a modest loss of growth momentum within the services sector.
Inflationary pressures intensified as the Prices Paid Index climbed to 74 from 72.6. Labor market conditions improved modestly, with the Employment Index rising to 50.1 from 47.8. However, momentum in new business softened, as the New Orders Index fell to 59.8 from 60.9.
Focus shifts to FOMC Minutes and inflation data
The Services PMI comes ahead of the Federal Open Market Committee (FOMC) Minutes on Wednesday, where investors will be watching for interest rate path insights, the central bank’s discussions regarding sticky inflation risks and a deeper look into the committee’s reasons behind September’s 25 basis point hike. Inflation in the world’s largest economy remains above the 2% long-term target.
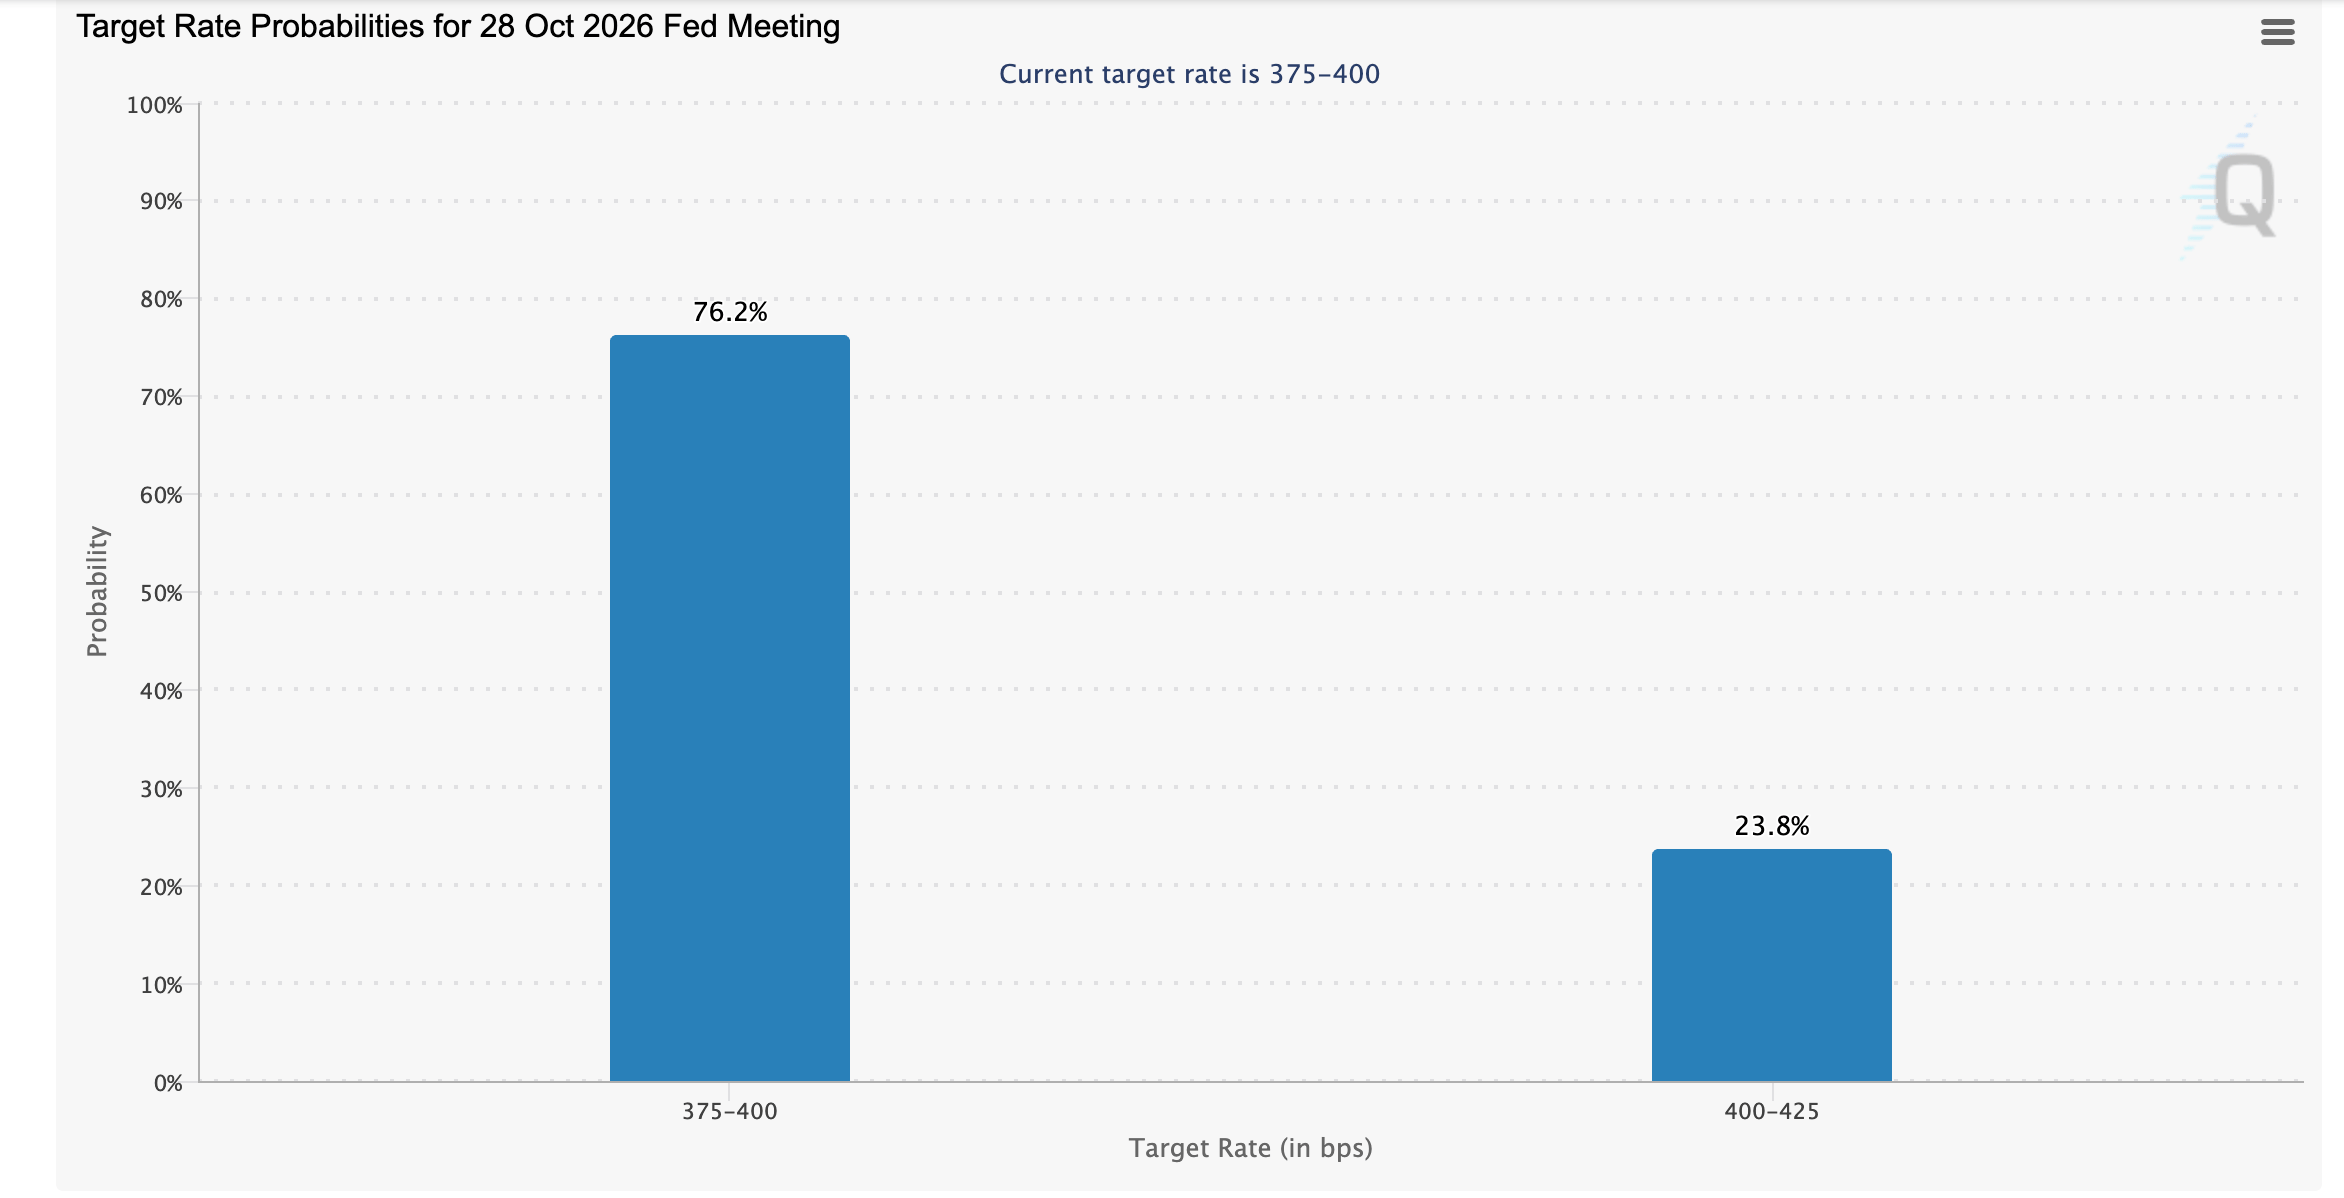
Next week, the Bureau of Labor Statistics (BLS) is expected to release the Consumer Price Index (CPI). This important inflation gauge could provide more insight into the Federal Reserve’s (Fed) monetary policy direction ahead of October’s FOMC meeting. The odds of an October rate hike have eased to nearly 24%, according to CME Group's FedWatch tool. This means that market participants are broadly pricing a higher chance of the Fed leaving interest rates unchanged in the 3.75%-4.00% range.
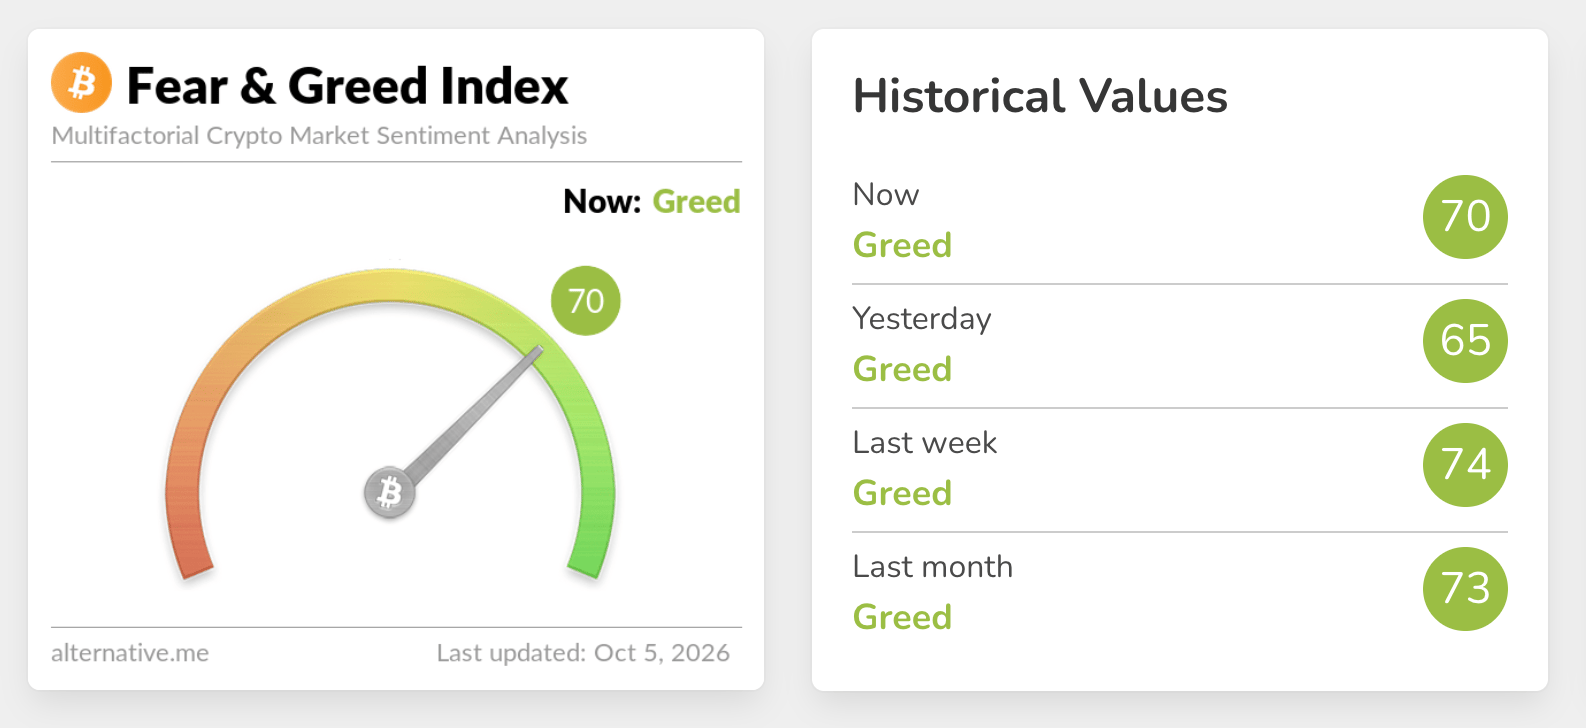
That said, interest in crypto assets remains elevated, as reflected in the Fear & Greed Index, holding at 70 in the Greed territory on Monday, up from 65 the day before. Steady risk-on sentiment has positively influenced the market’s overall outlook. Moreover, capital inflows into spot BTC Exchange-Traded Funds (ETFs) logged the second-strongest week at $241 million through Friday and $2.4 billion in the week ending September 25.
Technical analysis: Bitcoin slides as headwinds return
Bitcoin trades at $85,606, extending its pullback from recent highs above $86,000. Despite the correction, BTC holds well above the key Exponential Moving Averages, which keeps the near-term bias bullish. The Relative Strength Index (RSI) at 64 leans bullish without being overbought, though the Moving Average Convergence Divergence (MACD) remains slightly below zero, hinting that upside momentum is constructive but not yet explosive.
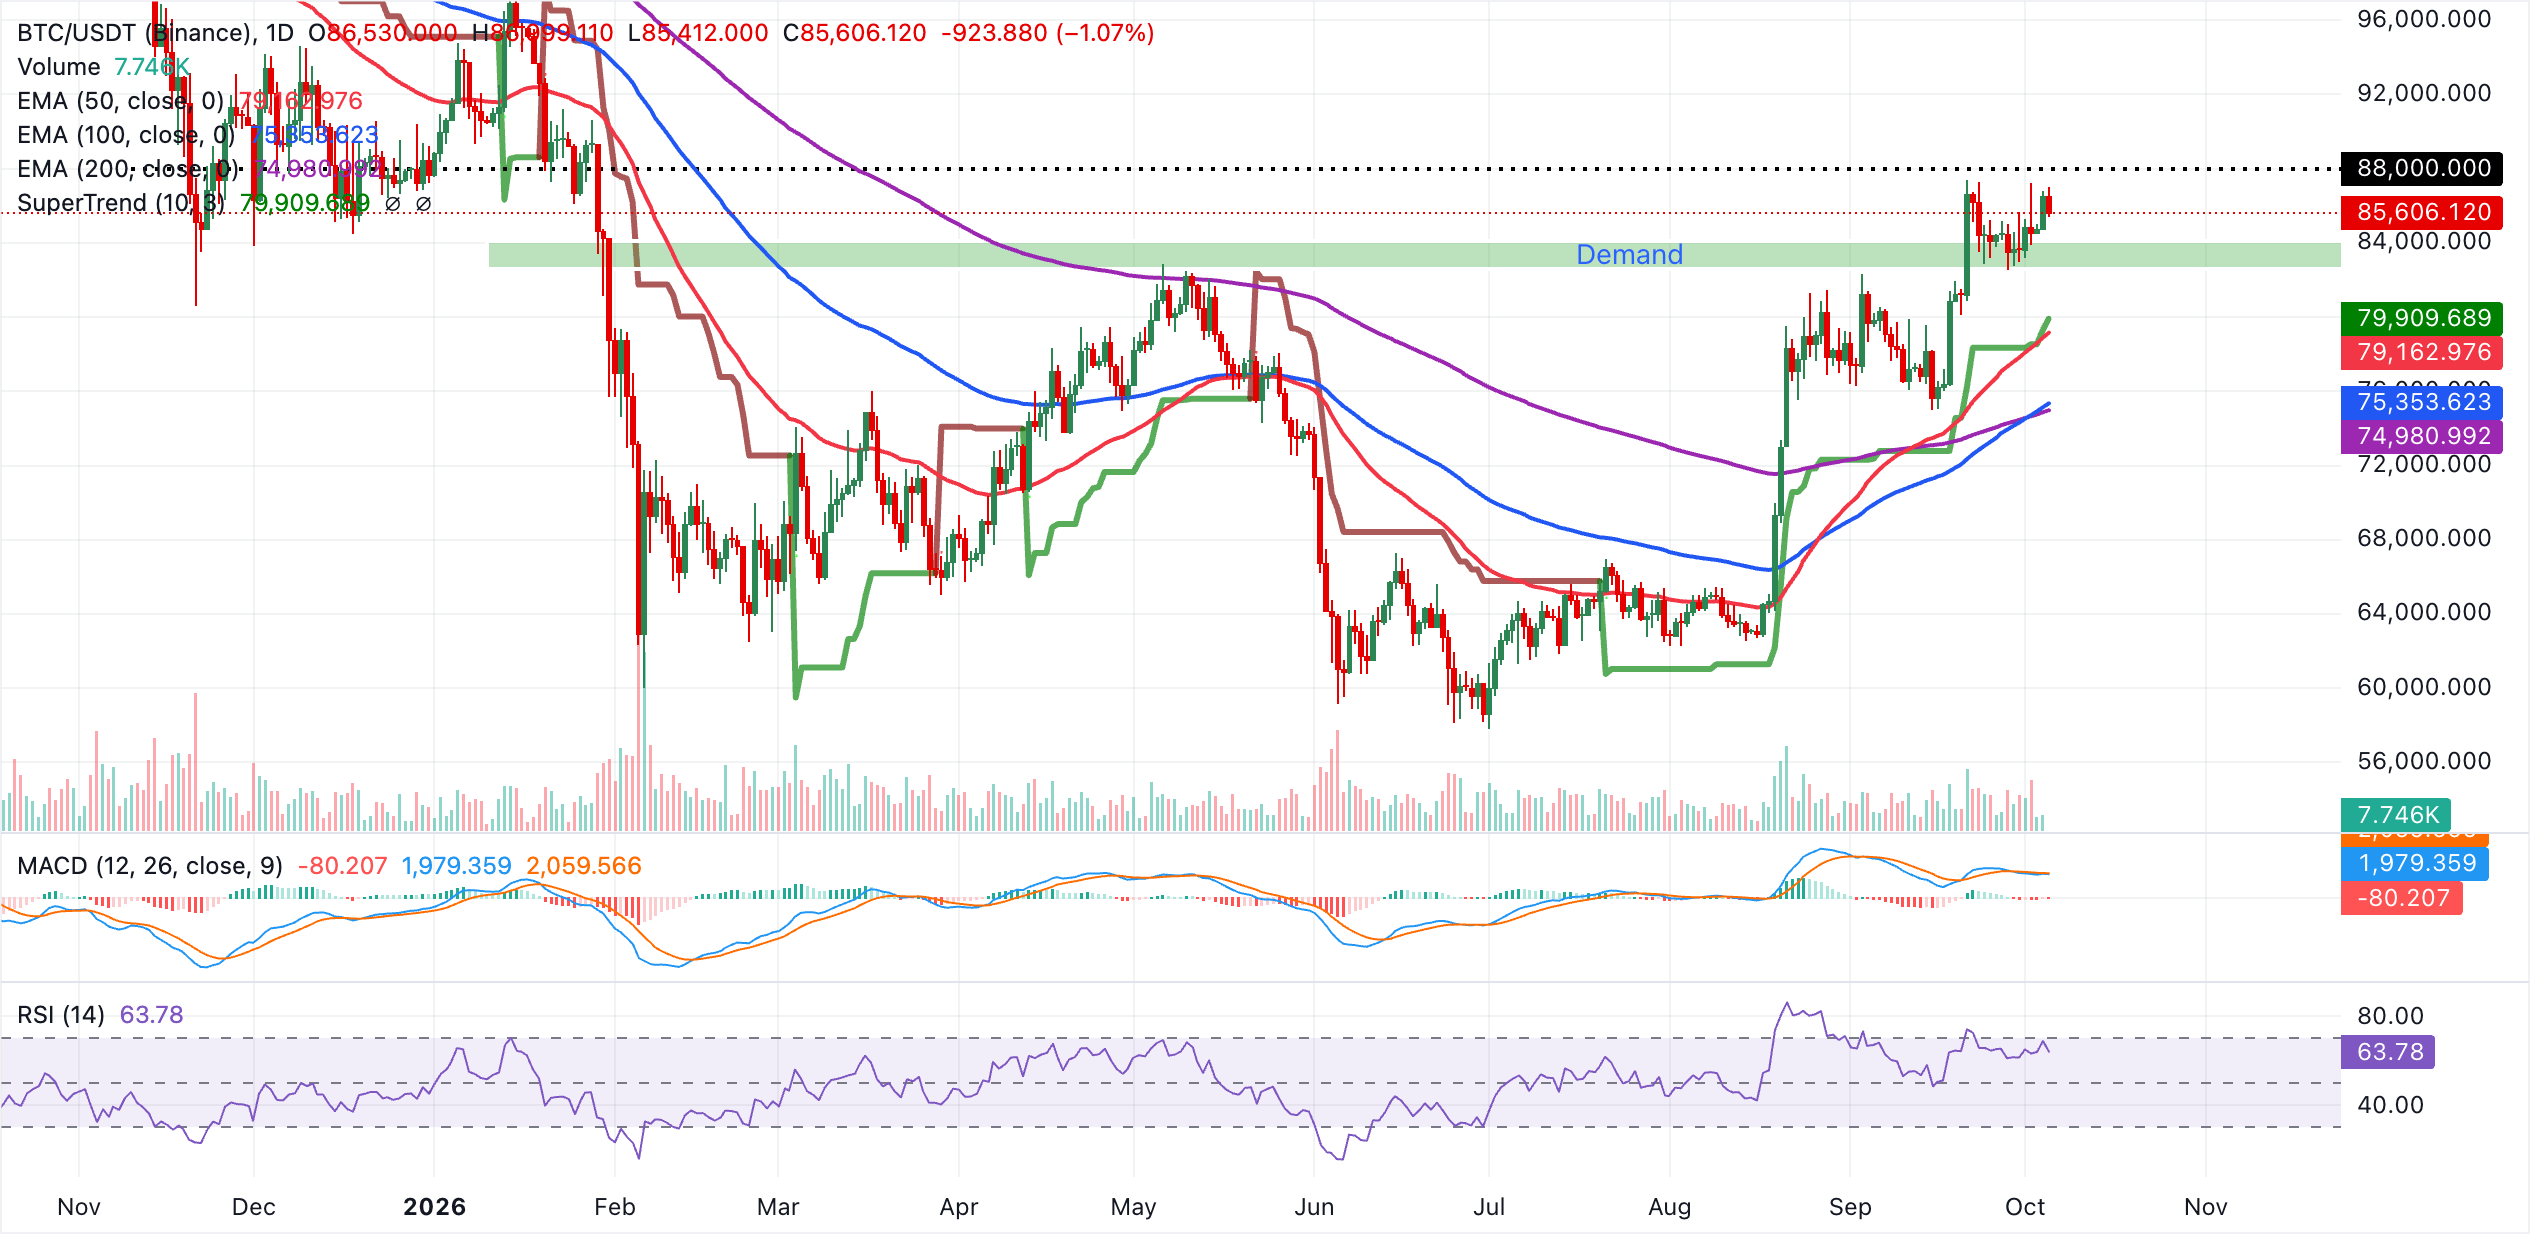
Immediate support lies at the SuperTrend marker at $79,910, closely aligned with the 50-day EMA at $79,163, forming a first cluster expected to attract buyers on pullbacks. Deeper support emerges at the 100-day EMA at $75,354 and the 200-day EMA at $74,980, where a stronger floor for the broader uptrend lies. The technical structure favors further consolidation or gains rather than a sustained reversal.
Gold technical analysis: XAU/USD bearish outlook persists
Gold trades at $4,137, extending a bearish tone as price holds below the key moving averages and the active SuperTrend line. The spot price is capped first by the descending trendline resistance at $4,204, with the 50-day EMA at $4,297 and the 200-day EMA at $4,311 reinforcing the overhead supply zone, while the 100-day EMA at $4,334 and the SuperTrend signal at $4,405 mark higher layers of resistance.
Momentum remains soft, as the MACD stays below zero with negative readings and the RSI at 38, suggesting lingering downside pressure rather than an imminent bullish reversal.
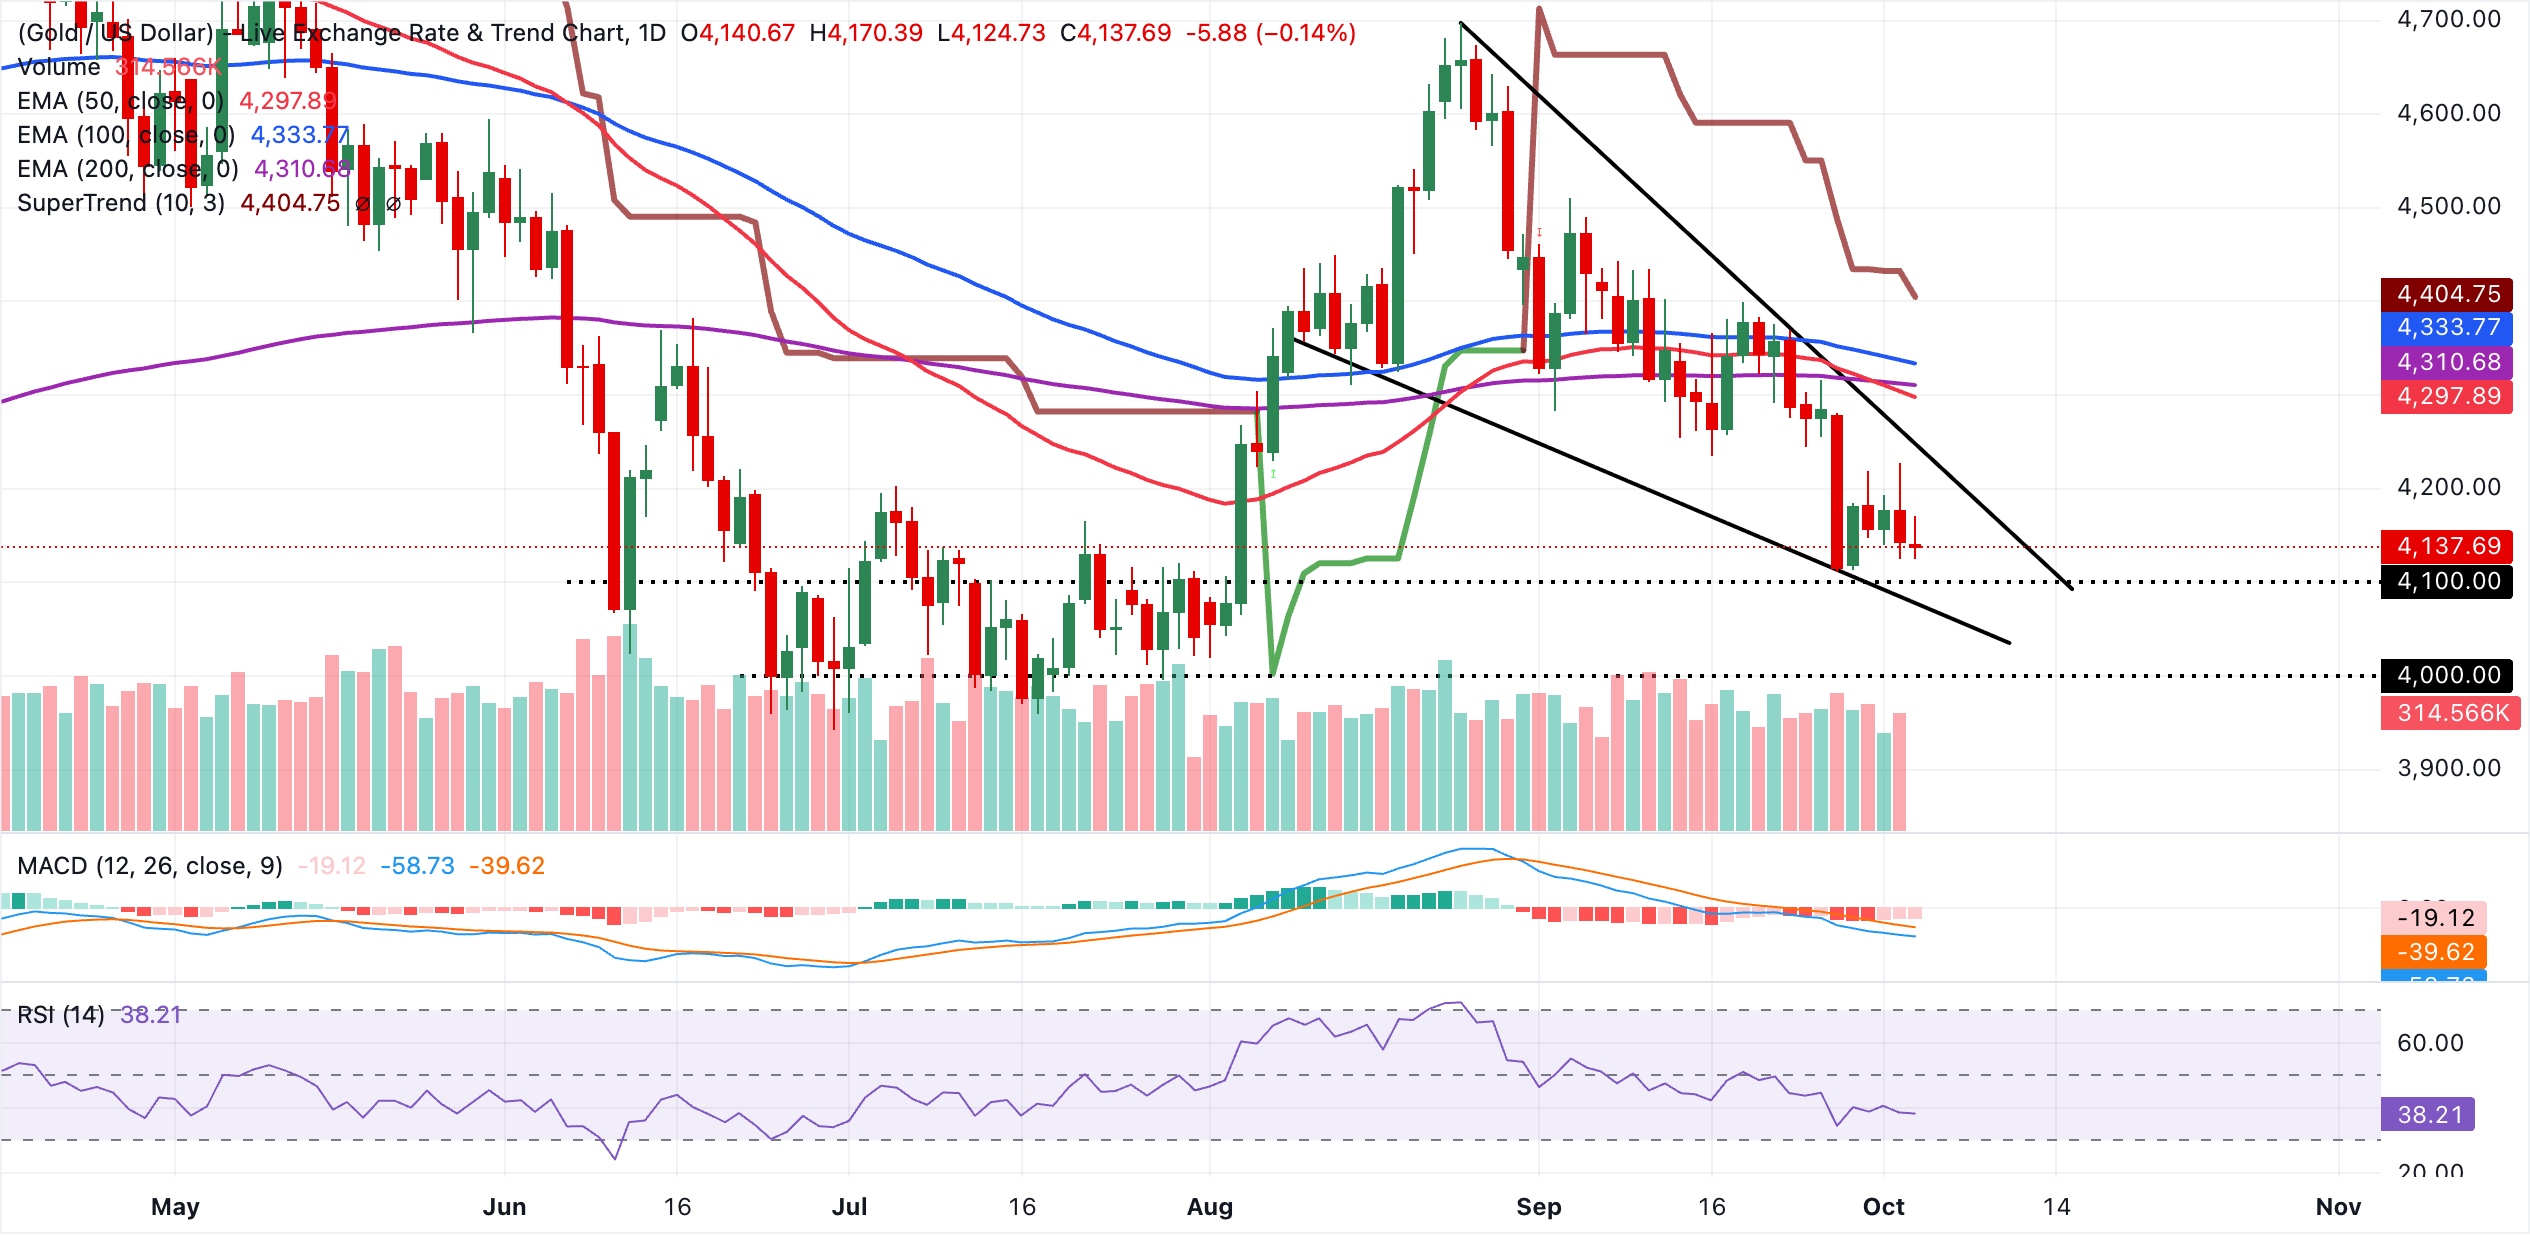
Immediate resistance lies at the broken trendline near $4,204, followed by a dense moving-average cluster between the 50-day EMA at approximately $4,298 and the 200-day and 100-day EMAs at $4,311 and $4,334, respectively. A sustained recovery above this band would be needed to alleviate the current bearish bias.
Further up, the SuperTrend line around $4,405 represents a stronger hurdle that, if reclaimed, would hint at a more durable shift in sentiment. With no clear structural support levels defined on the daily chart, traders may look to recent price lows at $4,100 and the psychological level at $4,000 for reference. The subdued MACD and sub-50 RSI readings suggest rallies toward the mentioned resistance levels could attract near-term selling interest.
(The technical analysis of this story was written with the help of an AI tool. Know more.)
Bitcoin, altcoins, stablecoins FAQs
Bitcoin is the largest cryptocurrency by market capitalization, a virtual currency designed to serve as money. This form of payment cannot be controlled by any one person, group, or entity, which eliminates the need for third-party participation during financial transactions.
Altcoins are any cryptocurrency apart from Bitcoin, but some also regard Ethereum as a non-altcoin because it is from these two cryptocurrencies that forking happens. If this is true, then Litecoin is the first altcoin, forked from the Bitcoin protocol and, therefore, an “improved” version of it.
Stablecoins are cryptocurrencies designed to have a stable price, with their value backed by a reserve of the asset it represents. To achieve this, the value of any one stablecoin is pegged to a commodity or financial instrument, such as the US Dollar (USD), with its supply regulated by an algorithm or demand. The main goal of stablecoins is to provide an on/off-ramp for investors willing to trade and invest in cryptocurrencies. Stablecoins also allow investors to store value since cryptocurrencies, in general, are subject to volatility.
Bitcoin dominance is the ratio of Bitcoin's market capitalization to the total market capitalization of all cryptocurrencies combined. It provides a clear picture of Bitcoin’s interest among investors. A high BTC dominance typically happens before and during a bull run, in which investors resort to investing in relatively stable and high market capitalization cryptocurrency like Bitcoin. A drop in BTC dominance usually means that investors are moving their capital and/or profits to altcoins in a quest for higher returns, which usually triggers an explosion of altcoin rallies.
추천 기사


