


Gold vs Bitcoin Price Prediction: Breakout momentum builds on Strait of Hormuz deal hopes
- US President Trump says “progress has been made” in talks to reopen the Strait of Hormuz.
- Gold rises by more than 4% to trade near $4,250 on Wednesday, backed by easing geopolitical tensions.
- Bitcoin eyes a short-term breakout toward the resistance at $65,000, supported by strengthening momentum indicators.
Gold (XAU/USD) is accelerating its rebound near $4,250 at the time of writing on Wednesday amid easing geopolitical tensions after United States (US) President Donald Trump said that a deal to reopen the Strait of Hormuz was imminent. Bitcoin (BTC) mirrors the metal’s near-term bullish bias, edging higher toward the resistance at $65,000.
Trump eyes reopening of the Strait of Hormuz
President Trump told reporters on Tuesday that “a lot of progress had been made” in the discussions of reopening the Strait of Hormuz, and intimated that an announcement could be made as soon as Wednesday.
Moreover, a CNN report states that a senior Gulf official said that there is a “50-50” chance that Iran could reach a deal amid the ongoing strategic talks with Oman on reopening the waterway.
Despite Trump’s optimism, Iranian state media said earlier this week that any agreement with Oman over the Strait of Hormuz has “no connection” to its reopening.
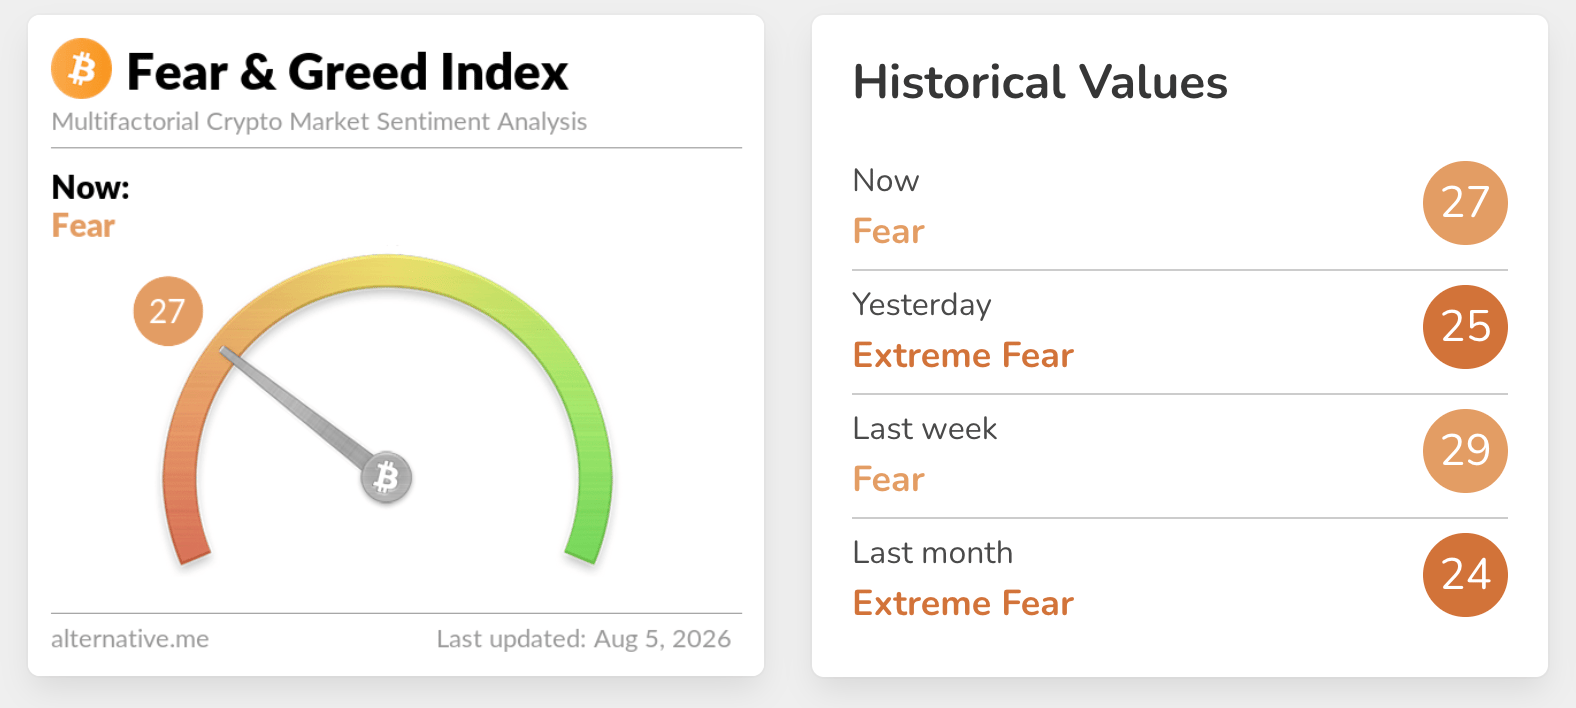
Meanwhile, appetite for risk assets appears to be improving albeit gradually, as reflected in the crypto Fear & Greed Index, which is embedded in Fear territory at 28 on Wednesday, up from 25 in the Extreme Fear region the day before. A sustained recovery could ensue should investors increase risk exposure, absorbing selling pressure.
Technical analysis: Bitcoin bulls gain ground
Bitcoin trades around $64,540, keeping a mildly bearish near-term bias as it holds inside a downward parallel channel and below a dense layer of exponential moving averages (EMAs). The spot price also holds just above the channel’s upper boundary near $64,405, which now acts as immediate support, but remains capped by the 50-day EMA at $64,659, with the 100-day EMA at $67,096 reinforcing broader downside pressure overhead.
The Relative Strength Index (RSI) around 53 on the daily chart hints at neutral-to-slightly positive momentum, while the Moving Average Convergence Divergence (MACD) remains in negative territory, suggesting that any rebounds are still occurring within a corrective, capped structure.
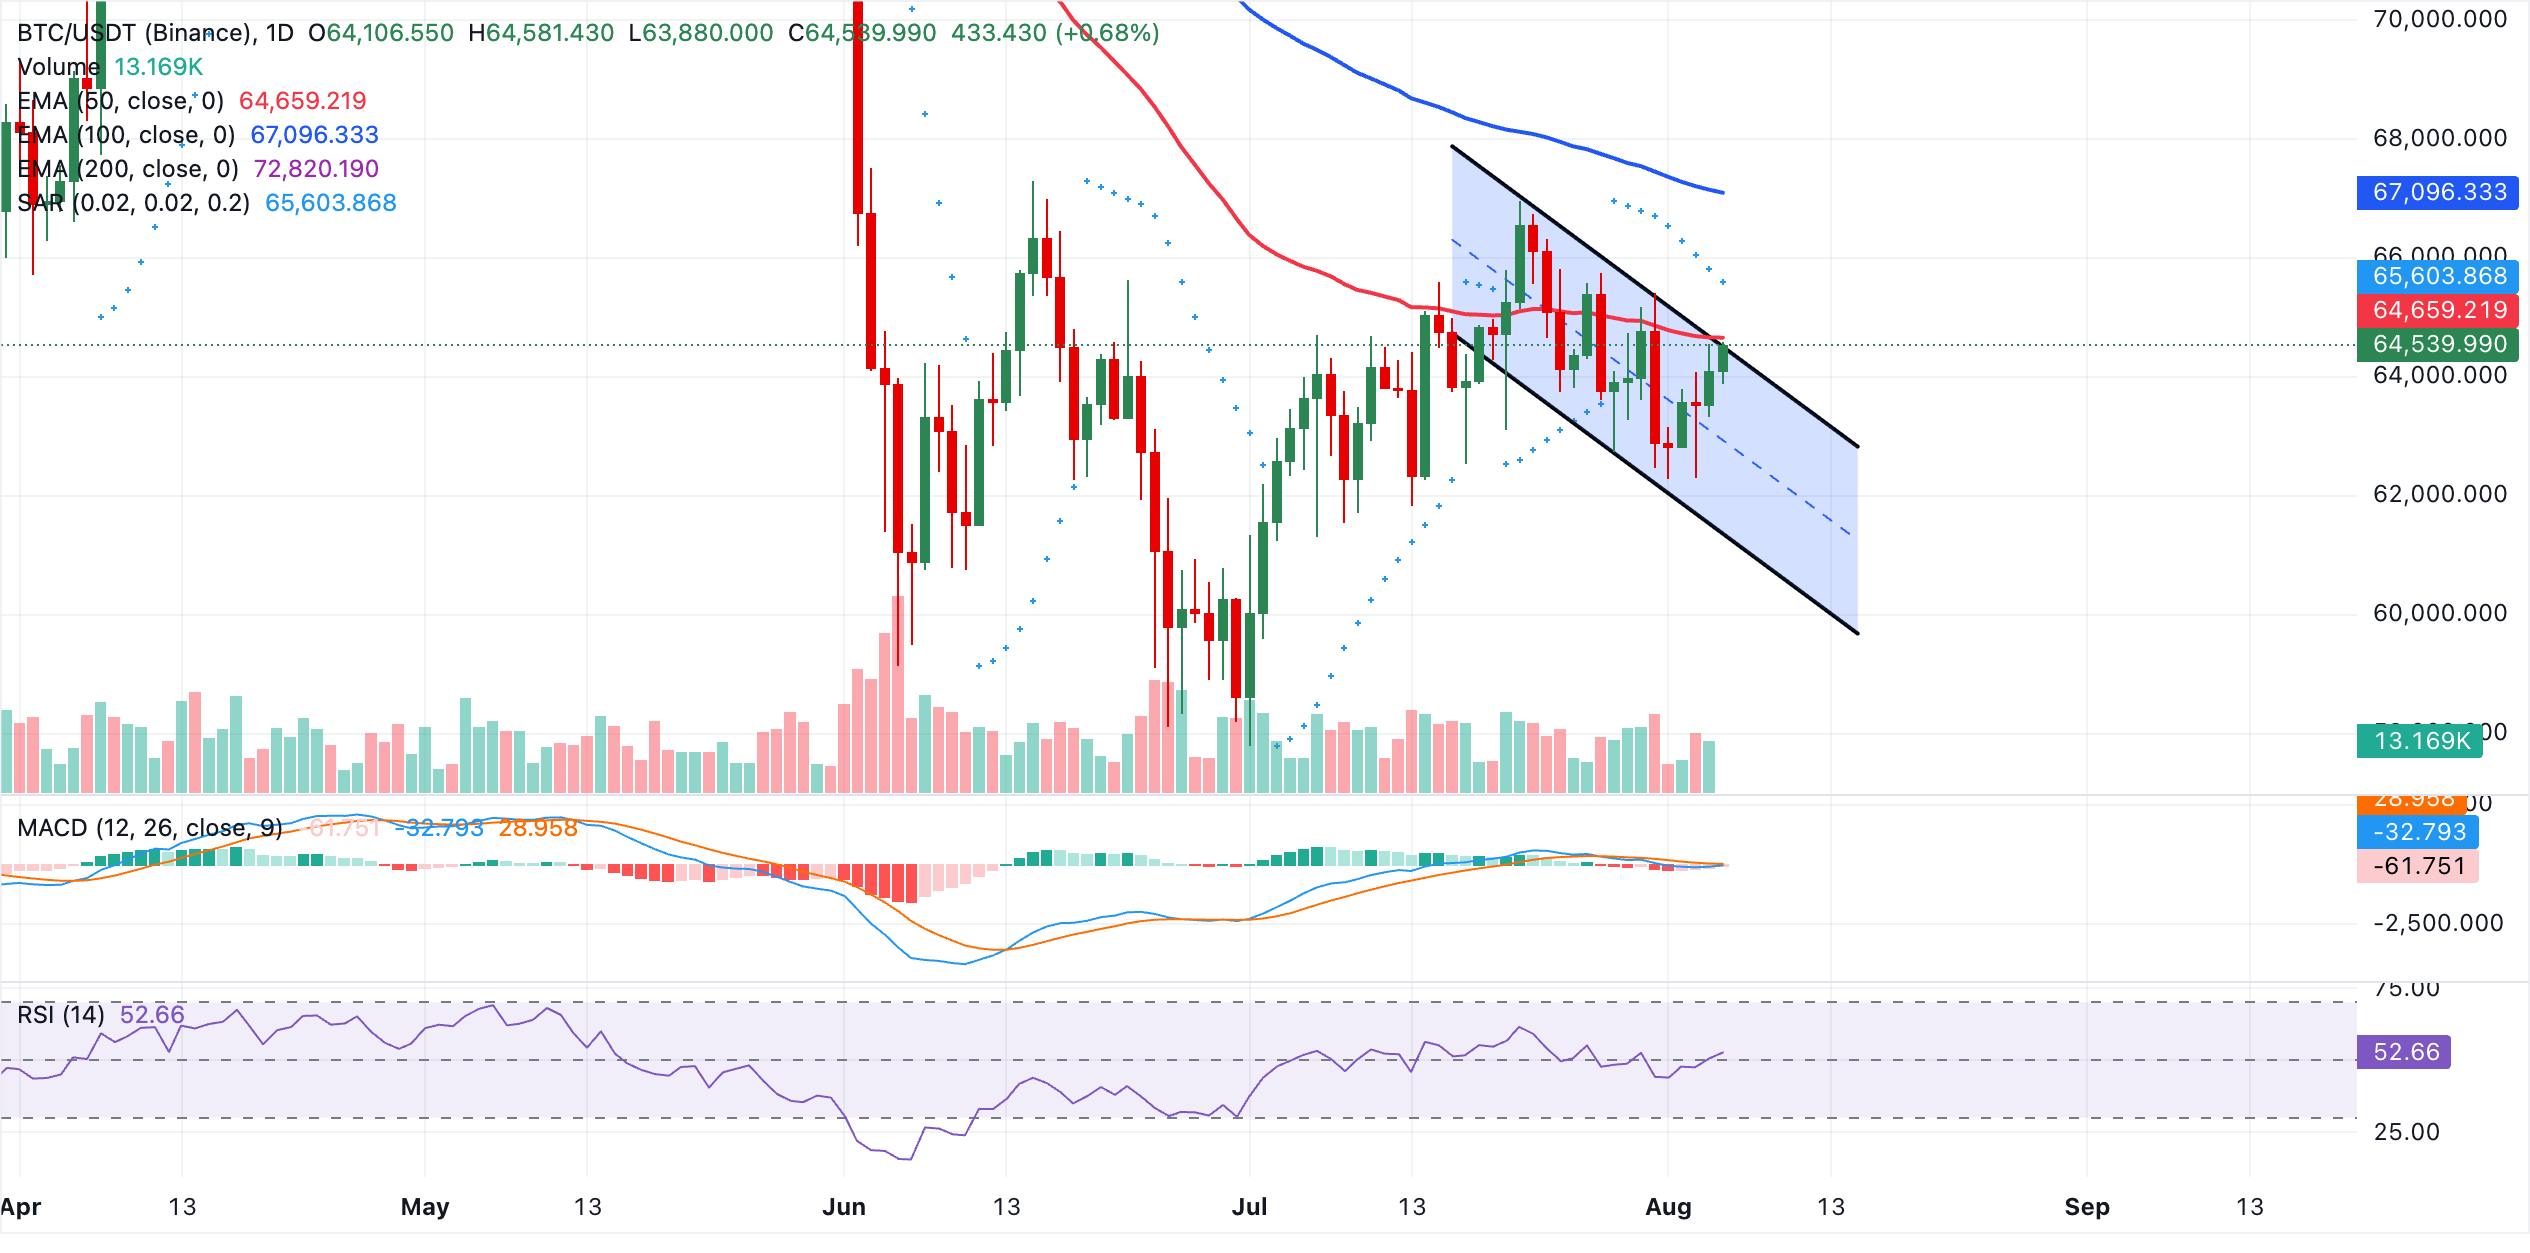
The first resistance is the 50-day EMA at $64,659, followed by the Parabolic SAR signal near $65,604, where selling interest could intensify if price extends higher, before the more distant 100-day EMA at $67,096 defines the broader bearish cap. On the downside, initial support lies at the upper boundary of the descending channel around $64,405, with the channel floor near $61,262 as the next key downside objective should sellers regain control.
Technical outlook: Gold extends recovery
Gold trades around $4,256, holding above the 50-day EMA at $4,187 but still capped beneath the 200-day EMA at $4,279 and the 100-day EMA at $4,316, which keeps the broader outlook only cautiously constructive.
The break and subsequent hold above the former downward-resistance trendline, whose key break price sits near $4,000, hints at an improving structure, while the MACD has turned firmly positive and the RSI at 61 shows strengthening bullish momentum rather than overbought conditions.
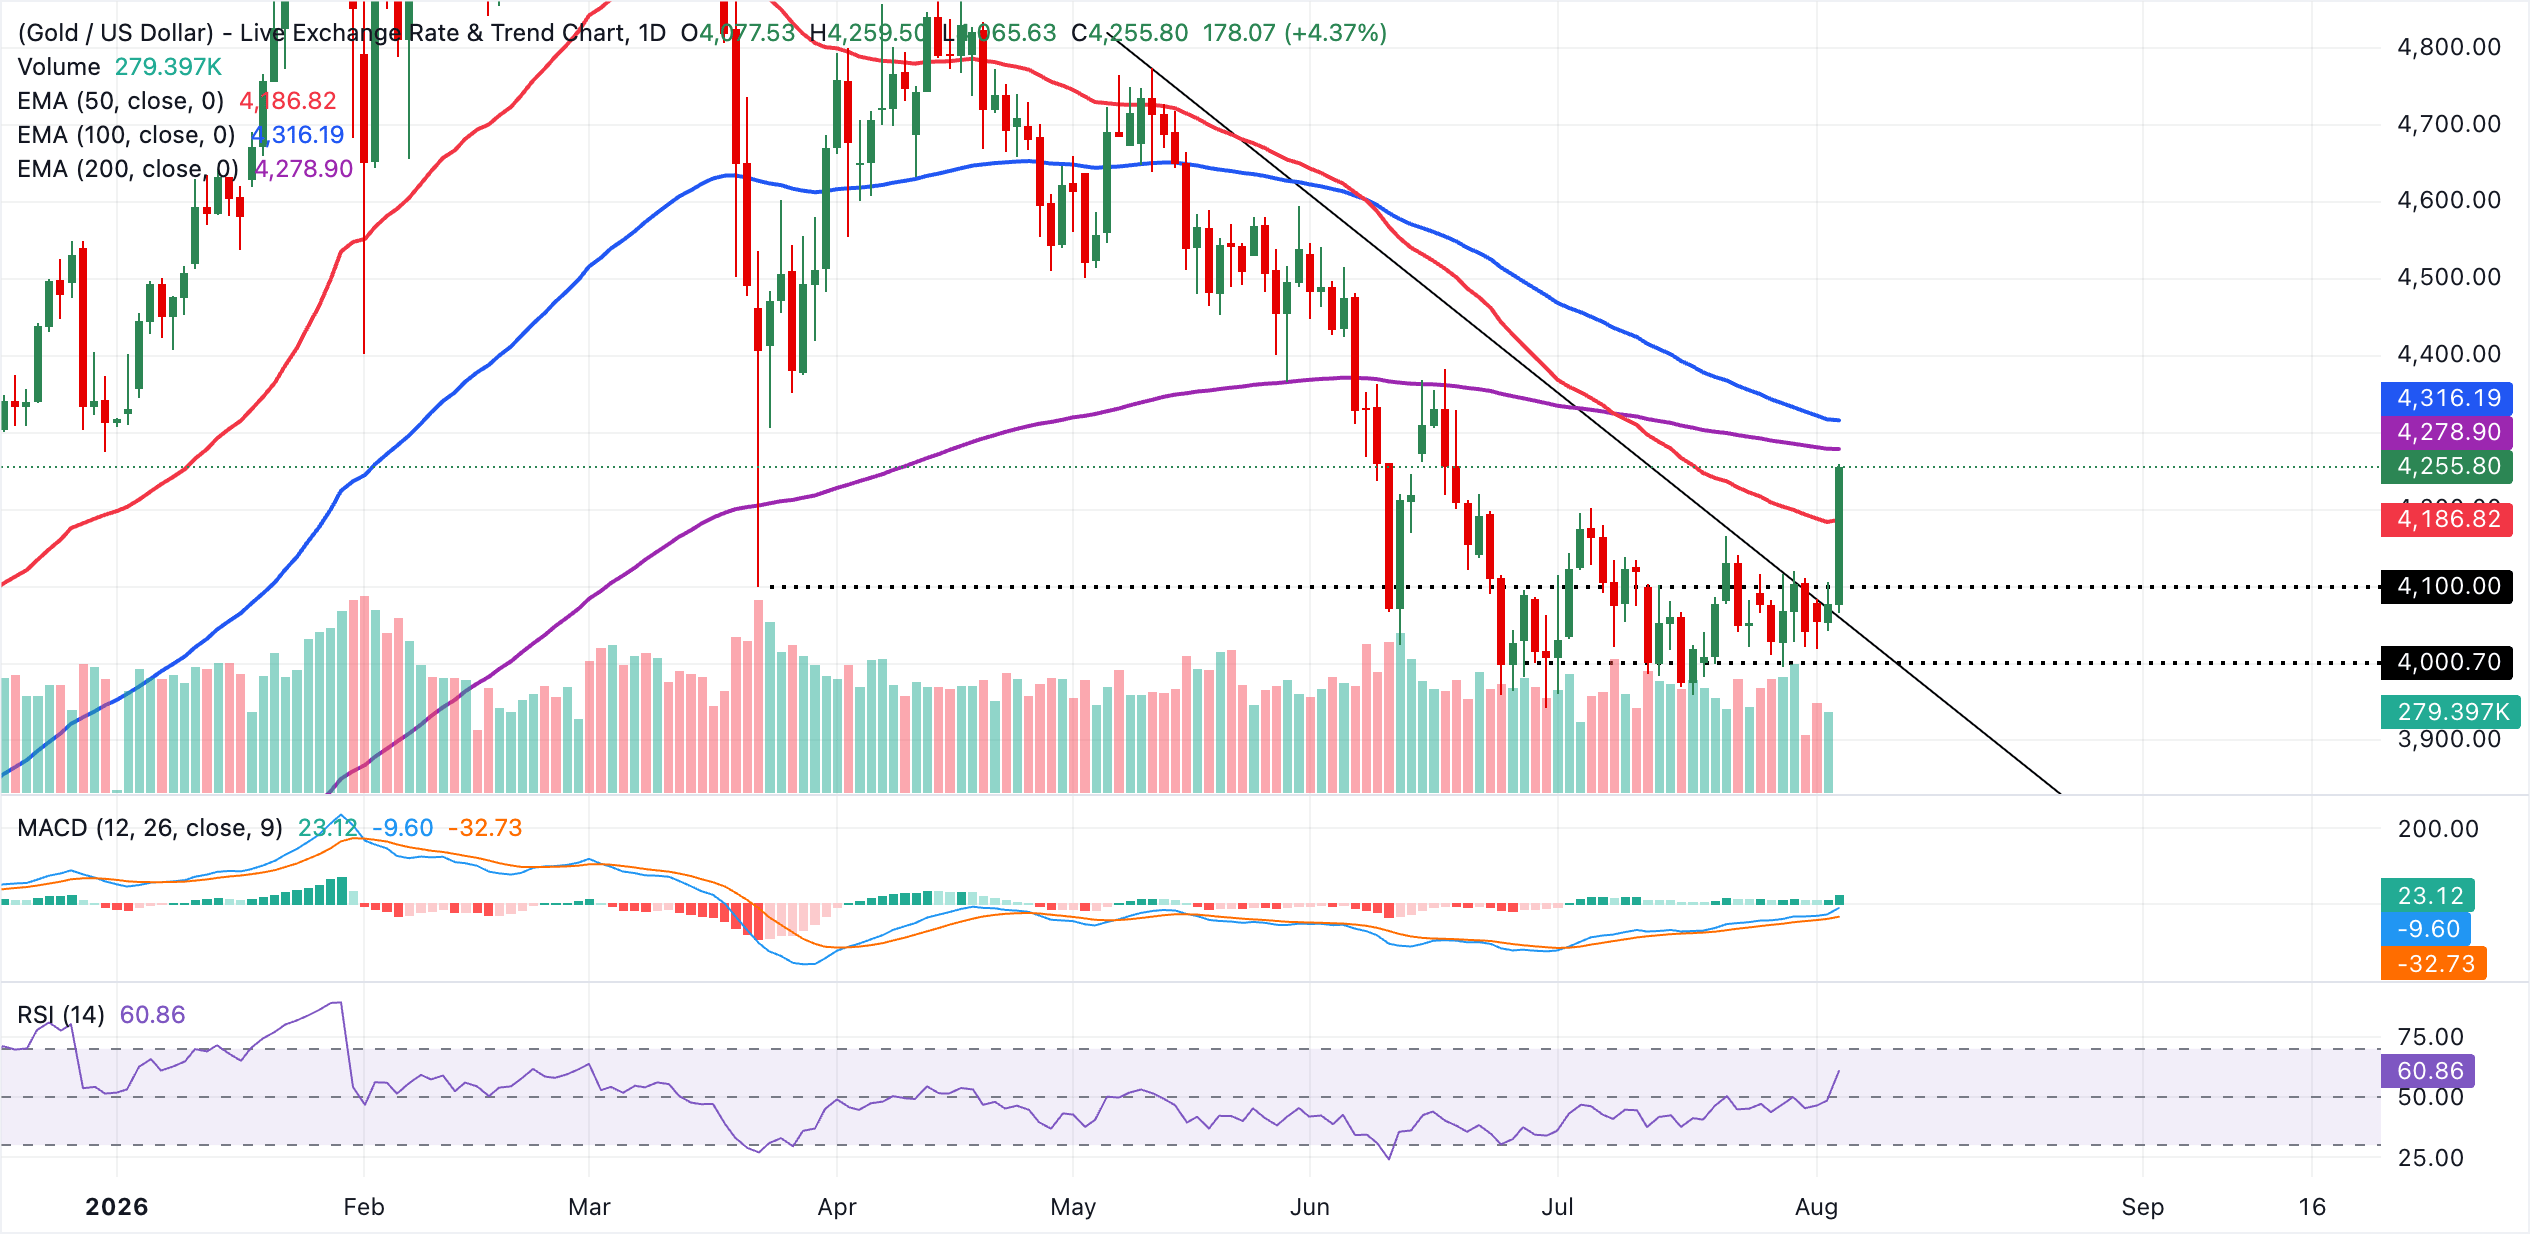
Immediate resistance lies at the 200-day EMA around $4,279, with a subsequent barrier at the 100-day EMA near $4,316. A daily close above this capped area would likely open the door to a more decisive bullish phase. On the downside, initial support is seen at the current price area as an immediate pivot, followed by the 50-day EMA at $4,187, while the broken descending trendline around $4,000 stands as a deeper structural floor if a corrective pullback develops.
(The technical analysis of this story was written with the help of an AI tool. Know more.)
Bitcoin, altcoins, stablecoins FAQs
Bitcoin is the largest cryptocurrency by market capitalization, a virtual currency designed to serve as money. This form of payment cannot be controlled by any one person, group, or entity, which eliminates the need for third-party participation during financial transactions.
Altcoins are any cryptocurrency apart from Bitcoin, but some also regard Ethereum as a non-altcoin because it is from these two cryptocurrencies that forking happens. If this is true, then Litecoin is the first altcoin, forked from the Bitcoin protocol and, therefore, an “improved” version of it.
Stablecoins are cryptocurrencies designed to have a stable price, with their value backed by a reserve of the asset it represents. To achieve this, the value of any one stablecoin is pegged to a commodity or financial instrument, such as the US Dollar (USD), with its supply regulated by an algorithm or demand. The main goal of stablecoins is to provide an on/off-ramp for investors willing to trade and invest in cryptocurrencies. Stablecoins also allow investors to store value since cryptocurrencies, in general, are subject to volatility.
Bitcoin dominance is the ratio of Bitcoin's market capitalization to the total market capitalization of all cryptocurrencies combined. It provides a clear picture of Bitcoin’s interest among investors. A high BTC dominance typically happens before and during a bull run, in which investors resort to investing in relatively stable and high market capitalization cryptocurrency like Bitcoin. A drop in BTC dominance usually means that investors are moving their capital and/or profits to altcoins in a quest for higher returns, which usually triggers an explosion of altcoin rallies.
추천 기사


