

Dow Jones Industrial Average looks for recovery after last week’s confidence splashdown
- The Dow Jones shifted higher on Monday, trimming recent losses.
- Equities recovery remains limited as tech stocks trade blows.
- US inflation data due later this week looms large on the horizon.
The Dow Jones Industrial Average (DJIA) recovered some ground on Monday, climbing some 300 points and change at its peak in an effort to claw back some of last week’s losses sparked by an unexpected downturn in consumer confidence figures. Markets are kicking off the new trading week with a bullish tilt, but gains remain limited as tensions hold on the high end and investors remain overall uneasy on multiple fronts.
Consumer sentiment figures from February raised some alarms last week, and now investors will be pivoting to key earnings figures this week from consumer building suppliers Home Depot (HD) and Lowe’s (LOW) to help gauge consumers' spending health. US Personal Consumption Expenditure (PCE) inflation figures due later this week will draw plenty of investor focus as traders hope for signs that January’s uptick in Consumer Price Index (CPI) and Producer Price Index (PPI) inflation, which both came in higher than expected, was just a flash in the pan and not a sign of a new resurgence of inflation pressures.
Dow Jones news
Despite some mixed investor sentiment, most of the Dow Jones is holding on the high side, with over two-thirds of the index’s listed securities gaining ground on Monday. Microsoft (MSFT) is down a full percentage point, falling to $404 per share as the company cuts its spending plans on data centers, reigniting even more fears that the AI trade may be coming to an end.
Dow Jones price forecast
The Dow Jones may be recovering from last week’s last-minute bearish plunge, but the major equity index is still mired in bear country. Price action is stuck on the low side of the 50-day Exponential Moving Average (EMA) near 43,930, and bidders are struggling to develop meaningful legs from their new swing low point.
The Dow Jones shed around 2.75% in a two-day losing streak that took bids from 44,575 to 43,345, but further downside losses are looking unlikely as markets claw back from four-week lows. Price action remains well-supported above the long-term 200-day EMA approaching 42,000.
Dow Jones daily chart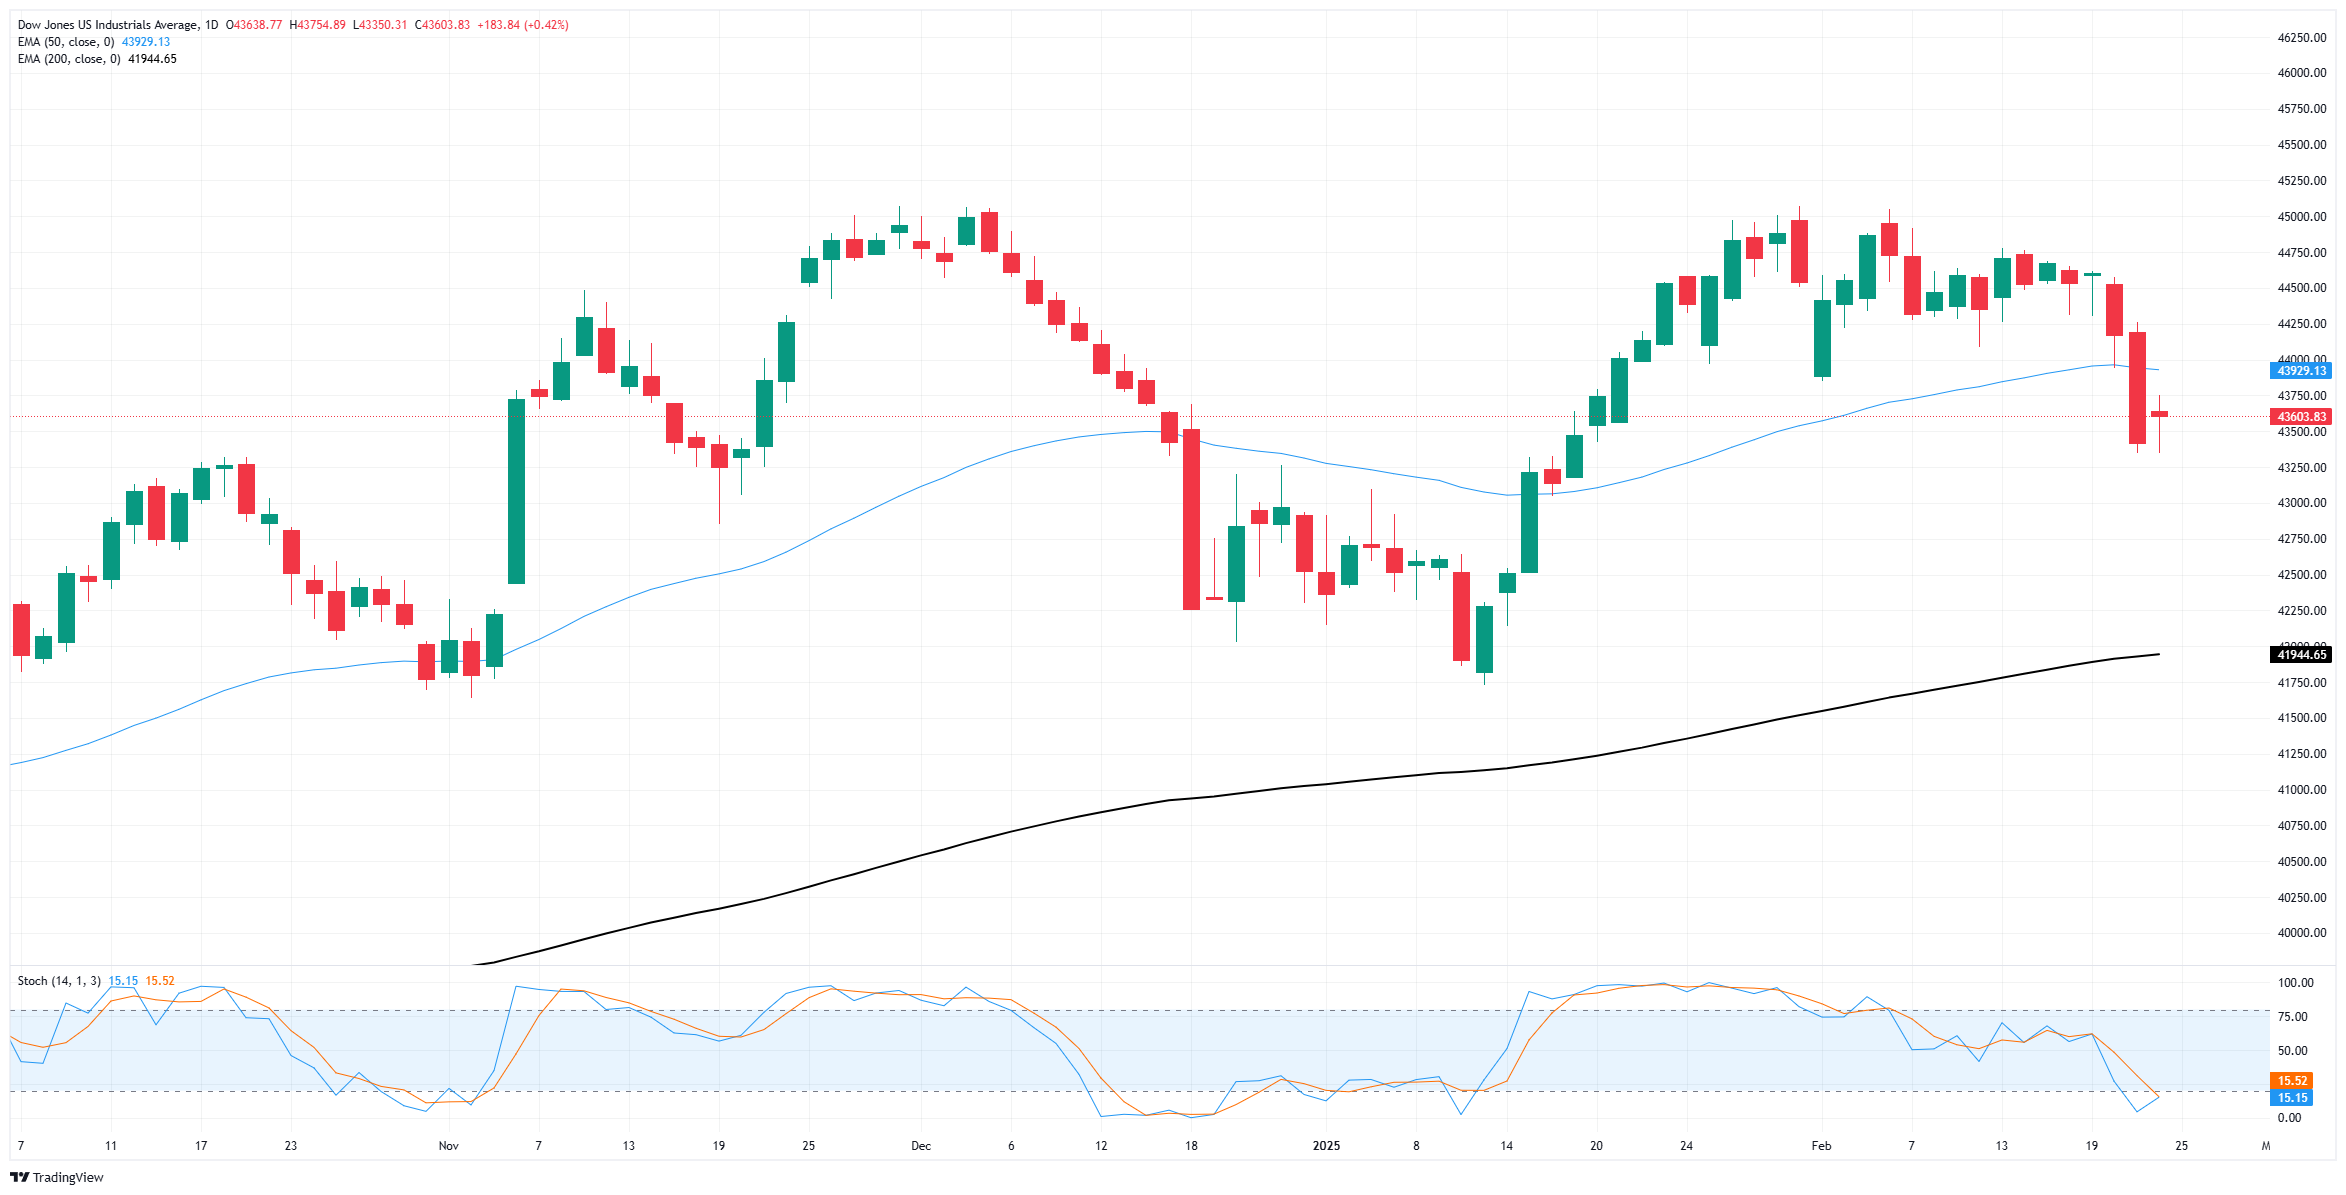
Dow Jones FAQs
The Dow Jones Industrial Average, one of the oldest stock market indices in the world, is compiled of the 30 most traded stocks in the US. The index is price-weighted rather than weighted by capitalization. It is calculated by summing the prices of the constituent stocks and dividing them by a factor, currently 0.152. The index was founded by Charles Dow, who also founded the Wall Street Journal. In later years it has been criticized for not being broadly representative enough because it only tracks 30 conglomerates, unlike broader indices such as the S&P 500.
Many different factors drive the Dow Jones Industrial Average (DJIA). The aggregate performance of the component companies revealed in quarterly company earnings reports is the main one. US and global macroeconomic data also contributes as it impacts on investor sentiment. The level of interest rates, set by the Federal Reserve (Fed), also influences the DJIA as it affects the cost of credit, on which many corporations are heavily reliant. Therefore, inflation can be a major driver as well as other metrics which impact the Fed decisions.
Dow Theory is a method for identifying the primary trend of the stock market developed by Charles Dow. A key step is to compare the direction of the Dow Jones Industrial Average (DJIA) and the Dow Jones Transportation Average (DJTA) and only follow trends where both are moving in the same direction. Volume is a confirmatory criteria. The theory uses elements of peak and trough analysis. Dow’s theory posits three trend phases: accumulation, when smart money starts buying or selling; public participation, when the wider public joins in; and distribution, when the smart money exits.
There are a number of ways to trade the DJIA. One is to use ETFs which allow investors to trade the DJIA as a single security, rather than having to buy shares in all 30 constituent companies. A leading example is the SPDR Dow Jones Industrial Average ETF (DIA). DJIA futures contracts enable traders to speculate on the future value of the index and Options provide the right, but not the obligation, to buy or sell the index at a predetermined price in the future. Mutual funds enable investors to buy a share of a diversified portfolio of DJIA stocks thus providing exposure to the overall index.
추천 기사


