

Gold holds within weekly range as US-Iran talks remain in focus
- Gold remains confined within this week’s trading range as traders assess ongoing diplomatic talks between the United States and Iran.
- A pullback in US Treasury yields offers some support for Gold, though hawkish Fed expectations continue to cap the upside.
- XAU/USD stays pressured beneath the 100-day SMA, while momentum signals remain tilted to the downside.
Gold (XAU/USD) consolidates on Friday, remaining confined within this week’s trading range as investors cautiously monitor ongoing diplomatic efforts between the United States and Iran to reach a deal to end the war in the Middle East. At the time of writing, XAU/USD is trading around $4,517, staying on course for a second consecutive weekly decline.
Indirect negotiations between the United States and Iran continue under Pakistani mediation, as Iran’s Foreign Minister Abbas Araghchi held another meeting with Pakistani Interior Minister Mohsin Naqvi to discuss the latest proposals.
However, major disagreements remain unresolved. A senior Iranian source told Reuters that “no deal has been reached yet, but gaps have narrowed,” while adding that Iran’s uranium enrichment programme and its control over the Strait of Hormuz remain among the key sticking points in the negotiations.
Iran and Oman are discussing a plan to introduce a toll system for vessels transiting through the Strait of Hormuz. Speaking at the White House, US President Donald Trump opposed the idea, saying, “We want it open, we want it free, we don’t want tolls.” The US President also warned that Iran “will not get a nuclear weapon or we’ll do something drastic.”
Still, cautious optimism surrounding the negotiations improved overall market sentiment and pushed Oil prices slightly lower from recent highs. As a result, US Treasury yields paused their recent surge, offering some support to the non-yielding metal. The benchmark US 10-year Treasury yield extended its pullback for a third consecutive day on Friday, easing toward 4.560% after climbing to a 16-month high of 4.687% earlier this week.
At the same time, hawkish Federal Reserve (Fed) expectations and a stronger US Dollar (USD) continue to act as headwinds for Gold, as global inflation concerns stemming from elevated Oil prices have prompted traders to increase bets that the central bank may raise interest rates by the end of the year.
Richmond Fed President Thomas Barkin said on Thursday that current policy is “in a good place to respond to ongoing shocks,” adding that whether the Fed needs to hike rates depends on how businesses and consumers react to developing conditions. Barkin also said he is “nervous about the tails on both sides of the mandate.”
On the economic data front, traders await the University of Michigan’s (UoM) Consumer Sentiment and Inflation Expectations survey due later on Friday.
Technical Analysis: XAU/USD struggles below 100-day SMA
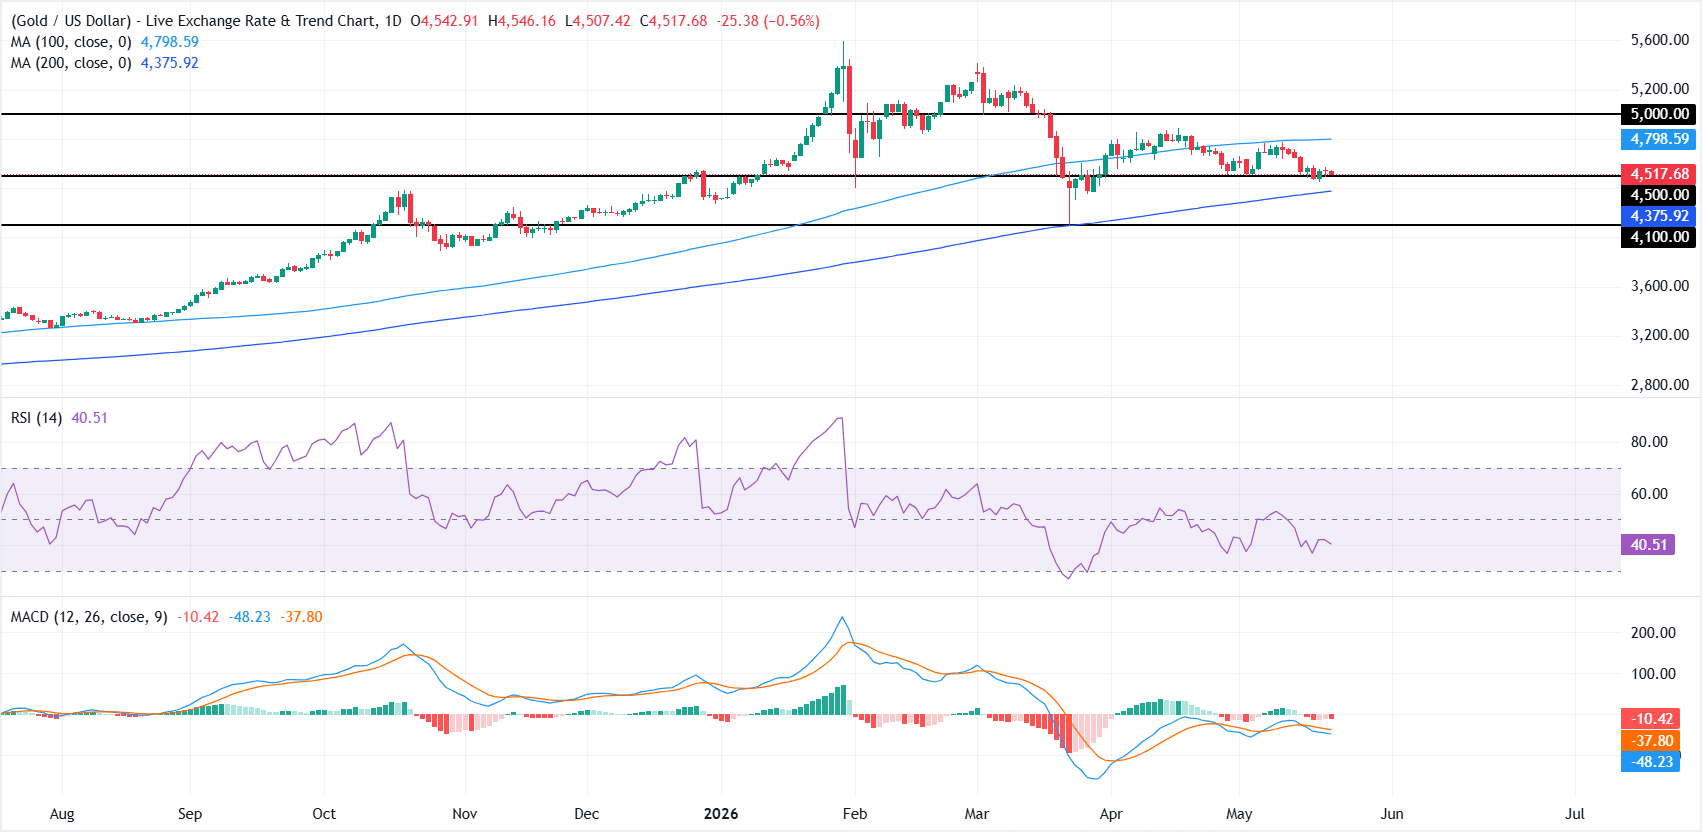
On the daily chart, XAU/USD is holding above the 200-day Simple Moving Average (SMA) near $4,375 but capped well below the 100-day SMA around $4,798, which keeps the broader tone neutral with a slight downside risk.
The Relative Strength Index (RSI) at 40 signals soft, non-oversold momentum, while the Moving Average Convergence Divergence (MACD) remains in negative territory and has been weakening again, which together hint that rebounds may struggle while price remains lodged between these medium- and longer-term trend references.
On the downside, initial support is seen at the nearby horizontal level around $4,500, ahead of the 200-day SMA clustered lower near $4,375. A clear break beneath these would expose the next key floor at roughly $4,100. On the topside, immediate resistance is defined by the 100-day SMA at about $4,798, with a subsequent barrier at the $5,000 horizontal level, and only a sustained move above these caps would meaningfully ease the current pressure and reopen the path toward higher highs.
(The technical analysis of this story was written with the help of an AI tool.)
Gold FAQs
Gold has played a key role in human’s history as it has been widely used as a store of value and medium of exchange. Currently, apart from its shine and usage for jewelry, the precious metal is widely seen as a safe-haven asset, meaning that it is considered a good investment during turbulent times. Gold is also widely seen as a hedge against inflation and against depreciating currencies as it doesn’t rely on any specific issuer or government.
Central banks are the biggest Gold holders. In their aim to support their currencies in turbulent times, central banks tend to diversify their reserves and buy Gold to improve the perceived strength of the economy and the currency. High Gold reserves can be a source of trust for a country’s solvency. Central banks added 1,136 tonnes of Gold worth around $70 billion to their reserves in 2022, according to data from the World Gold Council. This is the highest yearly purchase since records began. Central banks from emerging economies such as China, India and Turkey are quickly increasing their Gold reserves.
Gold has an inverse correlation with the US Dollar and US Treasuries, which are both major reserve and safe-haven assets. When the Dollar depreciates, Gold tends to rise, enabling investors and central banks to diversify their assets in turbulent times. Gold is also inversely correlated with risk assets. A rally in the stock market tends to weaken Gold price, while sell-offs in riskier markets tend to favor the precious metal.
The price can move due to a wide range of factors. Geopolitical instability or fears of a deep recession can quickly make Gold price escalate due to its safe-haven status. As a yield-less asset, Gold tends to rise with lower interest rates, while higher cost of money usually weighs down on the yellow metal. Still, most moves depend on how the US Dollar (USD) behaves as the asset is priced in dollars (XAU/USD). A strong Dollar tends to keep the price of Gold controlled, whereas a weaker Dollar is likely to push Gold prices up.
추천 기사


