


100 threshold: United States Dollar Index faces make-or-break Fed decision
- The US Dollar holds firm ahead of the Fed monetary policy announcement on Wednesday.
- Updated economic projections and signals on further tightening could drive the next move in the Greenback.
- Technically, DXY has reclaimed the 200-day SMA but faces strong resistance around 99.80-100.00.
The US Dollar Index (DXY) holds firm near a two-week high on Tuesday as traders prepare for the Federal Reserve’s (Fed) monetary policy decision on Wednesday. At the time of writing, the index trades around 99.66, up 0.17% on the day.
Markets are nearly fully pricing in a 25-basis-point rate hike, with the CME FedWatch Tool placing the probability at 92%. As a result, the Fed’s guidance may matter more for the US Dollar than the decision itself, with attention turning to the updated economic projections and comments from Fed Chairman Kevin Warsh.
USD path hinges on FOMC follow-through and dot plot signals
Strategists at Scotiabank highlight that “swaps are pricing in more than 90bps of Fed tightening between now and next summer,” warning that “any doubts about follow-through action from the FOMC could still derail the USD.” According to TD Securities, with “a 25bp rate hike almost fully priced-in, the USD could see knee-jerk weakness under our base case,” while “a rate hold would be a big dovish surprise and could push the USD back to pre-August CPI release level.”
They add that “the USD rally could have room to extend if the dot plot puts an October rate hike on the table,” noting that in one scenario the “Fed hikes rates 25bp with little change to the statement language” and the “dot plot shows a median of two hikes,” whereas in an alternative outcome the “Fed keeps rates on hold with no changes to the statement,” with “more than three dissents and median dot still shows at least one hike.”
Technical analysis
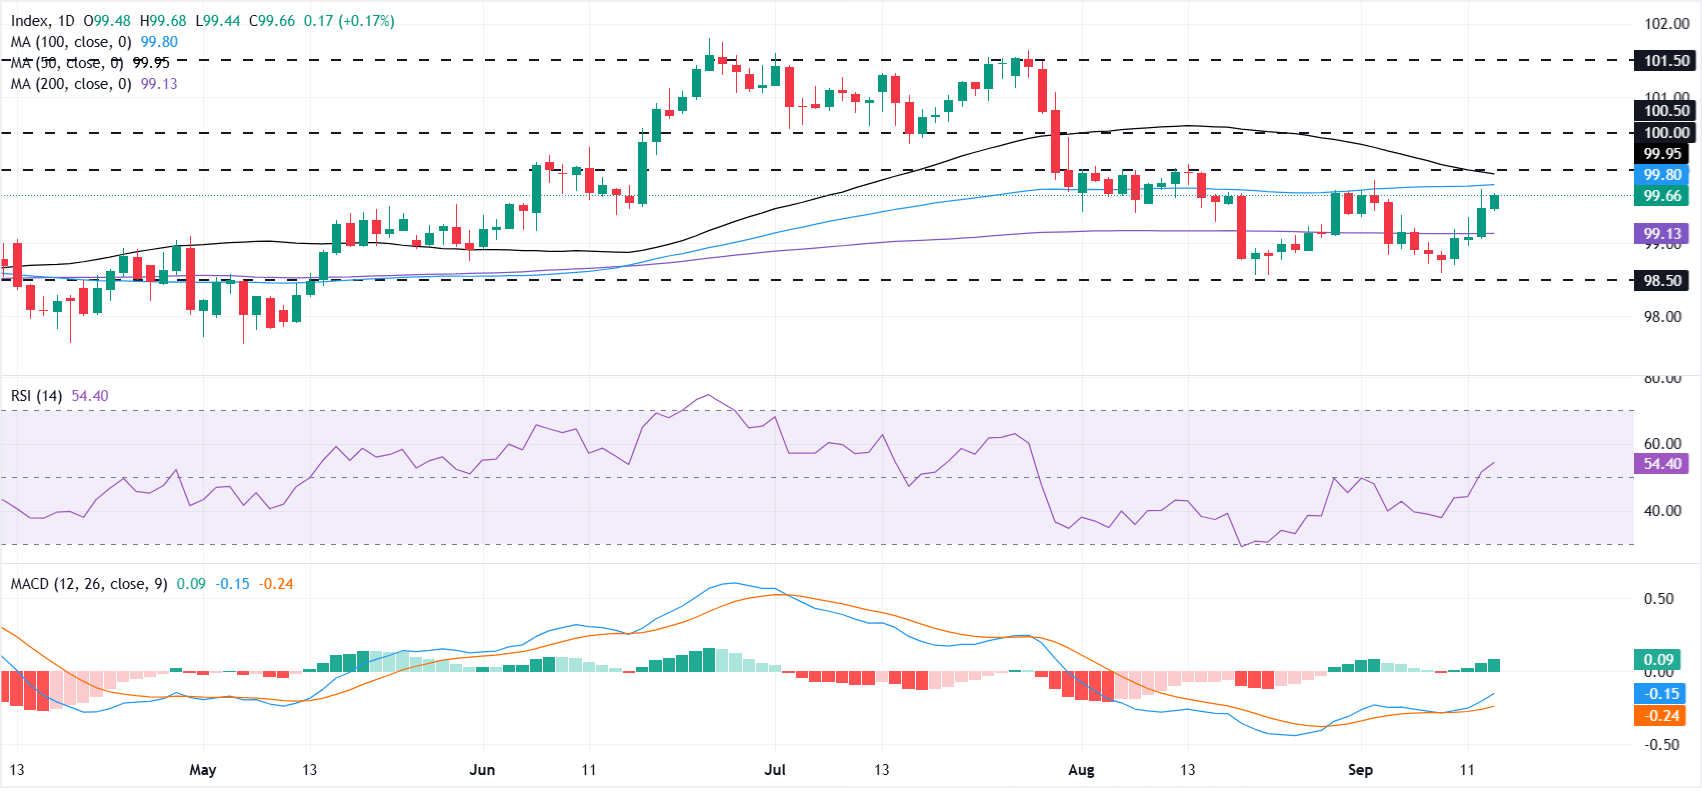
On the daily chart, the US Dollar Index appears to have formed a double bottom around 98.50 and has reclaimed the 200-day Simple Moving Average (SMA) at 99.13. However, the recovery now faces a dense resistance zone between 99.80 and the psychological 100.00 mark, where the 100-day SMA at 99.80 and the 50-day SMA at 99.95 are closely aligned.
Momentum indicators show that buying pressure is rebuilding, but a breakout has not been confirmed. The Relative Strength Index (RSI) stands near 54, and a positive, rising Moving Average Convergence Divergence (MACD) histogram hints that bullish momentum is attempting to rebuild while price remains confined under nearby moving-average resistance.
A Fed rate hike alone may not be enough to push the index through the 99.80-100.00 resistance zone because the move is already priced in. The Dollar would likely need hawkish economic projections or a signal from Chairman Warsh that additional hikes are coming. A sustained break above 100 would confirm stronger bullish momentum and expose the next resistance levels at 100.50 and 101.50.
Conversely, a surprise hold or cautious guidance could trigger a pullback below the 200-day SMA at 99.13. Such a move would shift attention back toward the double-bottom support around 98.50. A decisive break below this area would invalidate the developing recovery structure and leave the index vulnerable to deeper losses.
(The technical analysis of this story was written with the help of an AI tool. Know more.)
Fed FAQs
Monetary policy in the US is shaped by the Federal Reserve (Fed). The Fed has two mandates: to achieve price stability and foster full employment. Its primary tool to achieve these goals is by adjusting interest rates. When prices are rising too quickly and inflation is above the Fed’s 2% target, it raises interest rates, increasing borrowing costs throughout the economy. This results in a stronger US Dollar (USD) as it makes the US a more attractive place for international investors to park their money. When inflation falls below 2% or the Unemployment Rate is too high, the Fed may lower interest rates to encourage borrowing, which weighs on the Greenback.
The Federal Reserve (Fed) holds eight policy meetings a year, where the Federal Open Market Committee (FOMC) assesses economic conditions and makes monetary policy decisions. The FOMC is attended by twelve Fed officials – the seven members of the Board of Governors, the president of the Federal Reserve Bank of New York, and four of the remaining eleven regional Reserve Bank presidents, who serve one-year terms on a rotating basis.
In extreme situations, the Federal Reserve may resort to a policy named Quantitative Easing (QE). QE is the process by which the Fed substantially increases the flow of credit in a stuck financial system. It is a non-standard policy measure used during crises or when inflation is extremely low. It was the Fed’s weapon of choice during the Great Financial Crisis in 2008. It involves the Fed printing more Dollars and using them to buy high grade bonds from financial institutions. QE usually weakens the US Dollar.
Quantitative tightening (QT) is the reverse process of QE, whereby the Federal Reserve stops buying bonds from financial institutions and does not reinvest the principal from the bonds it holds maturing, to purchase new bonds. It is usually positive for the value of the US Dollar.
추천 기사


