


Dogecoin Price Forecast: Clings to EMA support as recovery lacks conviction
- Dogecoin hovers around $0.083 on Tuesday after finding support around key 50-day and 100-day EMAs the previous day.
- Silent institutional demand and mixed derivatives positioning suggest fading interest.
- The technical outlook suggests that if DOGE holds above key EMA support, signals recover, while a breakdown suggests deeper correction.
Dogecoin (DOGE) hovers around $0.083 at the time of writing on Tuesday after finding support around the key support zone the previous day. Quiet institutional demand, along with mixed derivatives positioning, suggests fading interest in the dog-themed meme coin. In addition, the technical outlook puts DOGE at a make-or-break zone, with a hold above key support favoring recovery and a breakdown risking a deeper correction.
Silent institutional demand and mixed derivatives
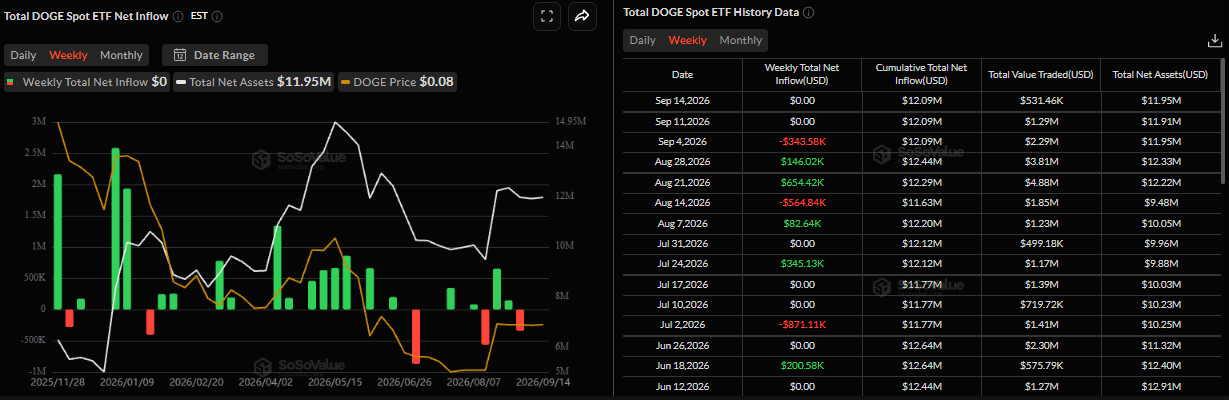
SoSoValue data showed that spot DOGE Exchange Traded Funds (ETFs) have remained quiet since last week. This quiet institutional demand suggests investors have limited conviction in DOGE’s recovery. Moreover, if these flows turn negative this week, DOGE could face a correction ahead.
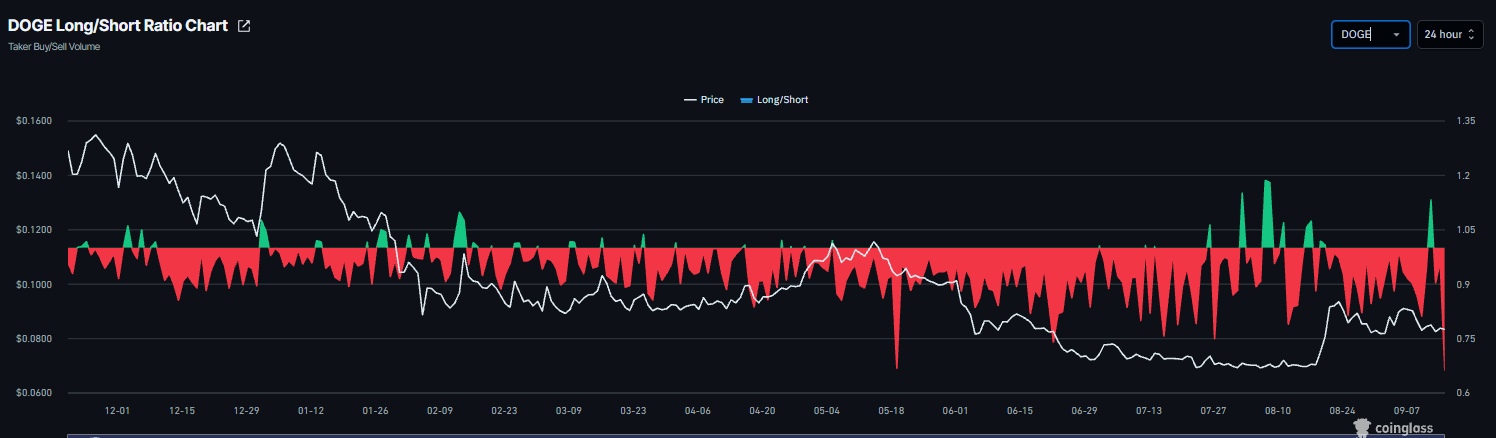
On the derivatives side, metrics also show a mixed outlook. CoinGlass’ long-to-short ratio for DOGE reads 0.66 on Tuesday, the lowest level over a month. This ratio below one reflects bearish sentiment, as more traders are betting on the meme coin to fall.
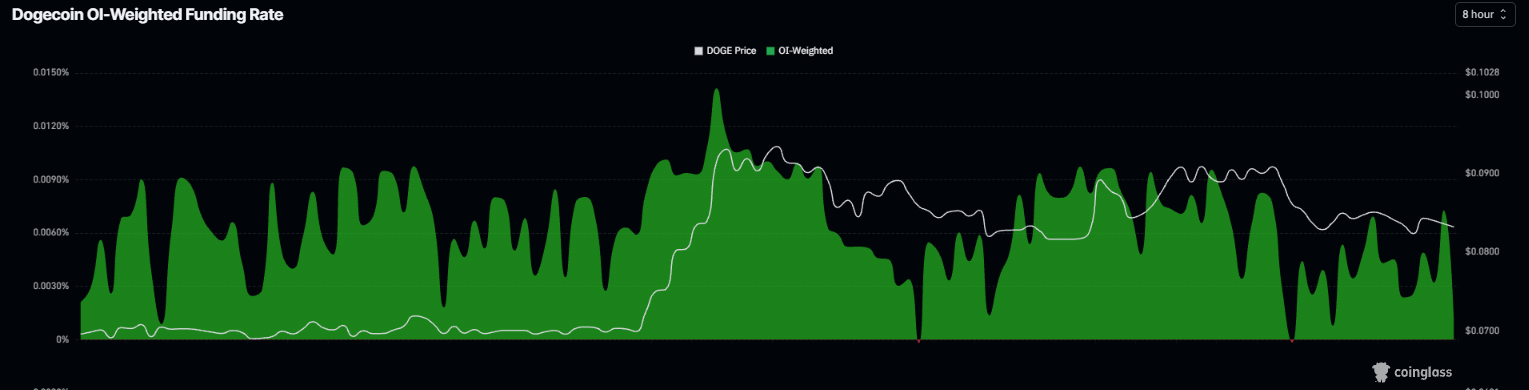
However, Dogecoin’s funding rates point to a strengthening outlook. CoinGlass’ OI-weighted funding rate data for Dogecoin flipped positive on September 9 and read 0.0010% on Tuesday. This positive rate indicates longs are paying shorts and signals a bullish sentiment.
On-chain data shows cautious signs
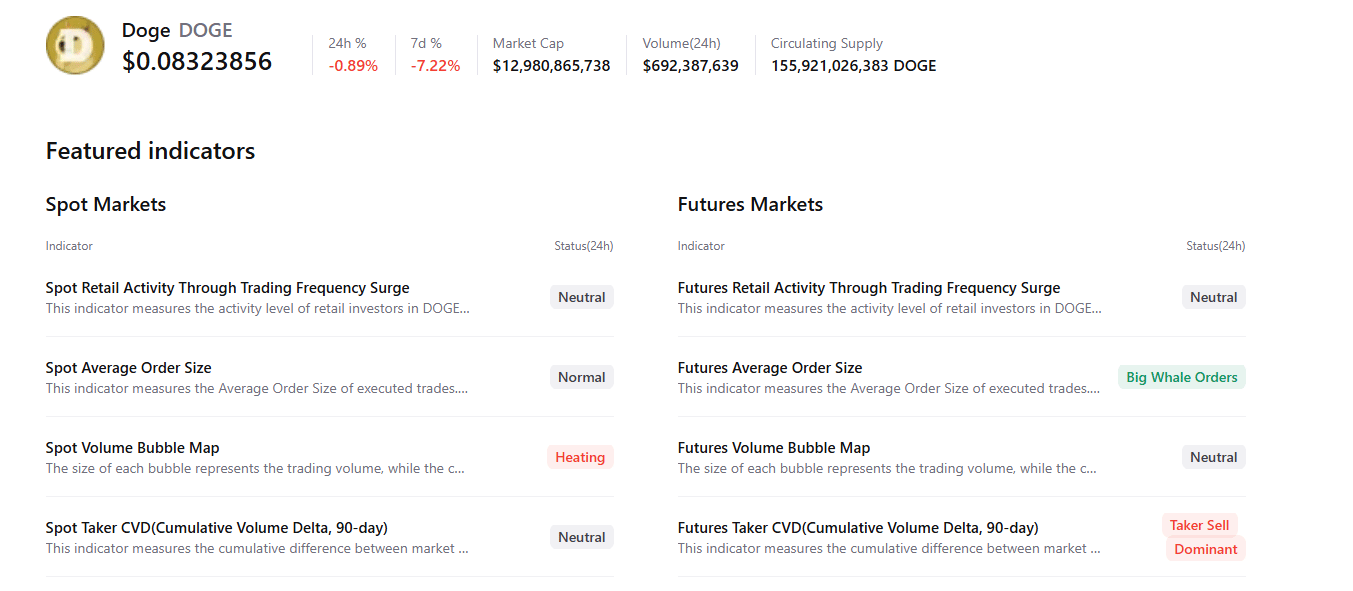
CryptoQuant’s summary data shows mildly cautious signs. DOGE’s futures markets show large whale orders; however, it also shows sell-side dominance. In addition, spot markets show heating conditions while other metrics remain neutral, highlighting a mildly bearish, cautious sentiment bias among traders.
Dogecoin technical outlook: Finds support around key zone
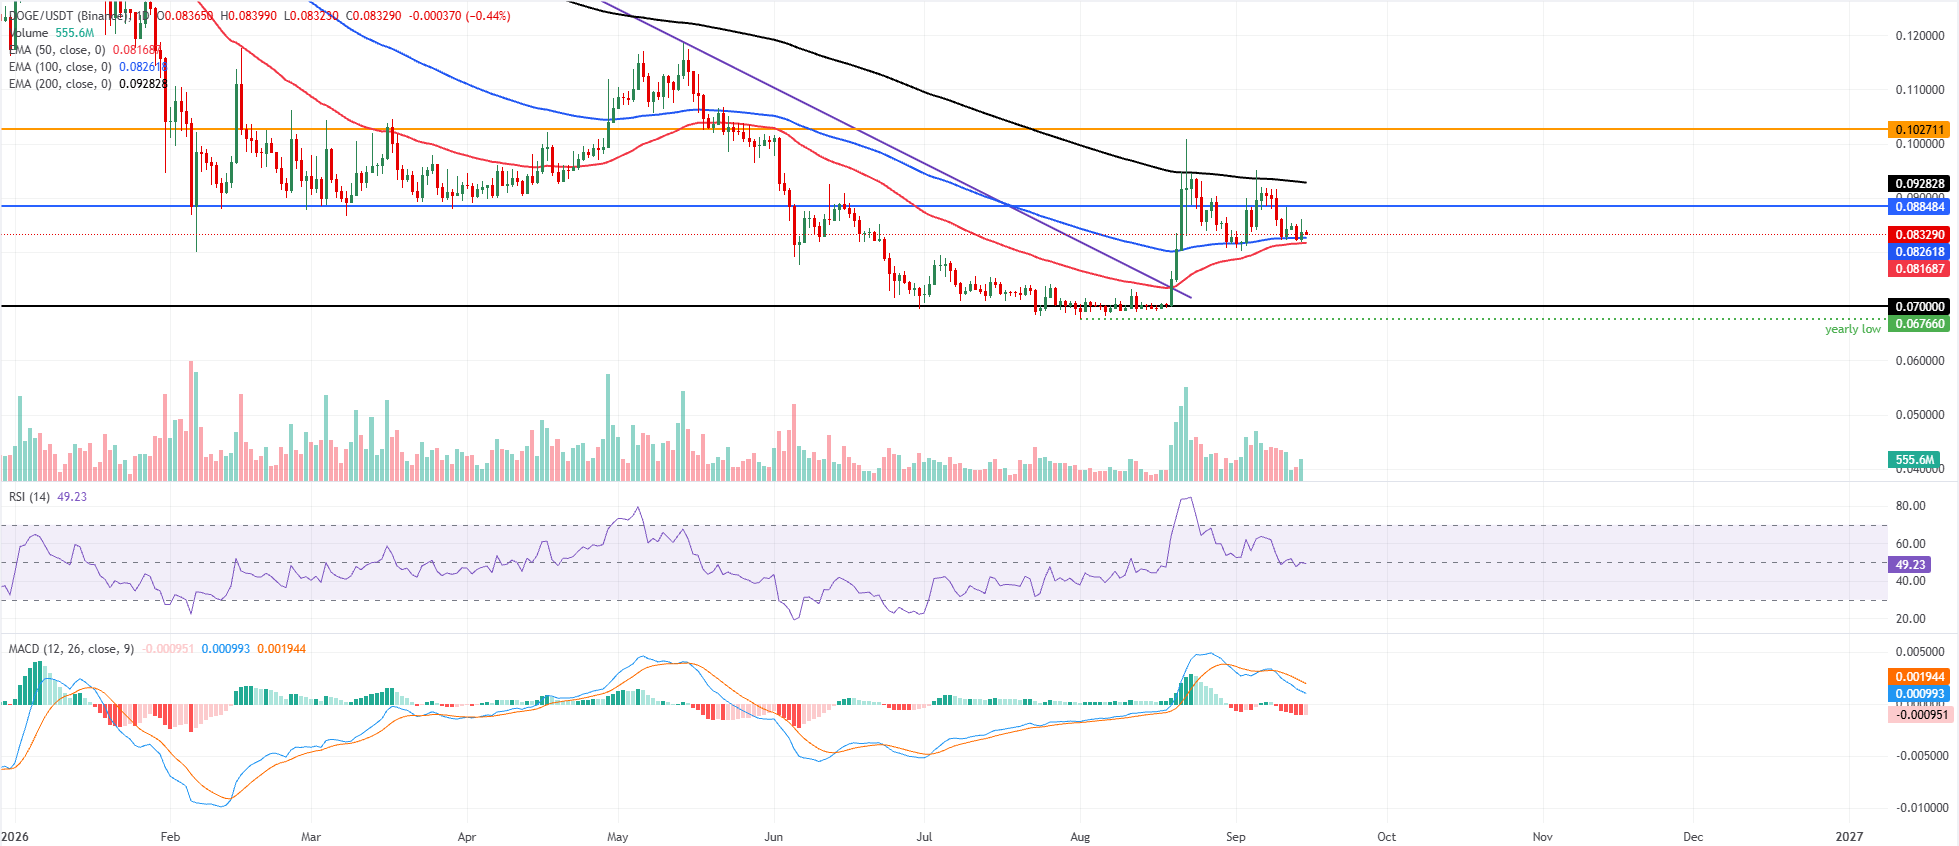
Dogecoin price trades at $0.083 on Tuesday. DOGE hovers above the 50-day and 100-day Exponential Moving Averages (EMAs) at $0.081 and $0.082, but remains capped well below the 200-day EMA at $0.092, keeping the broader tone neutral-to-bearish despite a modest short-term base.
The Relative Strength Index (RSI) sits near 49, signaling flat momentum. At the same time, the Moving Average Convergence Divergence (MACD) line holds slightly below zero, hinting that buyers lack strong conviction after the recent recovery from the $0.070 area.
On the topside, initial resistance emerges at the horizontal barrier around $0.088, followed by the 200-day EMA at $0.092, with a stronger supply zone forming near the prior horizontal cap at $0.102.
On the downside, the cluster of the 50-day and 100-day EMAs just under price reinforces immediate support, with a more important floor at the horizontal support of $0.070; a daily close below that level would likely trigger a deeper retracement of the latest advance.
(The technical analysis of this story was written with the help of an AI tool. Know more.)
추천 기사


