


Dow Jones Industrial Average rallies on a coin toss
- DJIA trades near 53,750, up 1.3%, on track for its best day in a month.
- September hike odds at 50.4% after a Fed governor leans toward a hold.
- ISM services PMI beats at 55.4, prices paid climb to 72.6 from 70.3.
The Dow Jones Industrial Average trades near 53,750, up 1.3% and on track for its strongest session since early August, after a Fed governor said he would be inclined to support holding rates at the September 15-16 meeting if the inflation data due over the next two weeks keep behaving. The tape has treated a conditional as a verdict. Hike odds on the FedWatch tool sit at 50.4% against 49.6% for a hold, down from above 60% on Wednesday, and the 10-year Treasury yield has backed off the multi-year high it set the day before.
The market bought the first half of the sentence
The first half of the governor's sentence is that recent data finally show signs of disinflation, with the three-month annualized rate on the Personal Consumption Expenditures (PCE) gauge down to about 3.05% from 4.76% in February, and roughly half of July's core increase coming from services prices that are estimated rather than observed. The second half is that policy is only slightly restrictive and it would not take much acceleration to nudge him toward tightening. The market priced the first half.
The chair used last week's Jackson Hole keynote to say the softer summer readings did not persuade him the underlying trend had improved, and a second governor said Tuesday he would back a hike if inflation fails to ease. Headline PCE ran 3.7% in July with core at 3.3%, and the only inflation reads before the meeting are the Producer Price Index (PPI) on September 10 and the Consumer Price Index (CPI) on September 11. The hold has one vote leaning toward it and two data points that can take it away.
Deferred is not cancelled
The FedWatch table is less dovish than the tape's reading of it. October carries a 63.6% probability of at least one hike, and December has a single hike as its modal outcome at 42.9%, with a further 32.9% assigned to two. The market gives better than four chances in five that the target range is higher by year end. What moved today is the date of the first move rather than the fact of it, and the index has added more than 650 points on a calendar adjustment.
The rates relief is real as far as it goes. The 10-year yield trades near 4.75% after touching 4.81% on Wednesday, its highest since late 2023, and the Dollar Index sits at a one-week low near 99.00 as the Yen jumps to a one-month high ahead of a September 18 Bank of Japan decision the market expects to bring a hike. That relief was under way before the governor spoke, so the equity bid is borrowed from the bond market rather than earned on any change in the inflation facts. Nvidia (NVDA) agreeing to buy Hugging Face for $12.9 billion is colour, not cause.
The condition has an energy problem
The Institute for Supply Management (ISM) services Purchasing Managers Index (PMI) printed 55.4 against a 54.3 consensus and 54.1 prior, with prices paid climbing to 72.6 from 70.3 while the employment index at 47.8 stayed in contraction. The prices line is the hawkish number of the morning, and it bought a thirty-minute dip from just above 53,500 to the 53,300 area before buyers absorbed it and pushed on to the session high.
The governor's case also rests on higher energy prices not having spread into the wider economy, and the barrel is not cooperating. West Texas Intermediate (WTI) Crude Oil trades near $92.00 and Brent Crude Oil above $96.00, both up about 1% on the day, after American forces struck Islamic Revolutionary Guard Corps (IRGC) targets on Tuesday, Iran answered with missiles and drones at bases across the region, and the president said Wednesday that any agreement with Tehran is worthless and further strikes can come at any time. A 72.6 prices paid reading and a barrel climbing through a live shooting war are the two facts most likely to make August's CPI say otherwise.
Friday's payrolls and next week's prices
August nonfarm payrolls land Friday at 12:30 GMT, forecast at 58K after a 23K contraction, with the unemployment rate seen unchanged at 4.1% and average hourly earnings forecast at 0.3% MoM from 0.1% and 3% YoY from 3.2%. This morning's labour prints leaned soft: initial claims at 206K against 205K expected, Challenger job cuts up to 52.9K from 33.4K, and second-quarter unit labour costs at 1.2% against 1.3% forecast. The governor expects Friday's report to look like recent ones and says inflation will decide his vote, which makes the earnings line the number that matters here.
A regional Fed president speaks at 19:00 GMT today, PPI follows on September 10 and CPI on September 11, both at 12:30 GMT, and the committee decides on September 16. A soft payroll count on Friday does nothing for the hold that a firm CPI cannot undo the following week, and the index is trading as though the sequence runs the other way.
Levels to watch
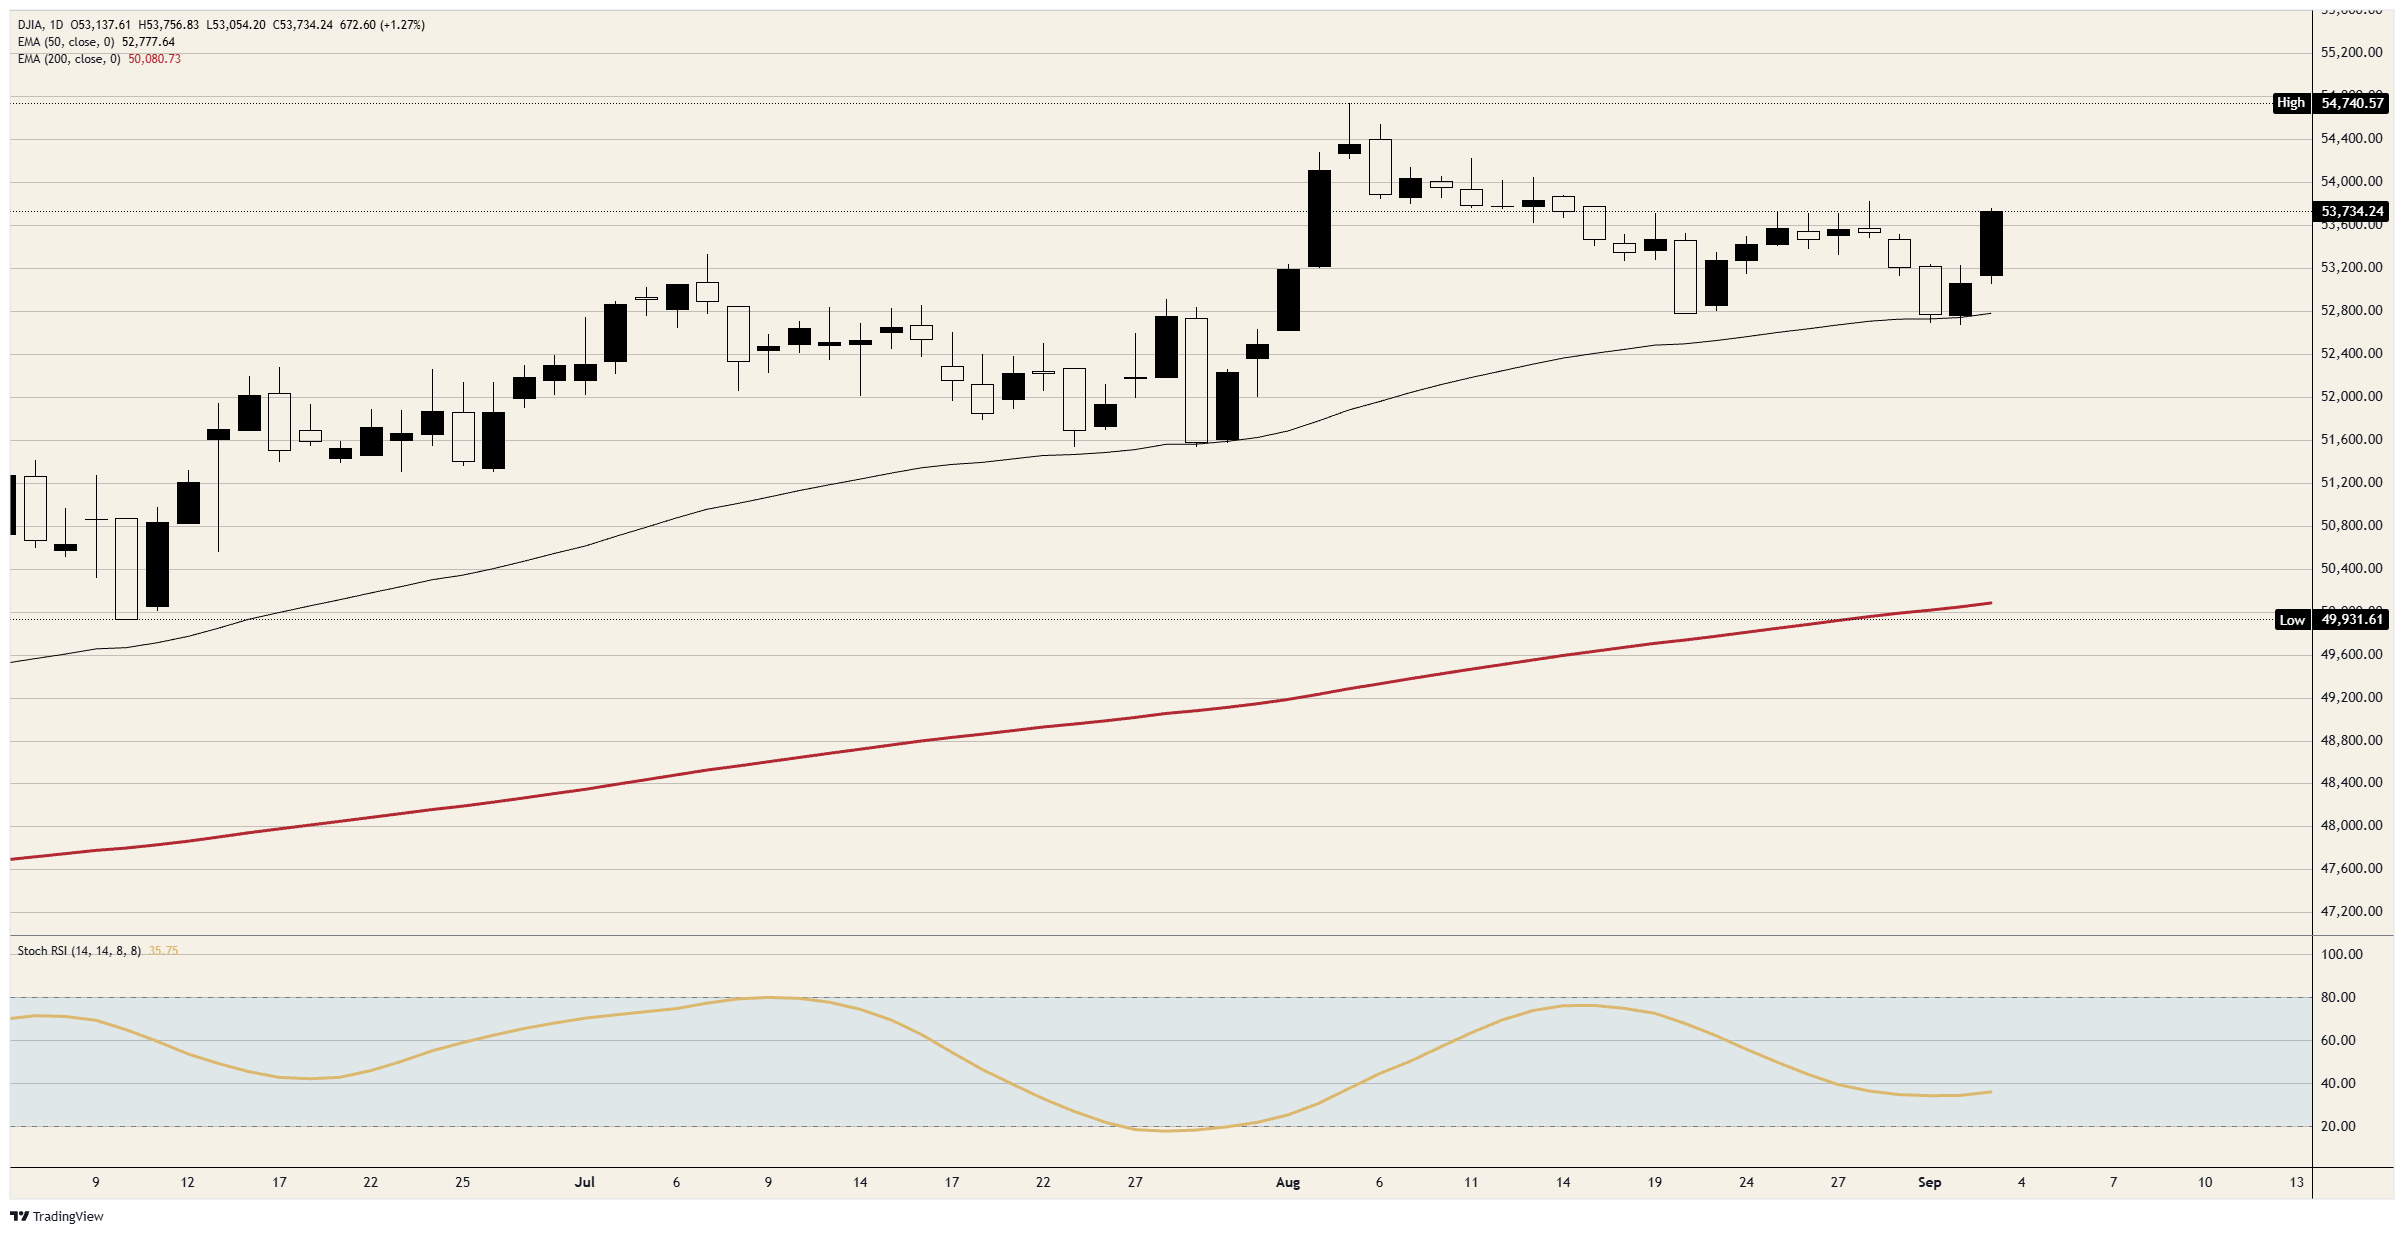
Resistance: The 53,800 handle is the first test, the band that capped every rally from August 14 through August 28, and the session high sits just beneath it. Above that, 54,000 marks the August 7 to August 13 consolidation, then 54,400 and the record just short of 54,750, roughly 2% overhead.
Support: The 53,500 handle is the shelf the afternoon built on before the final leg and the level buyers now have to hold. Beneath it sit the 53,250 area, where Wednesday's high and Tuesday's open cluster, then the session low just above 53,000, with the rising 50-day Exponential Moving Average (EMA) near 52,800 the line under the entire August advance. The 200-day EMA just above 50,000 is not in play.
Bias: Bullish while 53,500 holds, with objectives at 53,800 and then 54,000. The daily Stochastic Relative Strength Index (Stoch RSI) near 36 is curling up out of the lower third of its range, which fits a low made on Wednesday and defended. The five-minute reading above 85 says the last leg is stretched, so the first pullback toward 53,500 tests the bid rather than the trend. A daily close beneath 53,500 returns the tape to the range and reopens 53,250, then 53,000 and the 50-day EMA.
Dow Jones daily chart
Dow Jones FAQs
The Dow Jones Industrial Average, one of the oldest stock market indices in the world, is compiled of the 30 most traded stocks in the US. The index is price-weighted rather than weighted by capitalization. It is calculated by summing the prices of the constituent stocks and dividing them by a factor, currently 0.152. The index was founded by Charles Dow, who also founded the Wall Street Journal. In later years it has been criticized for not being broadly representative enough because it only tracks 30 conglomerates, unlike broader indices such as the S&P 500.
Many different factors drive the Dow Jones Industrial Average (DJIA). The aggregate performance of the component companies revealed in quarterly company earnings reports is the main one. US and global macroeconomic data also contributes as it impacts on investor sentiment. The level of interest rates, set by the Federal Reserve (Fed), also influences the DJIA as it affects the cost of credit, on which many corporations are heavily reliant. Therefore, inflation can be a major driver as well as other metrics which impact the Fed decisions.
Dow Theory is a method for identifying the primary trend of the stock market developed by Charles Dow. A key step is to compare the direction of the Dow Jones Industrial Average (DJIA) and the Dow Jones Transportation Average (DJTA) and only follow trends where both are moving in the same direction. Volume is a confirmatory criteria. The theory uses elements of peak and trough analysis. Dow’s theory posits three trend phases: accumulation, when smart money starts buying or selling; public participation, when the wider public joins in; and distribution, when the smart money exits.
There are a number of ways to trade the DJIA. One is to use ETFs which allow investors to trade the DJIA as a single security, rather than having to buy shares in all 30 constituent companies. A leading example is the SPDR Dow Jones Industrial Average ETF (DIA). DJIA futures contracts enable traders to speculate on the future value of the index and Options provide the right, but not the obligation, to buy or sell the index at a predetermined price in the future. Mutual funds enable investors to buy a share of a diversified portfolio of DJIA stocks thus providing exposure to the overall index.
추천 기사


