


Bitcoin and Gold Outlook: BTC and XAU recover as US ISM Services PMI edges higher in August
- Bitcoin rallies, reclaiming the critical $80,000 level on Thursday.
- Gold builds momentum for the second straight day, reinforcing a short-term bullish outlook toward $4,600.
- US ISM report shows that Services PMI improved to 55.4 in August from 54.1 in July, surpassing forecasts.
Bitcoin (BTC) strongly rises to trade above the pivotal $80,000 level on Thursday. The Crypto King is rallying alongside broader cryptocurrency prices following the release of the United States (US) Services PMI.
Gold (XAU/USD) is similarly bullish, trading at $4,500 at the time of writing. The metal is up over 2% on the day, signaling the return of bulls as market sentiment improves.
US ISM Services PMI improves in August
The latest US Institute for Supply Management (ISM) data showed the Services PMI climbed to 55.4 in August, up from 54.1 in July and outpacing expectations of 54.3. This signals accelerating momentum across the sector.
Inflationary pressures intensified as the ISM Prices Paid Index (PPI) rose to 72.6 from 70.3. Labor market conditions showed a modest uptick, with the Employment Index increasing to 47.8 from 47.4. Meanwhile, business activity accelerated, reflected in the New Orders Index jumping to 60.9 from 57.2.
The improved ISM Services PMI comes against the backdrop of softer inflation in July, following a minor decline in the Consumer Price Index (CPI) even as the Personal Consumption Expenditures (PCE) data remained unchanged from the previous month. It affirms that the US economy is resilient amid sticky higher inflation.
Inflation in the US remains elevated above the Federal Reserve’s (Fed) 2% target. This has led policymakers to adopt a cautious stance, especially with tensions in the Middle East still running hot and the impact of US tariffs still apparent.
Technical analysis: Bitcoin gains traction above $80,000
Bitcoin trades at $80,861, extending its advance well above the key Exponential Moving Averages (EMAs), with the 50-day EMA at $70,713, the 100-day EMA around $69,463, and the 200-day EMA at $72,492 forming a supportive base beneath the current price. This setup keeps the near-term bias bullish, although the Relative Strength Index (RSI) at 72.35 edges into overbought territory and the Moving Average Convergence Divergence (MACD) indicator has pulled back toward the zero line, suggesting upside momentum is losing some intensity after the latest surge.
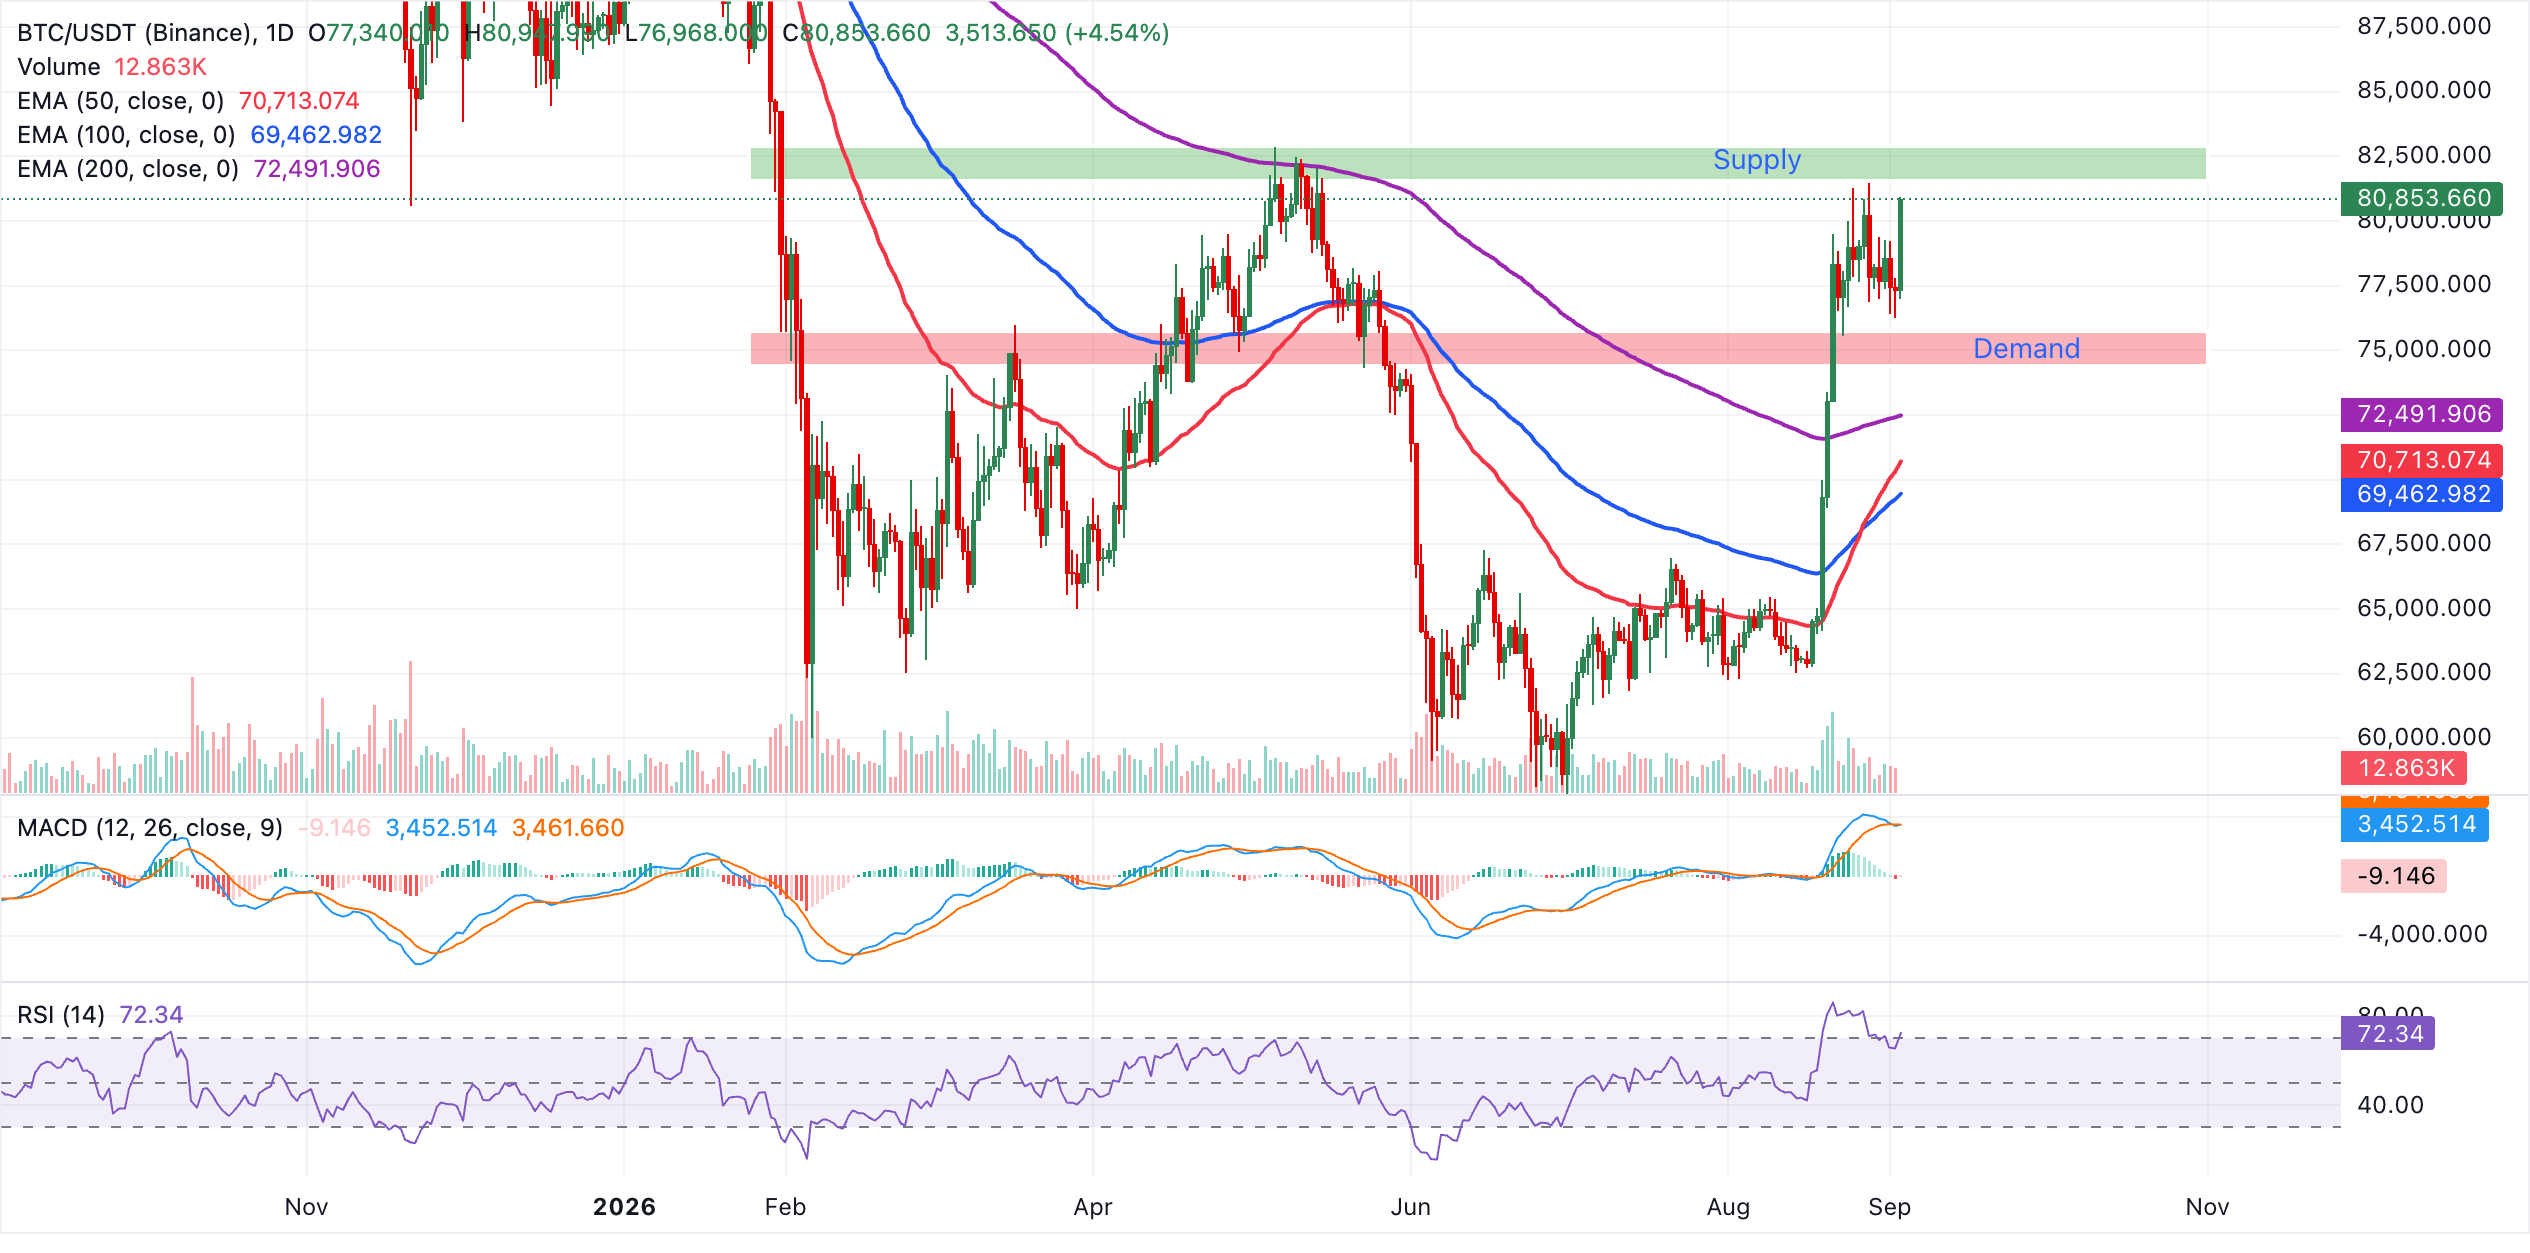
Immediate demand lies in the current area, with the first structural supports aligning around the 50-day EMA at $70,713 and the 200-day EMA at $72,492, followed by deeper support at the 100-day EMA near $69,463 in a broader correction.
With price still holding comfortably above these EMA layers, any pullback toward this clustered zone would likely be treated as a dip within a broader uptrend, unless selling pressure drives a sustained break back below the $70,000-$72,000 band, which would start to erode the prevailing bullish structure.
Gold technical analysis: XAU builds recovery momentum
Gold trades near $4,500, holding a bullish near-term bias as spot remains above the 50-day, 100-day, and 200-day EMAs, which are clustered between roughly $4,318 and $4,366. Price is advancing toward the downward-sloping trendline resistance around $4,540, while momentum remains constructive.
Meanwhile, the RSi at 56 sits in neutral-to-positive territory, and the MACD is negative but showing signs of waning bearish pressure after the recent pullback.
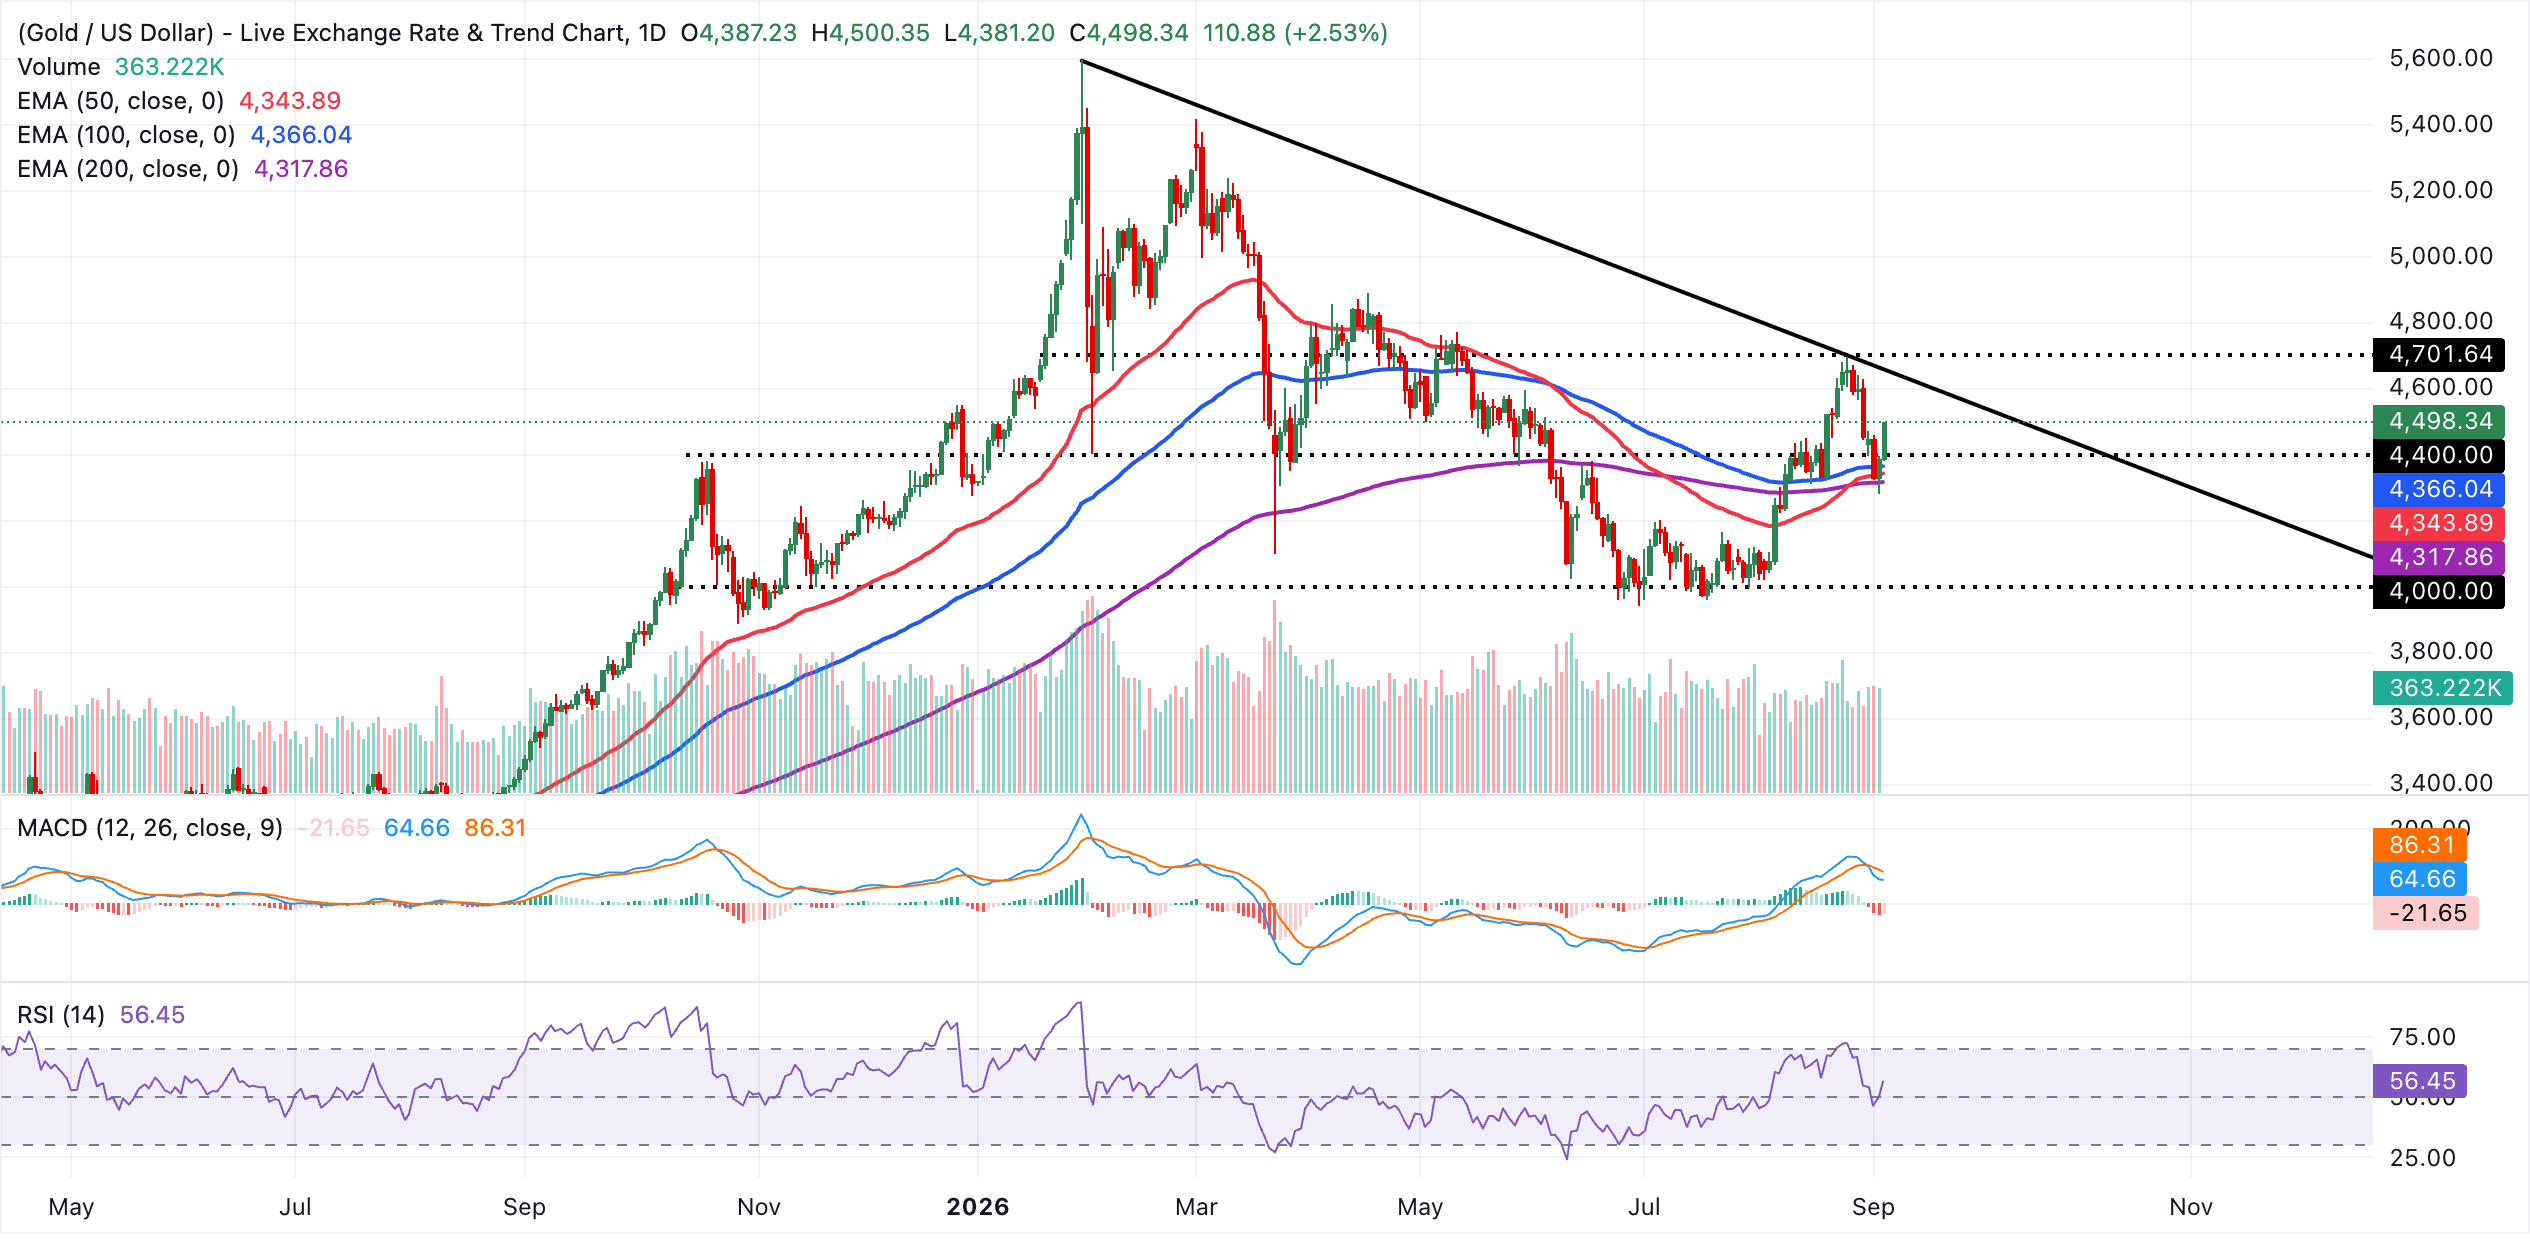
Immediate demand lies at the 100-day EMA near $4,366, followed by the 50-day EMA at $4,344 and then the 200-day EMA at $4,318, which together define a broad support band underpinning the uptrend. On the topside, the next hurdle is the descending trendline resistance at $4,540.47. A sustained break above this level would open the door to further gains, while failure to overcome it could trigger a corrective move back toward the EMA support cluster.
(The technical analysis of this story was written with the help of an AI tool. Know more.)
Bitcoin, altcoins, stablecoins FAQs
Bitcoin is the largest cryptocurrency by market capitalization, a virtual currency designed to serve as money. This form of payment cannot be controlled by any one person, group, or entity, which eliminates the need for third-party participation during financial transactions.
Altcoins are any cryptocurrency apart from Bitcoin, but some also regard Ethereum as a non-altcoin because it is from these two cryptocurrencies that forking happens. If this is true, then Litecoin is the first altcoin, forked from the Bitcoin protocol and, therefore, an “improved” version of it.
Stablecoins are cryptocurrencies designed to have a stable price, with their value backed by a reserve of the asset it represents. To achieve this, the value of any one stablecoin is pegged to a commodity or financial instrument, such as the US Dollar (USD), with its supply regulated by an algorithm or demand. The main goal of stablecoins is to provide an on/off-ramp for investors willing to trade and invest in cryptocurrencies. Stablecoins also allow investors to store value since cryptocurrencies, in general, are subject to volatility.
Bitcoin dominance is the ratio of Bitcoin's market capitalization to the total market capitalization of all cryptocurrencies combined. It provides a clear picture of Bitcoin’s interest among investors. A high BTC dominance typically happens before and during a bull run, in which investors resort to investing in relatively stable and high market capitalization cryptocurrency like Bitcoin. A drop in BTC dominance usually means that investors are moving their capital and/or profits to altcoins in a quest for higher returns, which usually triggers an explosion of altcoin rallies.
추천 기사


