


Crypto Today: Bitcoin, Ethereum, XRP show faint recovery signals amid mixed ETF flows
- Bitcoin rises and reclaims $78,000 on Thursday as ETF inflows return.
- Ethereum bounces off $2,400 short-term support following $48 million in ETF outflows on Wednesday.
- XRP edges higher as bulls aim for a $1.40 breakout despite a bearish-turning MACD indicator.
The cryptocurrency market broadly and subtly recovers on Thursday, led by Bitcoin’s (BTC) rise near $78,000. This follows persistent declines from the August peak near $81,500. Altcoins, including Ethereum (ETH) and Ripple (XRP), mirror BTC’s neutral-to-bullish outlook, trending higher above $2,400 and $1.37, respectively.
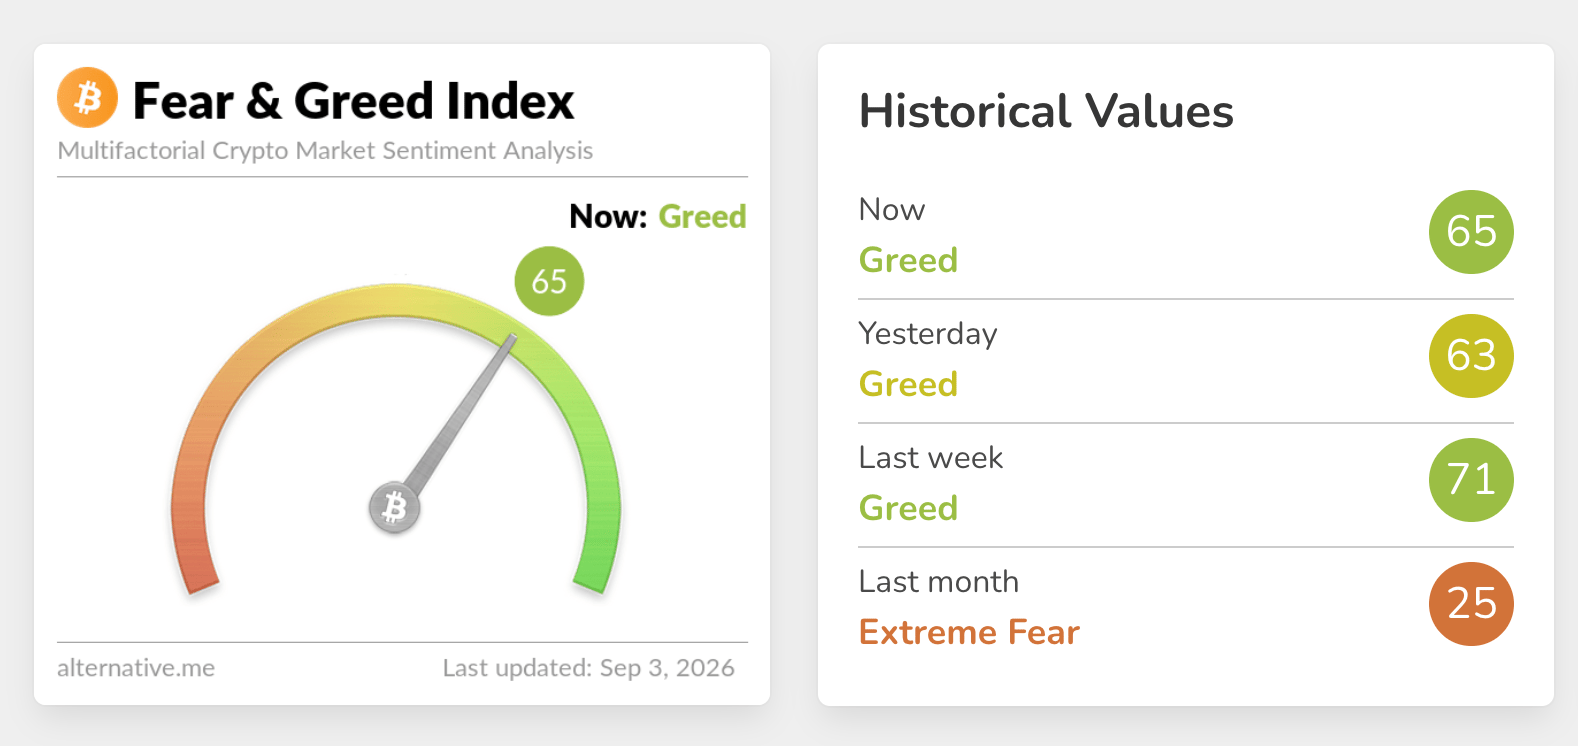
Appetite for risk assets remains relatively elevated, as reflected in the Fear & Greed Index. Market sentiment rose to 65 in the Greed territory on Thursday, up marginally from 63 the previous day. Steady, positive market sentiment provides a much-needed tailwind to sustain price increases.
Bitcoin attracts ETF inflows as Ethereum and XRP see outflows
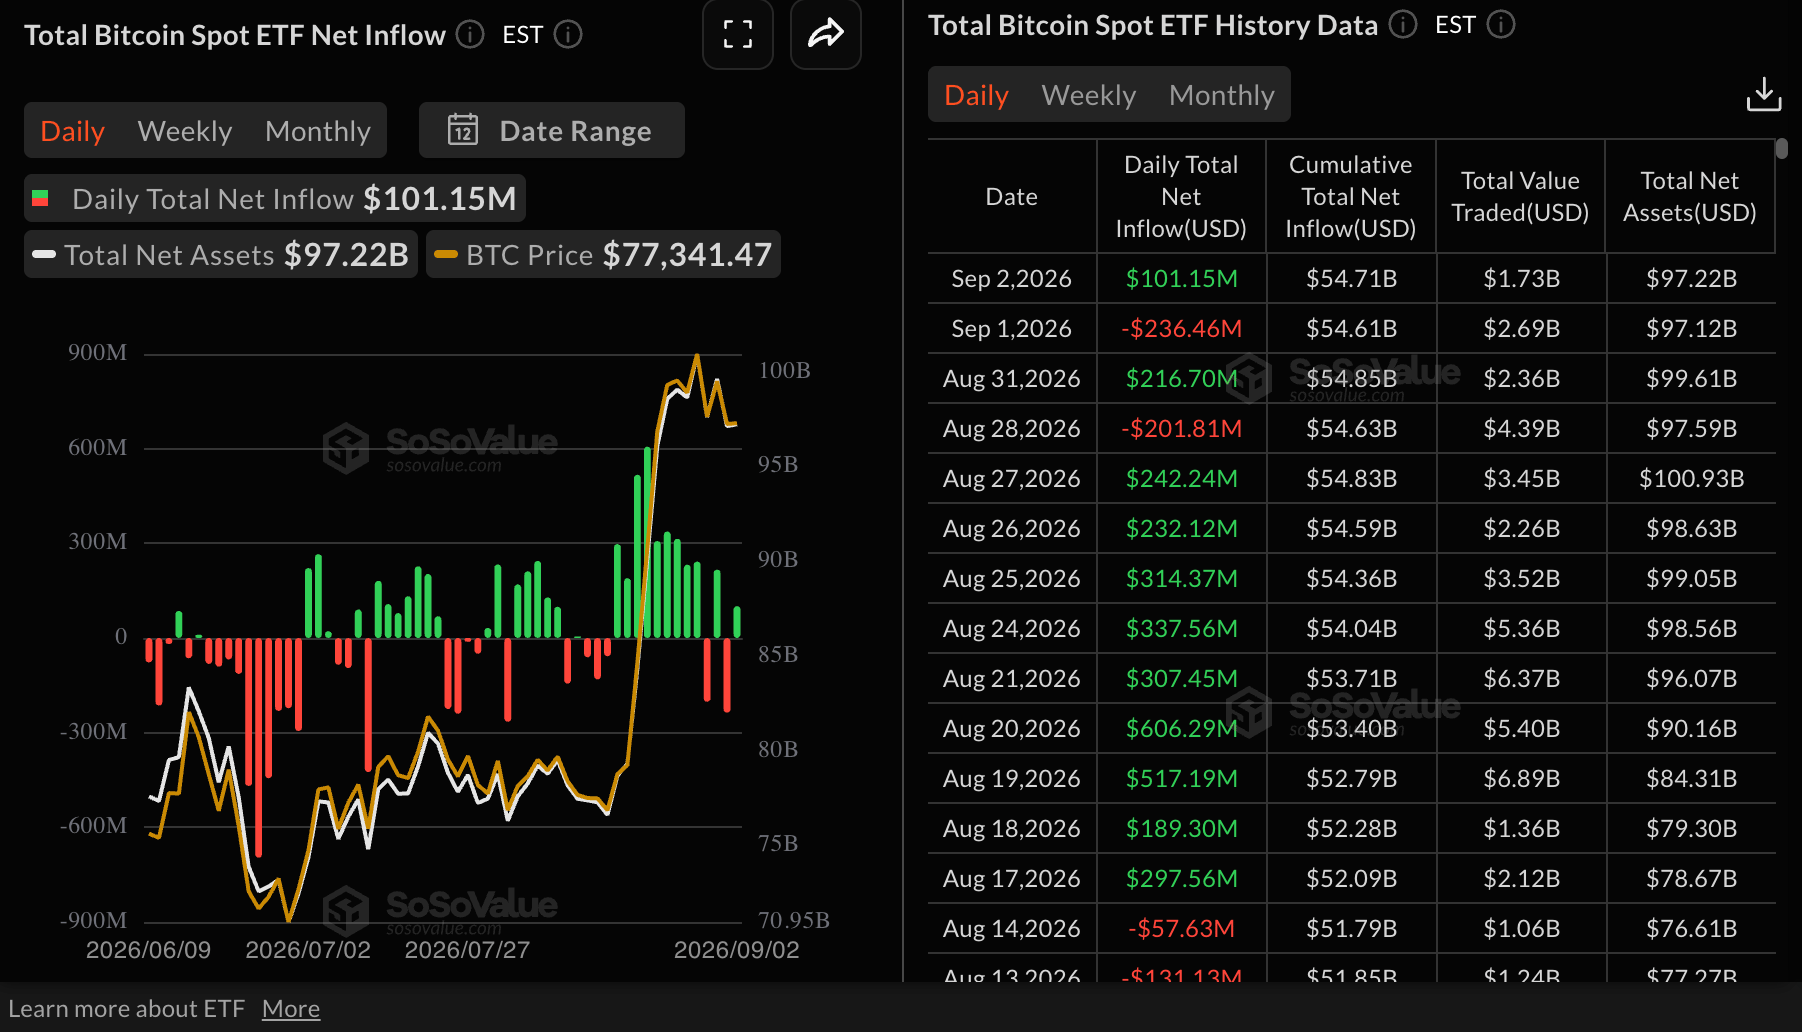
Bitcoin spot Exchange-Traded Funds (ETFs) saw inflows totaling $101 million on Wednesday. This followed $236 million in outflows recorded on Tuesday. Meanwhile, cumulative inflows edged up slightly to $54.71 billion, from $54.61 billion over the same period. Total assets under management average $97.22 billion.
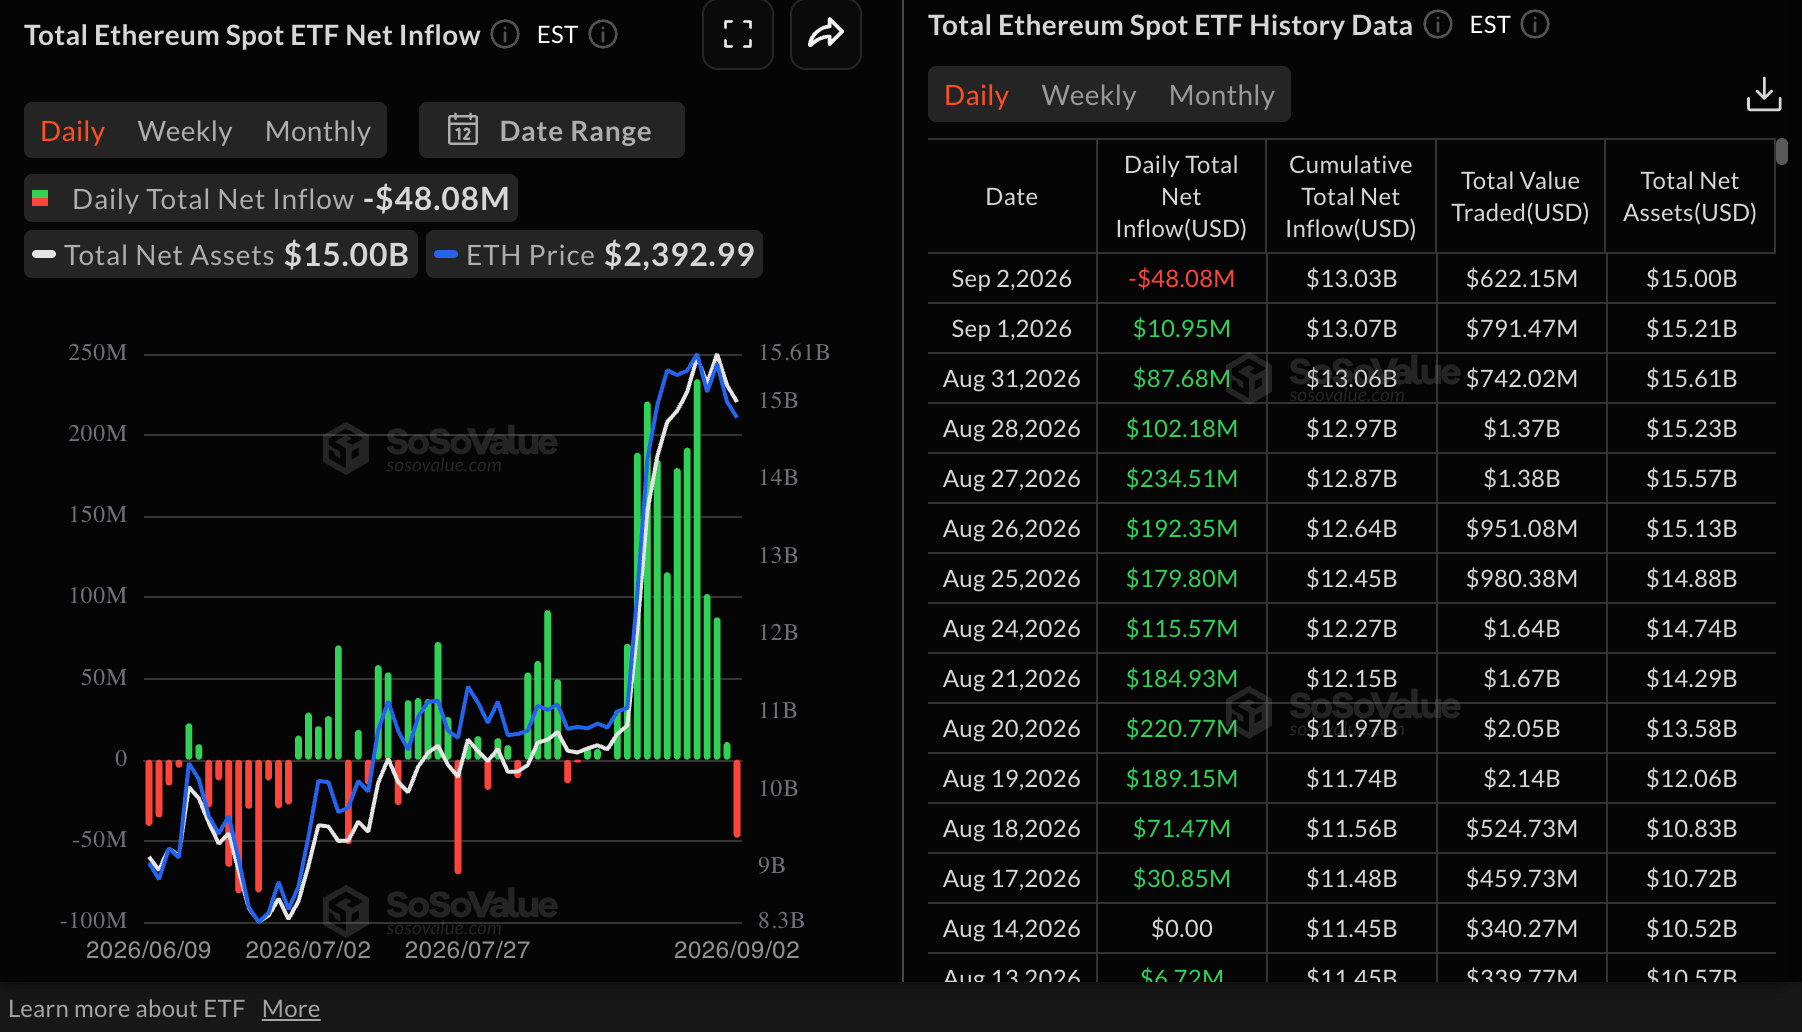
Ethereum spot ETFs turned bearish on Wednesday, with outflows amounting to $48 million. The pullback comes after 12 straight days of inflows. Cumulative inflows currently stand at $13 billion, with net assets under management at $15 billion.
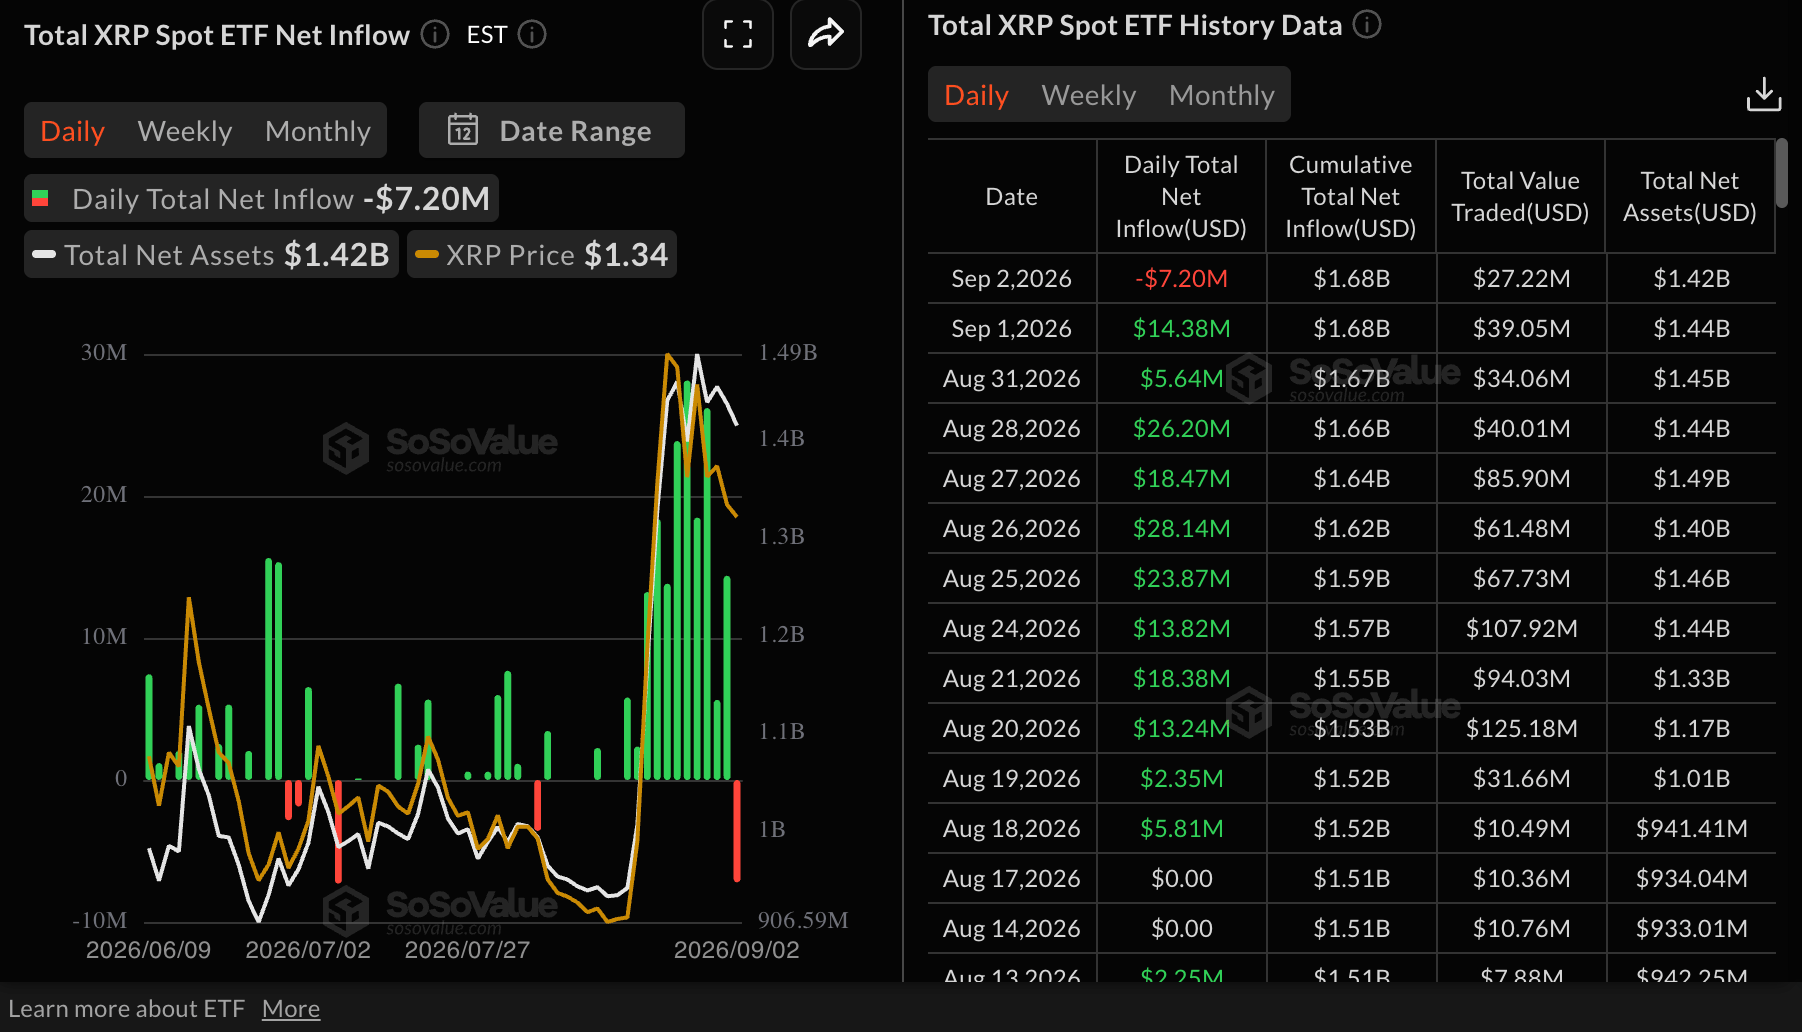
US-listed spot XRP ETFs similarly saw outflows totaling $7 billion on Wednesday, breaking 11 consecutive days of inflows, according to SoSoValue. Cumulative inflows are holding steady at $1.68 billion, with net assets under management at $1.42 billion.
If Ethereum and XRP continue to experience outflows, supply could weigh on price action, reducing the odds of sustained recovery. For now, positive market sentiment could cushion the tokens and prevent a sharp sell-off.
Technical analysis: Bitcoin rebounds as bulls return
Bitcoin trades near $78,000, extending its advance well above the main Exponential Moving Averages (EMAs), which now underpin a bullish near-term bias and suggest a firmly supported trend after the recent breakout.
At the same time, the Relative Strength Index (RSI) at 67 shows strong but not yet overbought momentum. By contrast, the Moving Average Convergence Divergence (MACD) indicator prints in negative territory, suggesting bullish pressure remains strong but is losing steam after the sharp run-up.
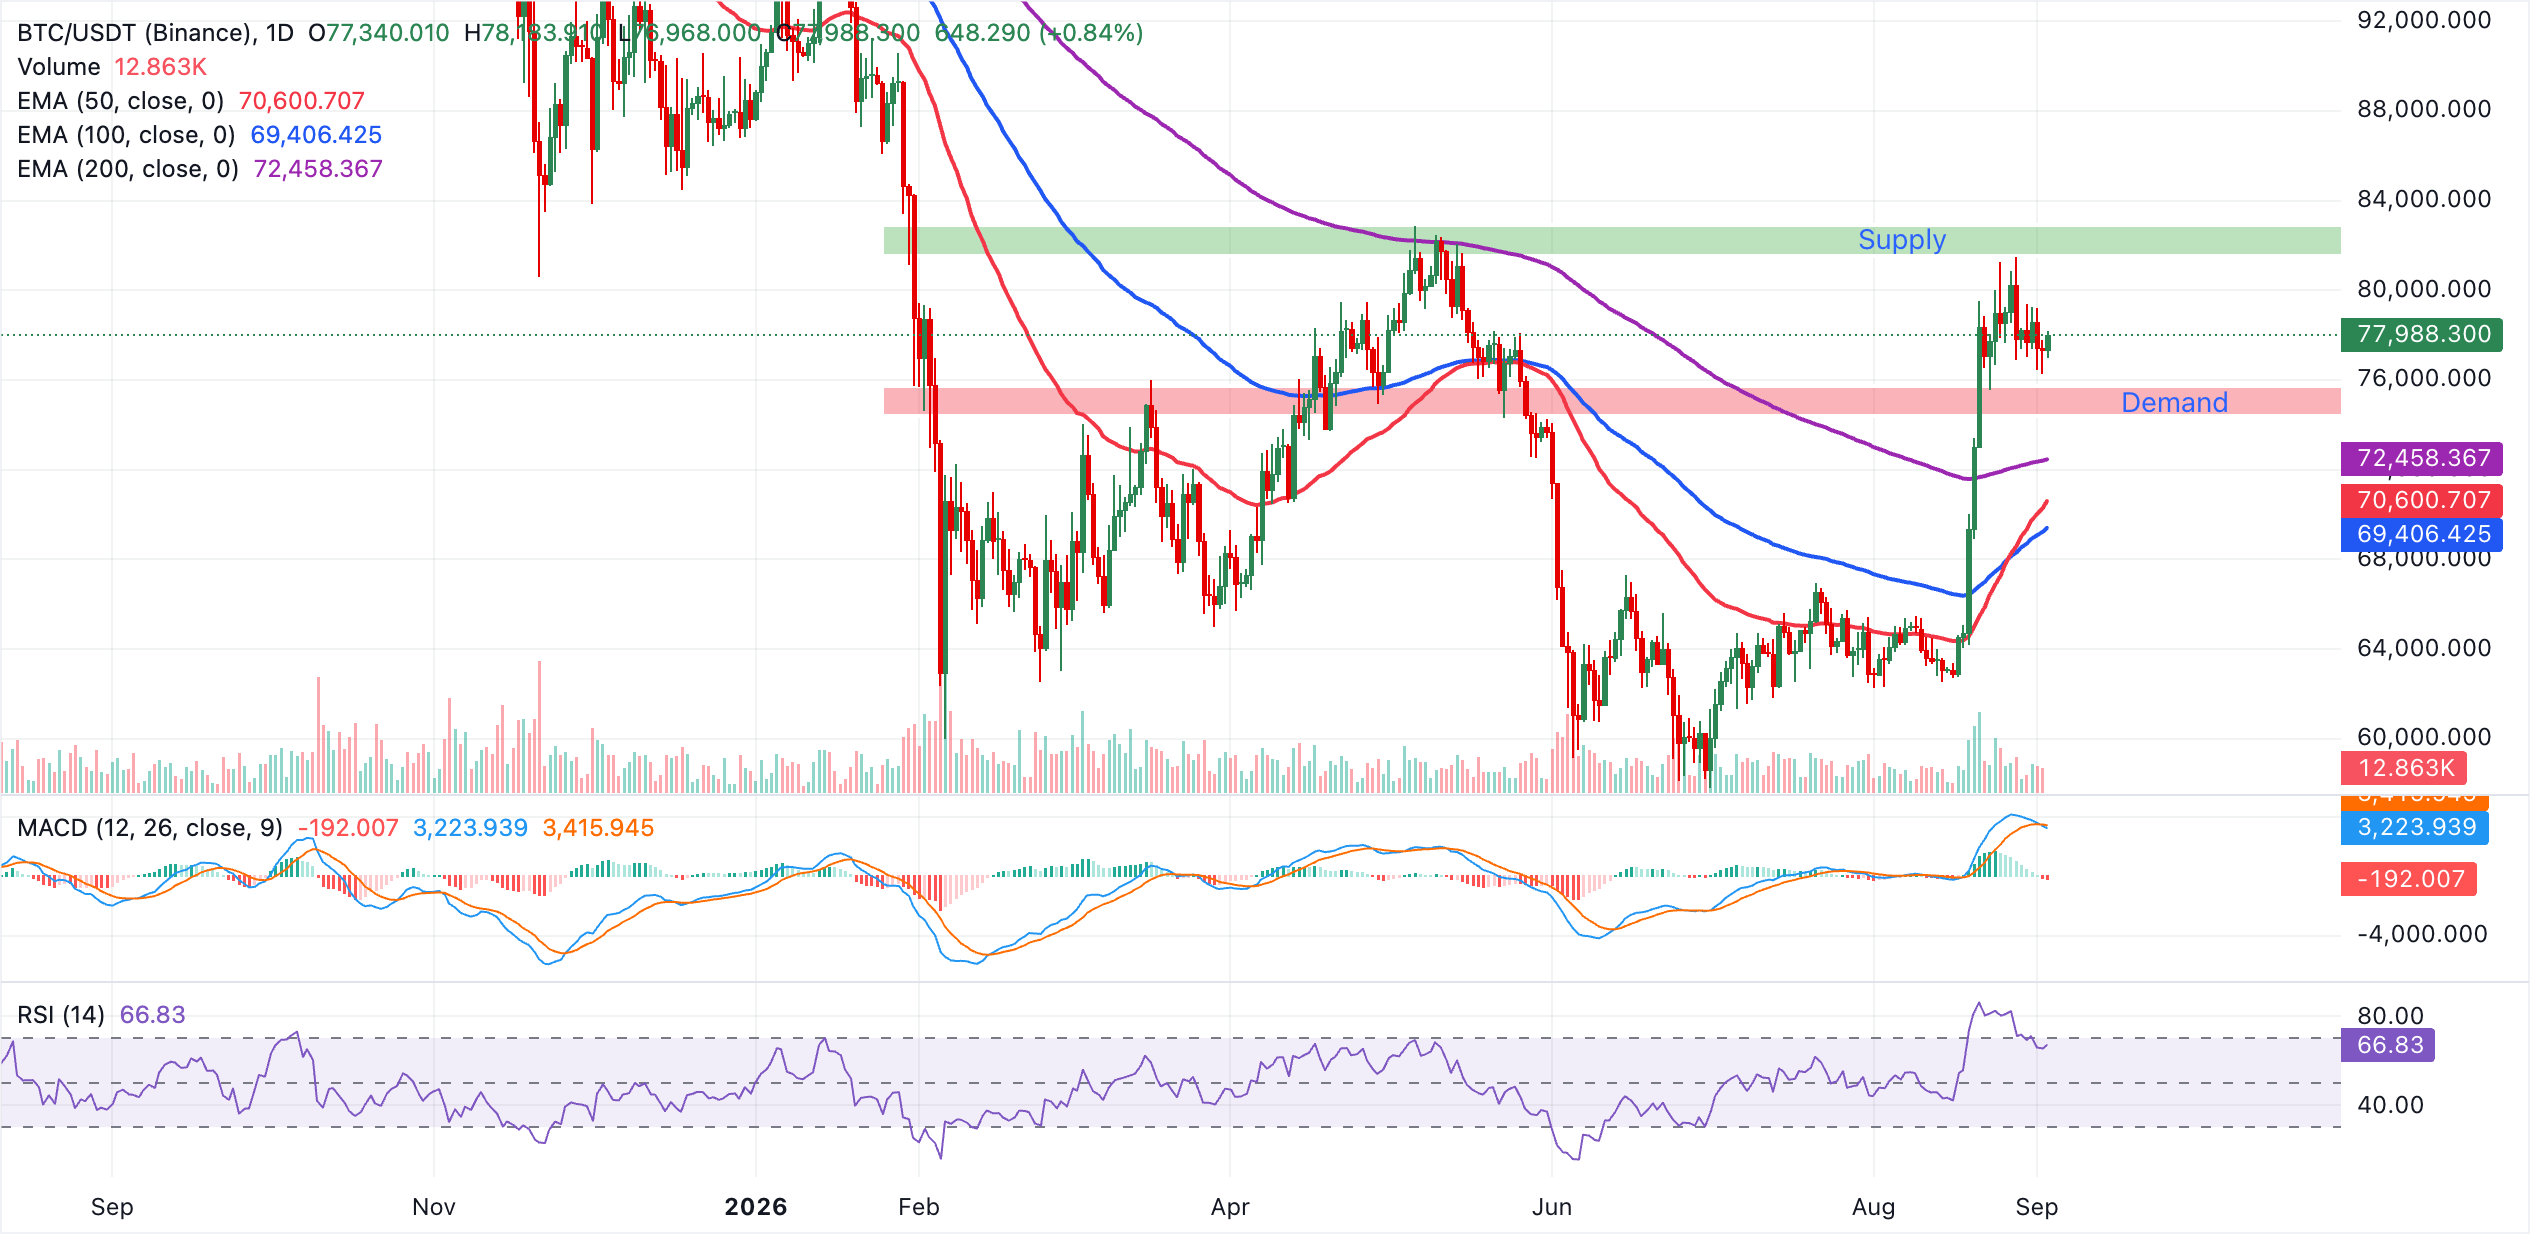
Immediate support is at the current pivot zone around $78,000, with a deeper corrective slide likely to target the 200-day EMA at $72,458 first. Below that, the 50-day EMA at $70,601 and the 100-day EMA at $69,406 form a broader demand cluster that should attract buyers on a more pronounced pullback while the broader trend remains constructive.
Altcoins technical outlook: Ethereum and XRP defend key support
Ethereum trades at $2,404, holding a clear bullish bias as price consolidates well above the short-, medium- and long-term EMAs, all reinforcing a supportive underlying trend despite the latest pullback from recent highs.
Momentum remains constructive, with the RSI around 62, suggesting positive but not extreme buying pressure, while the MACD shows the line below its signal and retreating, hinting at a cooling phase rather than a full-fledged reversal.
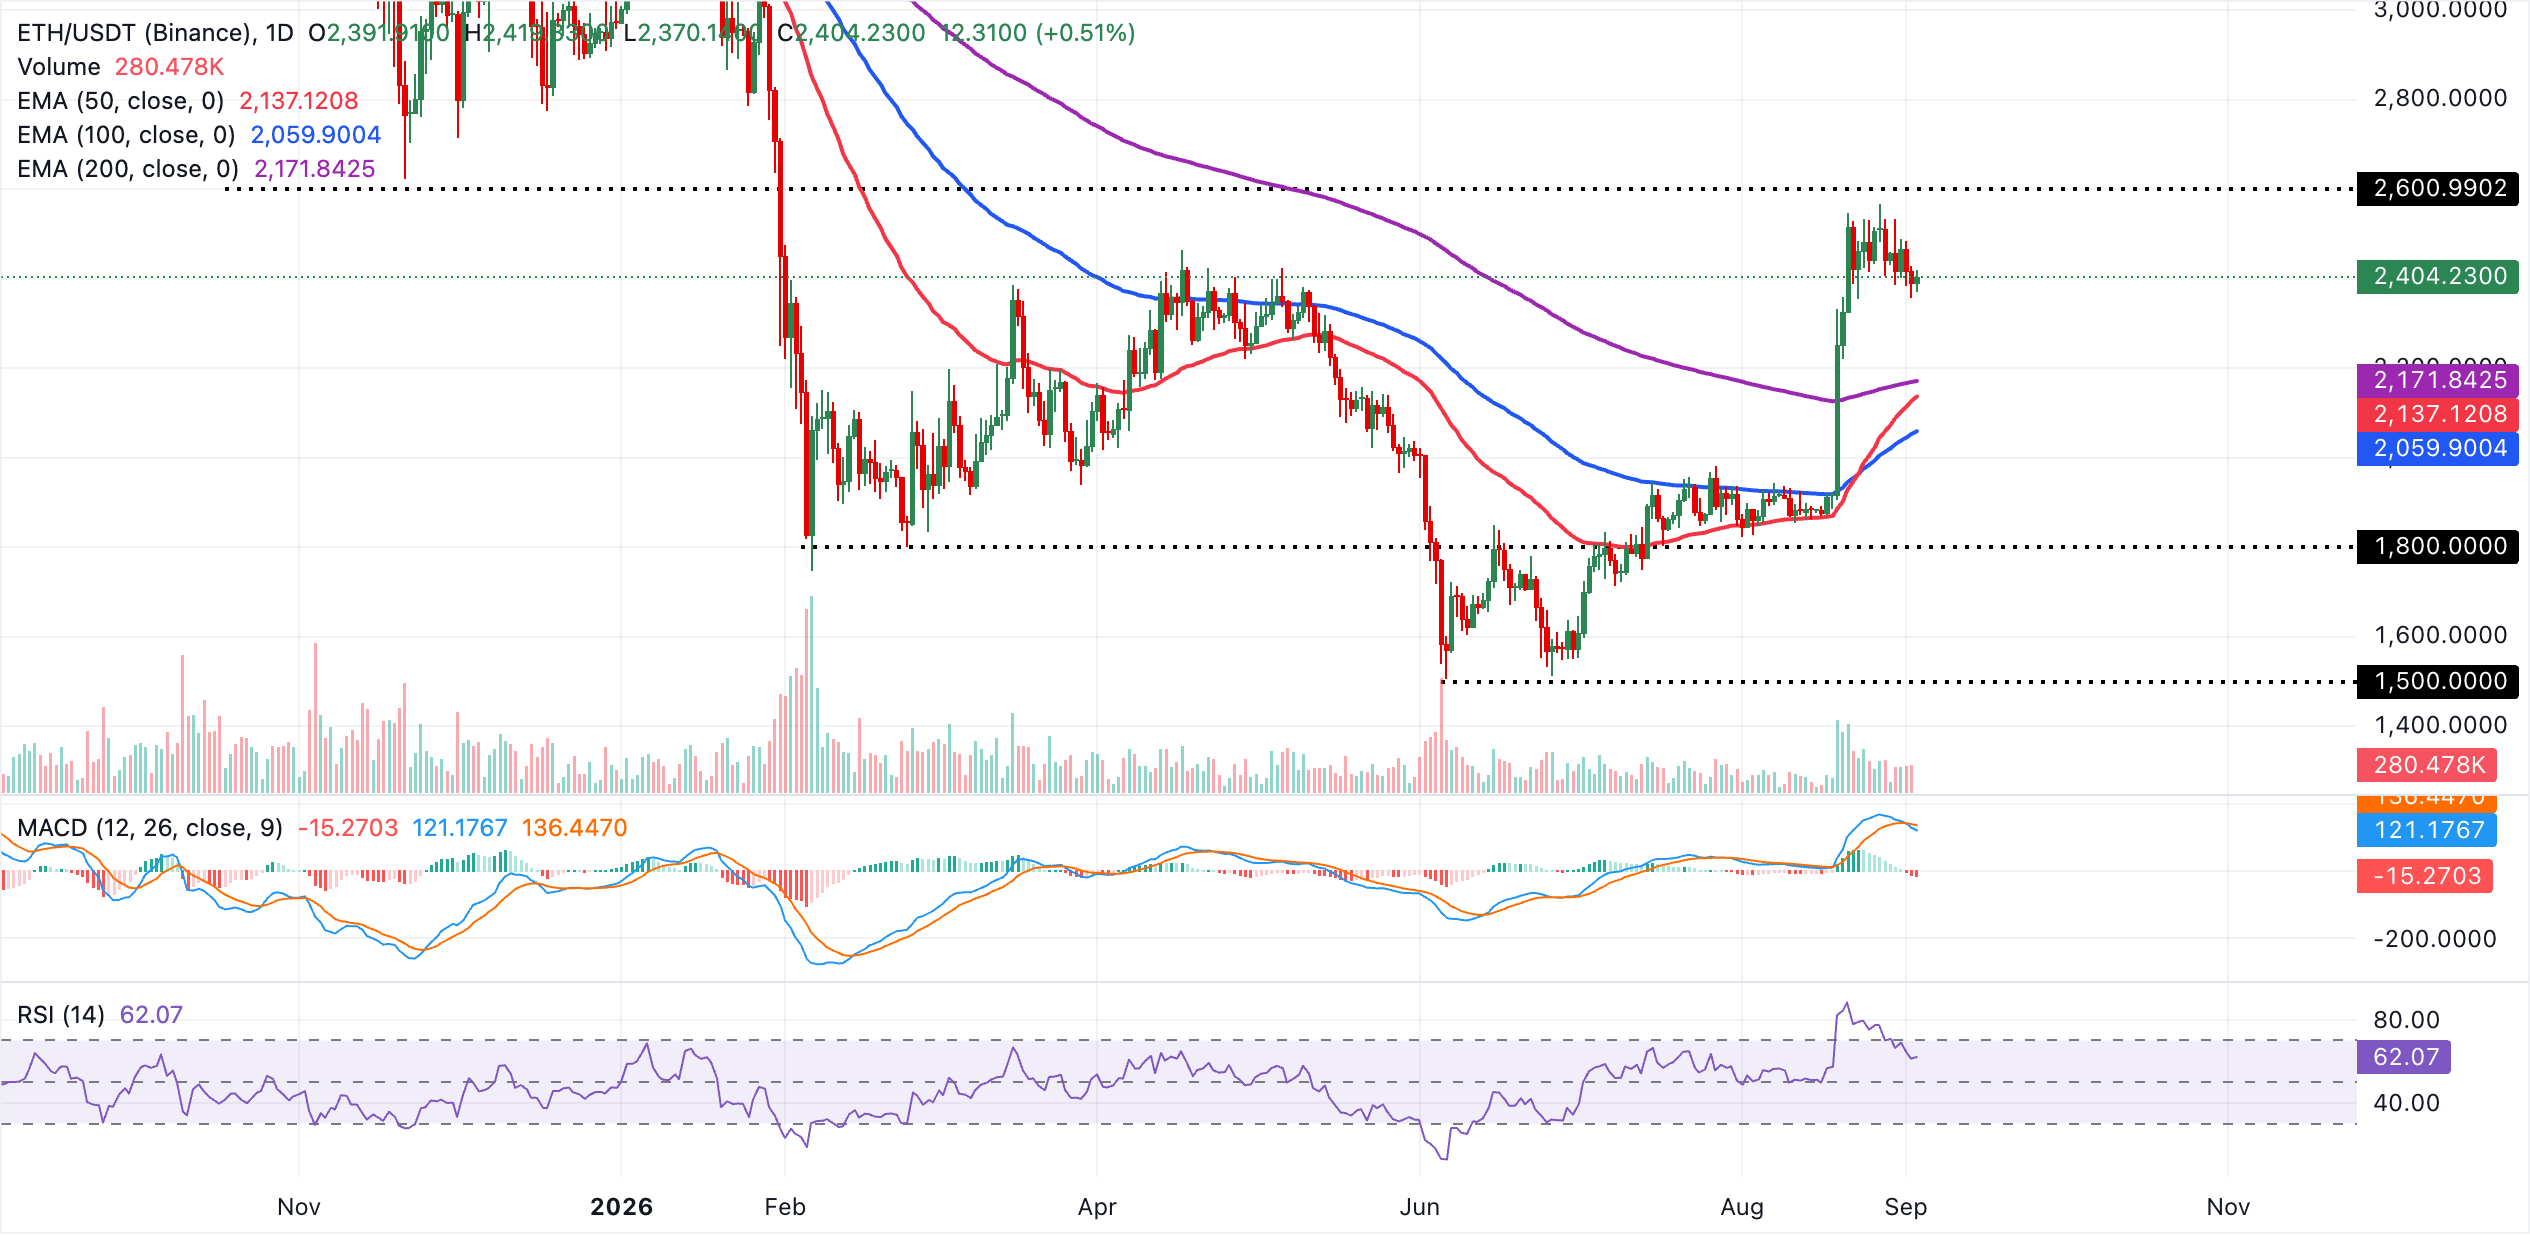
Immediate support lies at the current pivotal area around $2,400, followed by the 200-day EMA at $2,172, the 50-day EMA at $2,137 and the 100-day EMA at $2,060. As long as ETH holds above these clustered EMA supports, dips are likely to attract buying interest, keeping the broader path of least resistance pointed higher and leaving room for the pair to resume its advance once the current momentum consolidation runs its course.
As for XRP, the spot price hovers above $1.37 as bulls gain ground from support tested on Wednesday near $1.30. The pair also holds above major moving averages including the 50-day, 100-day and 200-day EMAs, which collectively suggest a constructive bullish bias in the near term.
The RSI near 60 hints at still-positive but moderated upside pressure after the recent overbought readings, while the MACD has slipped below its signal line and turned slightly negative, suggesting waning momentum rather than a full reversal at this stage.
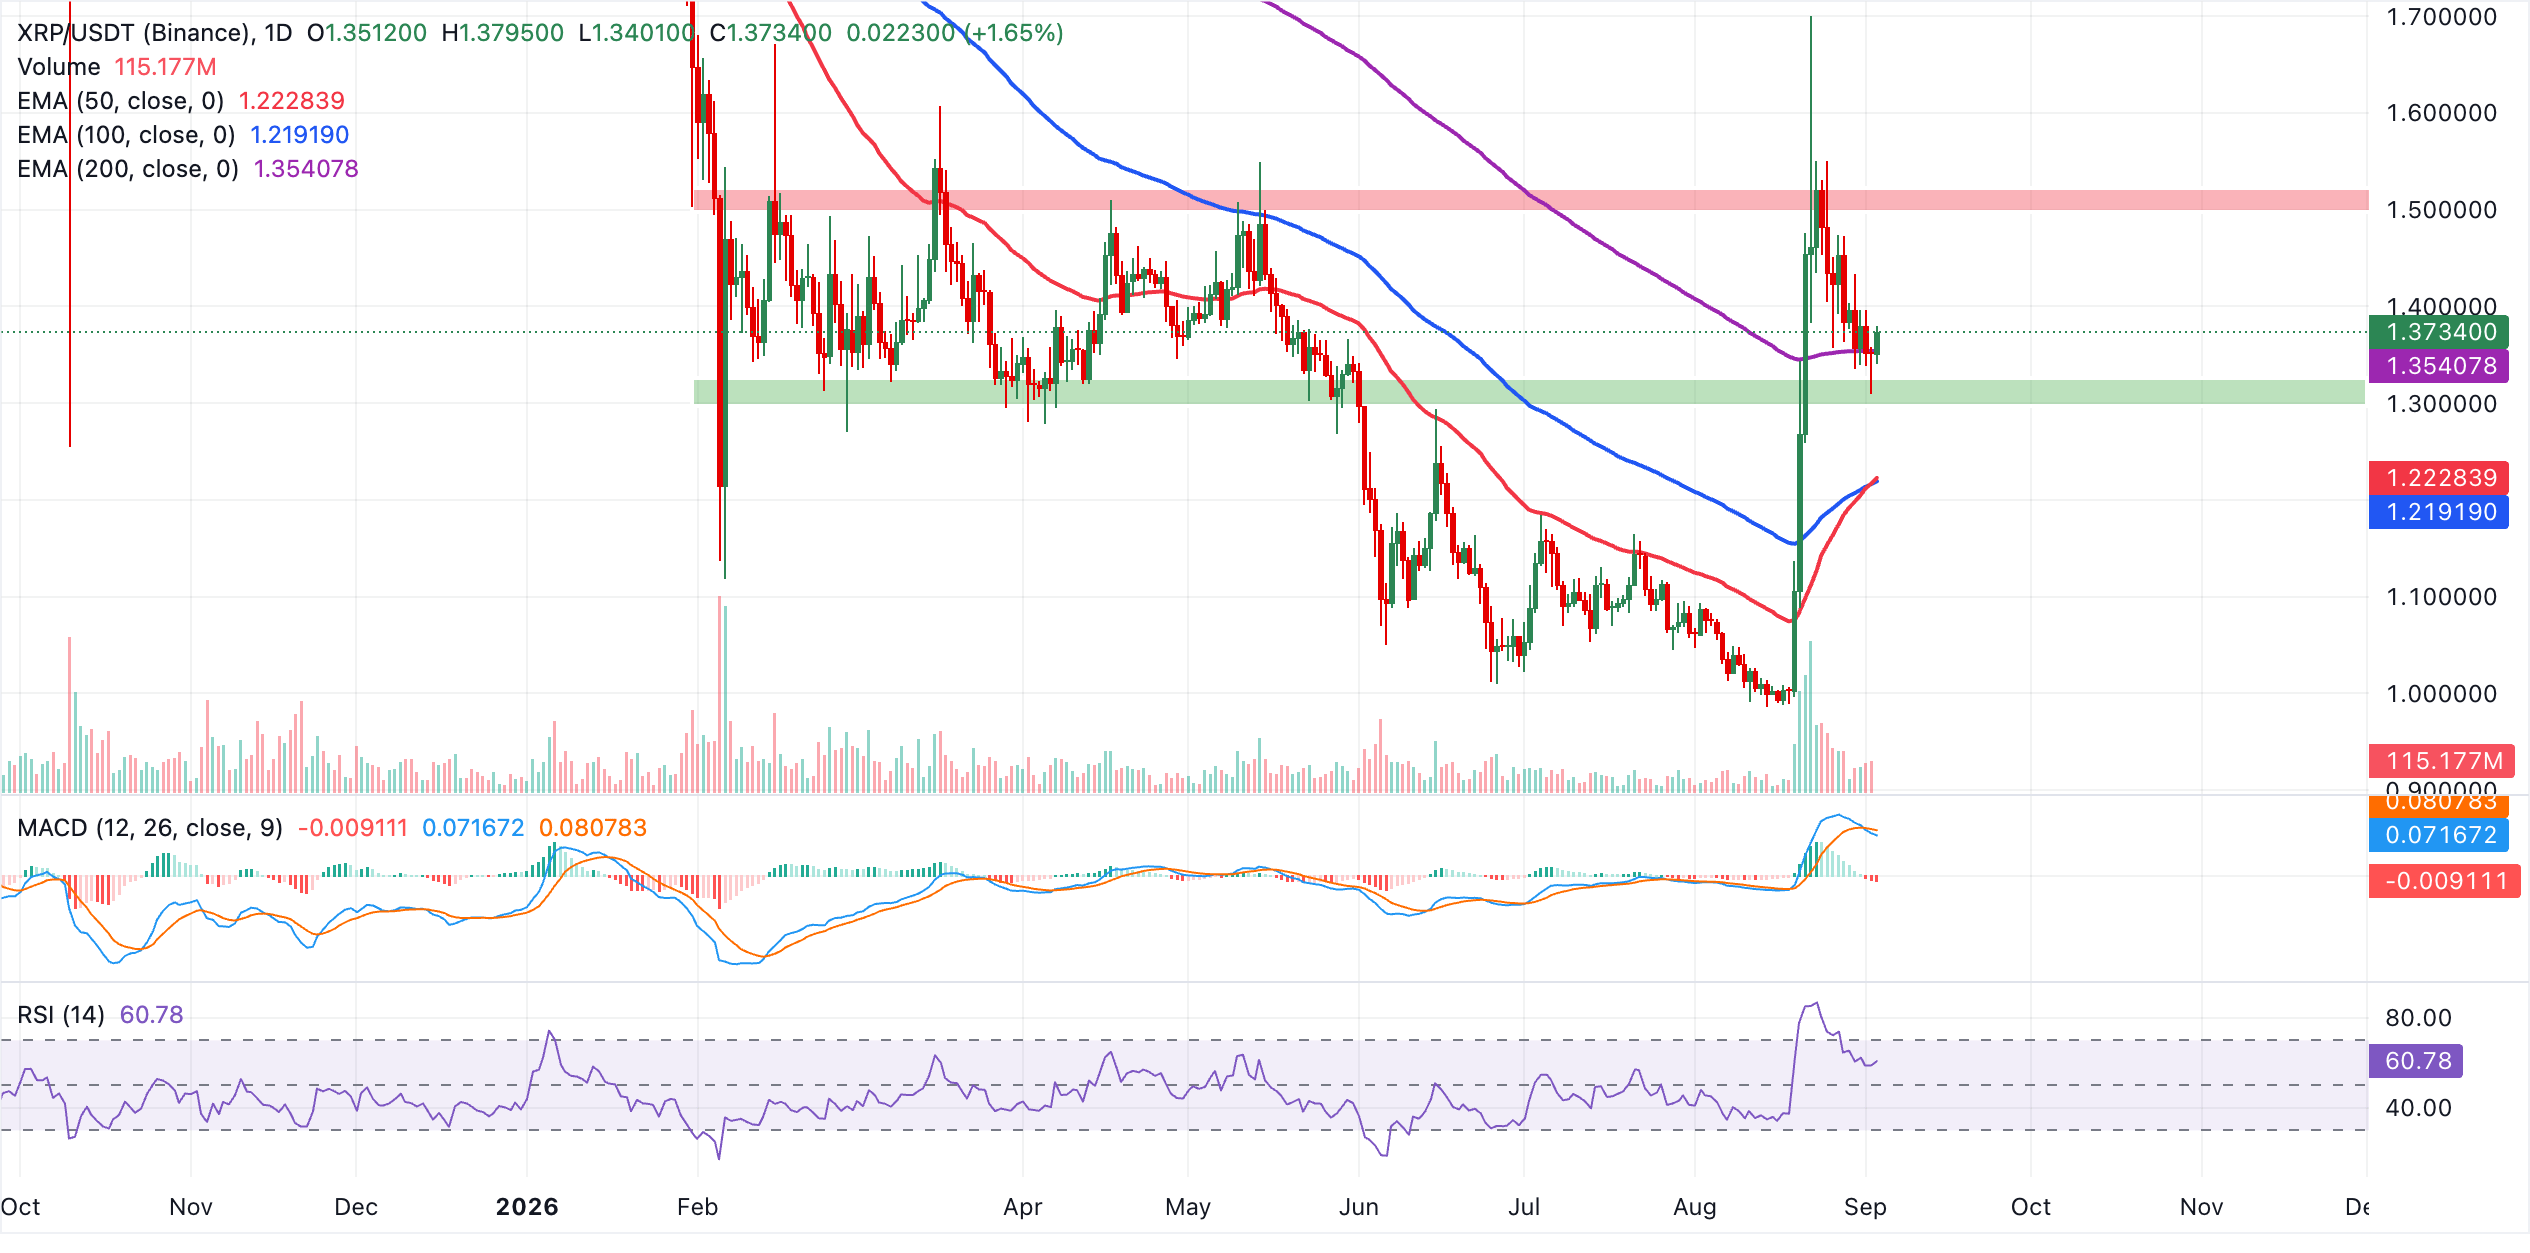
On the downside, initial support is at the 200-day EMA around $1.35, with a deeper floor near the confluence of the 50-day and 100-day EMAs in the $1.22 region should a larger pullback unfold. With no nearby overhead indicator-defined resistance on the daily chart, price action around $1.37 itself functions as a short-term pivot, and a sustained hold above the 200-day EMA would keep the bullish bias intact, while a daily close below that level would open the door for a test of the mid-$1.20s support cluster.
(The technical analysis of this story was written with the help of an AI tool. Know more.)
Crypto ETF FAQs
An Exchange-Traded Fund (ETF) is an investment vehicle or an index that tracks the price of an underlying asset. ETFs can not only track a single asset, but a group of assets and sectors. For example, a Bitcoin ETF tracks Bitcoin’s price. ETF is a tool used by investors to gain exposure to a certain asset.
Yes. The first Bitcoin futures ETF in the US was approved by the US Securities & Exchange Commission in October 2021. A total of seven Bitcoin futures ETFs have been approved, with more than 20 still waiting for the regulator’s permission. The SEC says that the cryptocurrency industry is new and subject to manipulation, which is why it has been delaying crypto-related futures ETFs for the last few years.
Yes. The SEC approved in January 2024 the listing and trading of several Bitcoin spot Exchange-Traded Funds, opening the door to institutional capital and mainstream investors to trade the main crypto currency. The decision was hailed by the industry as a game changer.
The main advantage of crypto ETFs is the possibility of gaining exposure to a cryptocurrency without ownership, reducing the risk and cost of holding the asset. Other pros are a lower learning curve and higher security for investors since ETFs take charge of securing the underlying asset holdings. As for the main drawbacks, the main one is that as an investor you can’t have direct ownership of the asset, or, as they say in crypto, “not your keys, not your coins.” Other disadvantages are higher costs associated with holding crypto since ETFs charge fees for active management. Finally, even though investing in ETFs reduces the risk of holding an asset, price swings in the underlying cryptocurrency are likely to be reflected in the investment vehicle too.
추천 기사


