


Bitcoin Price Forecast: BTC steadies as markets turn cautious ahead of key economic data
- Bitcoin steadies around $77,700 on Thursday, trading sideways as markets await the next directional move.
- Mixed ETF inflows and outflows recorded so far this week suggest indecision among institutional demand.
- Traders remain cautious ahead of Friday’s US NFP report, which could provide fresh clues on the Federal Reserve’s policy path and determine Bitcoin’s next directional move.
Bitcoin (BTC) steadies around $77,700 on Thursday, trading sideways after its sharp rally during the second half of August. Institutional demand supports this range-bound price action, with spot Exchange Traded Funds (ETFs) recording mixed flows so far this week. Market participants remain cautious ahead of key economic data on Friday, which could provide fresh clues on the Federal Reserve’s (Fed) policy path and determine the Crypto King’s next directional move.
Mixed sentiment among investors
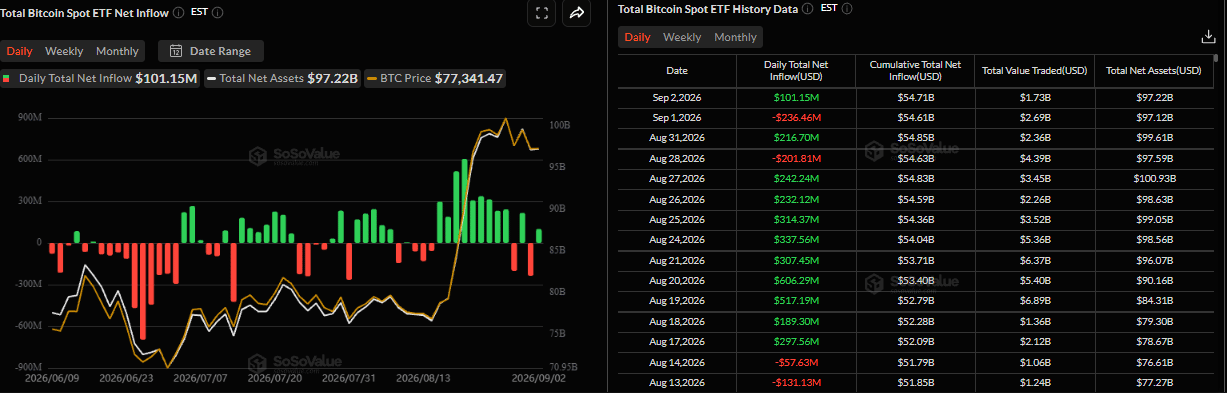
Institutional demand for BTC remains mixed so far this week. SoSoValue data showed that spot BTC ETFs recorded inflows on Monday and Wednesday, $216.70 million and $101.15 million, respectively, while outflows of $201.81 million last Friday and $236.46 million this Tuesday. These mixed flows reflect cautious institutional positioning amid the growing geopolitical tensions. Moreover, if the outflow trend resumes and intensifies, BTC could see further correction.
Investors await key US NFP data
Bitcoin price action suggests traders are trading carefully and may wait for the release of the crucial US Nonfarm Payrolls (NFP) report on Friday, which will provide more cues on the Fed’s future policy path and help determine the next leg of BTC's directional move.
On the geopolitical front, US-Iran tensions kept risk appetite tight. US President Donald Trump said on Wednesday that he is prepared to launch another attack on Iran. However, The Wall Street Journal also reported the same day that he is privately discussing declaring an end to the war with Iran. These conflicting signals, coupled with continued clashes over the Strait of Hormuz, keep the geopolitical risk premium in play, which should continue to support oil prices and the US Dollar (USD), thereby capping BTC upside.
Meanwhile, investors remain worried that elevated energy prices will rekindle inflationary pressures and force major central banks, including the Fed, to adopt a more hawkish stance. Adding to this, Fed Chair Kevin Warsh’s comments at the Jackson Hole Symposium last Friday continue to fuel expectations of an interest rate hike in September.
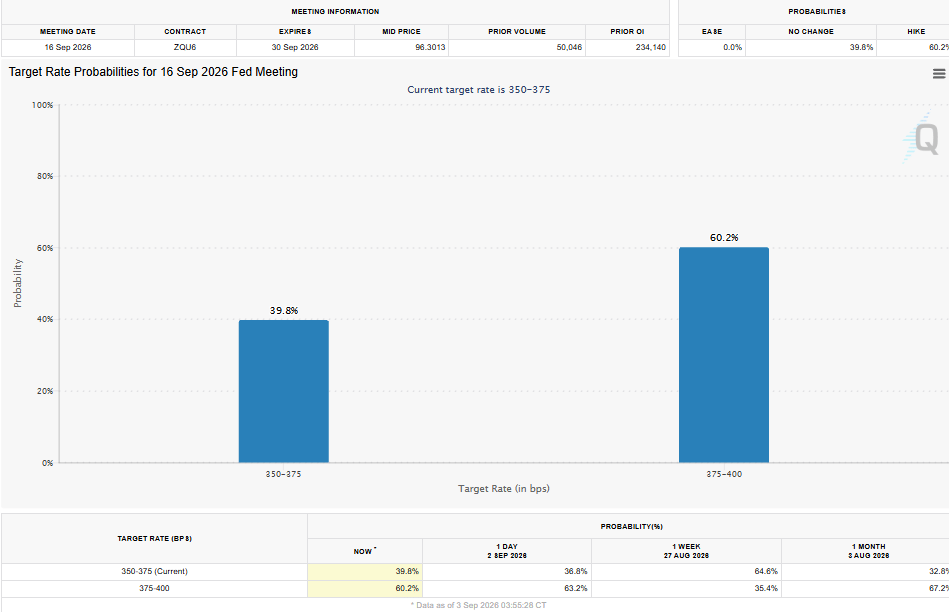
According to CME Group’s FedWatch Tool, traders are now pricing in around a 60.2% chance that the Fed will raise borrowing costs at the upcoming policy meeting on September 15-16, up from 41.43% last week on Monday.
Bitcoin technical outlook: Consolidation after massive rally
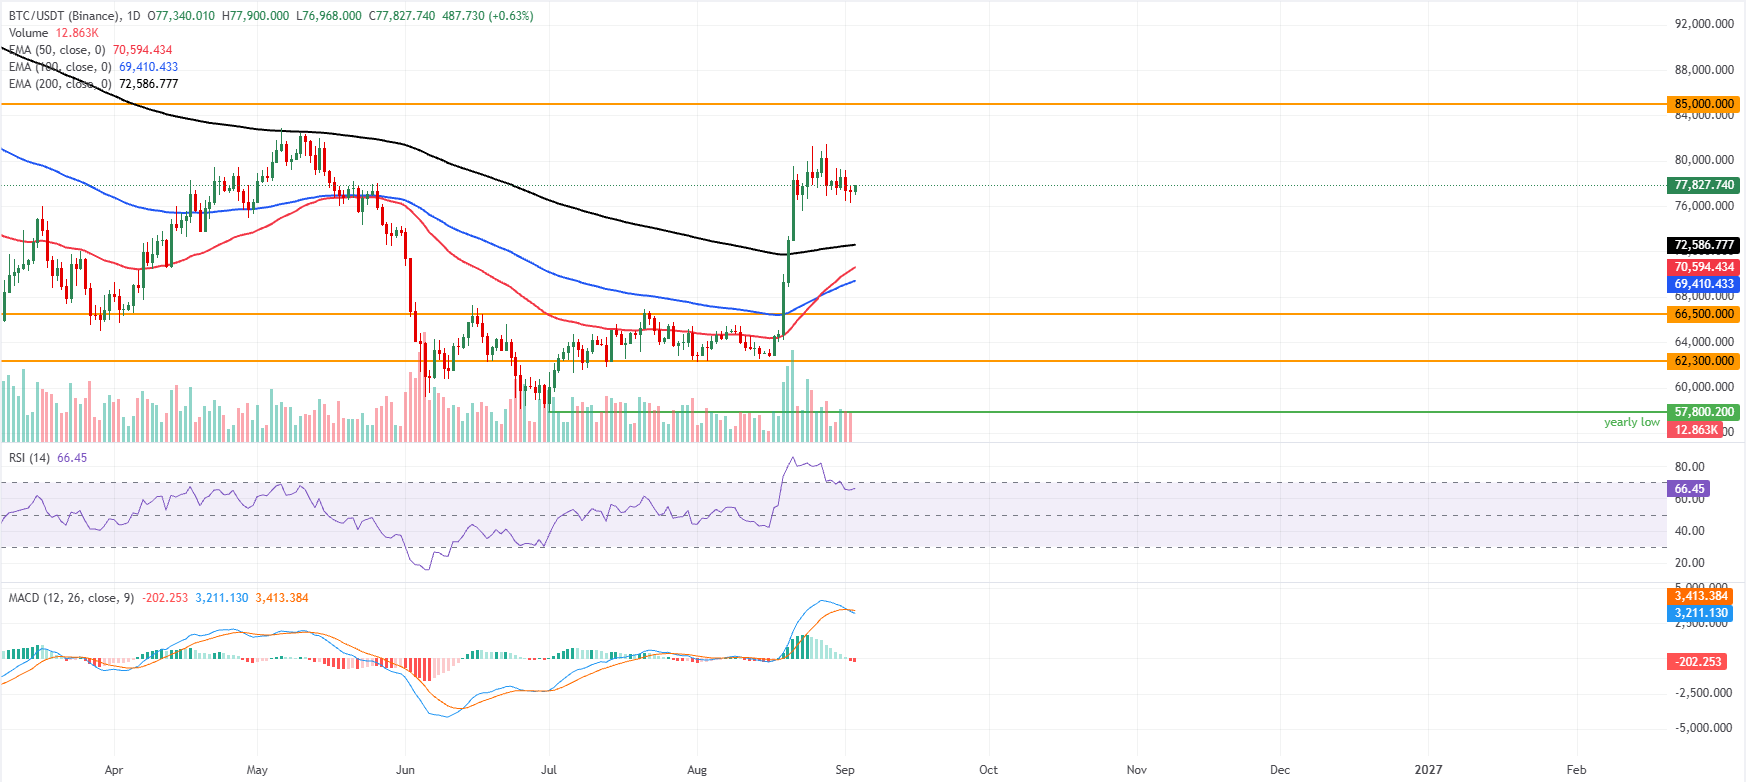
Bitcoin trades at $77,827 on Thursday, moving sideways after its recent rally in the second half of August. Despite this consolidation, BTC holds a bullish near-term bias as price remains comfortably above the 50-day, 100-day, and 200-day Exponential Moving Averages (EMAs) clustered between roughly $69,400 and $72,600.
This configuration suggests the broader uptrend remains supported, even as the Relative Strength Index (RSI) near 66 hints at moderating momentum after recent overbought readings. In contrast, the latest Moving Average Convergence Divergence (MACD) reading has retreated further, reinforcing the idea of short-term consolidation within an overall constructive structure.
On the downside, immediate support is at the 200-day EMA near $72,586, followed by the 50-day EMA at $70,594 and the 100-day EMA near $69,410, before a more substantive horizontal floor at $66,500 and then $62,300.
On the topside, the next key obstacle is the horizontal resistance at $85,000, and a sustained break above this level would likely reopen the path toward fresh highs. At the same time, failure to overcome it could keep BTC consolidating above its stacked EMA support band.
(The technical analysis of this story was written with the help of an AI tool. Know more.)
Bitcoin, altcoins, stablecoins FAQs
Bitcoin is the largest cryptocurrency by market capitalization, a virtual currency designed to serve as money. This form of payment cannot be controlled by any one person, group, or entity, which eliminates the need for third-party participation during financial transactions.
Altcoins are any cryptocurrency apart from Bitcoin, but some also regard Ethereum as a non-altcoin because it is from these two cryptocurrencies that forking happens. If this is true, then Litecoin is the first altcoin, forked from the Bitcoin protocol and, therefore, an “improved” version of it.
Stablecoins are cryptocurrencies designed to have a stable price, with their value backed by a reserve of the asset it represents. To achieve this, the value of any one stablecoin is pegged to a commodity or financial instrument, such as the US Dollar (USD), with its supply regulated by an algorithm or demand. The main goal of stablecoins is to provide an on/off-ramp for investors willing to trade and invest in cryptocurrencies. Stablecoins also allow investors to store value since cryptocurrencies, in general, are subject to volatility.
Bitcoin dominance is the ratio of Bitcoin's market capitalization to the total market capitalization of all cryptocurrencies combined. It provides a clear picture of Bitcoin’s interest among investors. A high BTC dominance typically happens before and during a bull run, in which investors resort to investing in relatively stable and high market capitalization cryptocurrency like Bitcoin. A drop in BTC dominance usually means that investors are moving their capital and/or profits to altcoins in a quest for higher returns, which usually triggers an explosion of altcoin rallies.
추천 기사


