


Dow Jones Industrial Average sells the best outlook since 1983
- DJIA trades near 53,050, more than 400 points lower and 3% under the record.
- Philadelphia Fed six-month outlook at 73.6, its highest since August 1983.
- Thirty-year yield back above 5.25%, erasing the buyback relief in one session.
The Dow Jones Industrial Average trades near 53,050, more than 400 points lower on the session, after two of the strongest American data points of the month arrived in the same 12:30 GMT block and were sold on delivery. Manufacturing in the mid-Atlantic region printed a five-year high with a six-month outlook at its best since August 1983, and weekly jobless claims came in at 206K against a 210K consensus and a 212K prior. Neither is a soft number, which is exactly the problem.
The best six months since 1983, on paper
The Philadelphia Fed's current activity index rose to 47.4 in August from 41.4, against a consensus of 25, making it the largest surprise on the release page by a distance. The forward-looking components did more work than the headline. Six-month general activity jumped 39 points to 73.6, the highest reading since August 1983, with future new orders at 66.0 and future shipments at 63.5, each the best in more than five years.
What travels alongside that optimism is the reason the tape declined to pay for it. Future prices paid rose 6 points to 62.9 and future prices received rose 18 points to 59.8, both back above their long-run averages, so the firms expecting their best half-year in four decades also expect to pay more and charge more. Nominal expansion is a bond problem before it is an earnings gift.
A rescue with a one-day shelf life
Yesterday's relief in the long end lasted exactly one session, with the thirty-year yield back above 5.25% and the ten-year near 4.70%, each more than five basis points higher. That returns the curve to roughly where it sat before the Treasury said it would at least double its longer-dated buyback operations to 4 billion Dollars from 2 billion. The Treasury Secretary spent the morning promising the operations could run larger and offering to make a market in the maturities that have been selling off.
Yields rose anyway, which is the available verdict on a 4 billion Dollar ceiling set against a federal debt that passed 40 trillion Dollars on Wednesday. The operation rearranges the maturity schedule rather than reducing anything, and the first larger purchase does not run until September 9. An issuer obliged to advertise demand for its own paper on two consecutive days is telling the equity market what the discount rate intends to do.
Who is paying for the optimism
Walmart (WMT) trades close to 9% lower after United States comparable sales rose 2.6% against a 3.8% estimate, the first shortfall of that kind in more than five years, with third-quarter and full-year adjusted earnings guidance landing short as well. Profit and revenue both beat. The miss was in traffic, which management traced to households under financial strain and to what those households are paying at the pump.
As an index member the decline is worth roughly 60 index points, around a seventh of the session move, so the retailer is the headline rather than the cause. It is the third consecutive reading on the same household, after July retail sales fell 0.6% and preliminary August sentiment collapsed to 51.
Crude Oil is 2% higher into that, West Texas Intermediate just short of $88.00 and Brent above $93.50, after Washington promised its most aggressive sanctions campaign yet against Tehran and threatened consequences for any country supplying a lifeline. The bid in the barrel and the missing trip to the store are one story read from opposite ends.
Friday's surveys test which economy is real
Preliminary August Purchasing Managers Index (PMI) readings land Friday at 13:45 GMT, and the consensus has both halves easing, manufacturing at 53.8 from 53.9 and services at 54 from 54.6, against a composite prior of 54.5. The services line carries the red band. It is the direct test of the split this session priced, with one survey putting factories at a five-year high and the largest American retailer reporting fewer visits.
A regional Fed president without a vote this year spoke at 15:10 GMT, and the index shed roughly 200 points from its afternoon high inside the following half hour, on remarks the calendar scored exactly as hawkish as that speaker's own average. His argument was that raising rates now spares the committee a larger move later, and that what he recommends in September depends on the data. Friday is the data.
Dow Jones Industrial Average technical levels
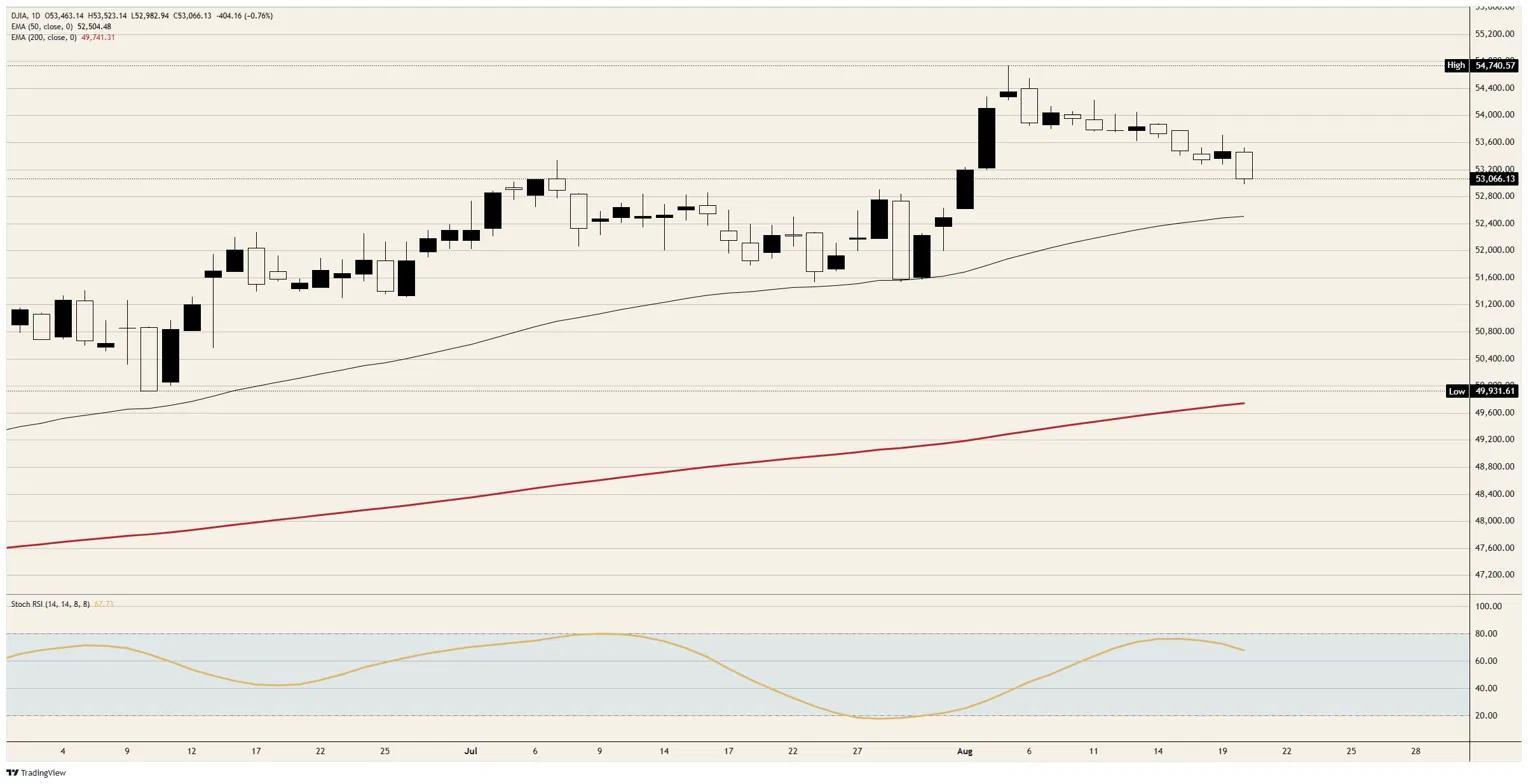
Resistance: The 53,200 area capped two separate recovery attempts through the afternoon, with the session high just above 53,500 beyond it and the 53,800 ceiling that has held since August 14 above that. The record just short of 54,750 remains the ceiling, roughly 3% above spot.
Support: The 53,000 handle is the line, with the session low printing just beneath it around midday. A daily close under 53,000 opens 52,750 and then the 50-day Exponential Moving Average (EMA) near 52,500, which has not been touched since late July.
Bias: Bearish. The daily Stochastic Relative Strength Index (Stoch RSI) near 68 is rolling over out of the upper band with no new high beneath it since August 5, and the 5-minute reading near 25 is the only argument for a bounce first. Invalidation on a daily close back above 53,500.
Dow Jones daily chart
Dow Jones FAQs
The Dow Jones Industrial Average, one of the oldest stock market indices in the world, is compiled of the 30 most traded stocks in the US. The index is price-weighted rather than weighted by capitalization. It is calculated by summing the prices of the constituent stocks and dividing them by a factor, currently 0.152. The index was founded by Charles Dow, who also founded the Wall Street Journal. In later years it has been criticized for not being broadly representative enough because it only tracks 30 conglomerates, unlike broader indices such as the S&P 500.
Many different factors drive the Dow Jones Industrial Average (DJIA). The aggregate performance of the component companies revealed in quarterly company earnings reports is the main one. US and global macroeconomic data also contributes as it impacts on investor sentiment. The level of interest rates, set by the Federal Reserve (Fed), also influences the DJIA as it affects the cost of credit, on which many corporations are heavily reliant. Therefore, inflation can be a major driver as well as other metrics which impact the Fed decisions.
Dow Theory is a method for identifying the primary trend of the stock market developed by Charles Dow. A key step is to compare the direction of the Dow Jones Industrial Average (DJIA) and the Dow Jones Transportation Average (DJTA) and only follow trends where both are moving in the same direction. Volume is a confirmatory criteria. The theory uses elements of peak and trough analysis. Dow’s theory posits three trend phases: accumulation, when smart money starts buying or selling; public participation, when the wider public joins in; and distribution, when the smart money exits.
There are a number of ways to trade the DJIA. One is to use ETFs which allow investors to trade the DJIA as a single security, rather than having to buy shares in all 30 constituent companies. A leading example is the SPDR Dow Jones Industrial Average ETF (DIA). DJIA futures contracts enable traders to speculate on the future value of the index and Options provide the right, but not the obligation, to buy or sell the index at a predetermined price in the future. Mutual funds enable investors to buy a share of a diversified portfolio of DJIA stocks thus providing exposure to the overall index.
추천 기사


