


Dogecoin Price Forecast: DOGE bolts toward $0.08 breakout
- Dogecoin gains over 3% on Thursday, as bulls target a short-term $0.080 breakout.
- The derivatives market records a steady increase in perpetual Open Interest to 17.21 billion DOGE.
- The RSI indicator shows a stretched Dogecoin recovery while the 100-day EMA caps the immediate upside.
Dogecoin (DOGE) gains momentum for the second consecutive day, trading at $0.078 at the time of writing on Thursday. The meme coin is up more than 3% on the day, reflecting positive market sentiment as Bitcoin (BTC) rallies above $70,000 and Ethereum (ETH) climbs above $2,200.
Dogecoin derivatives expand
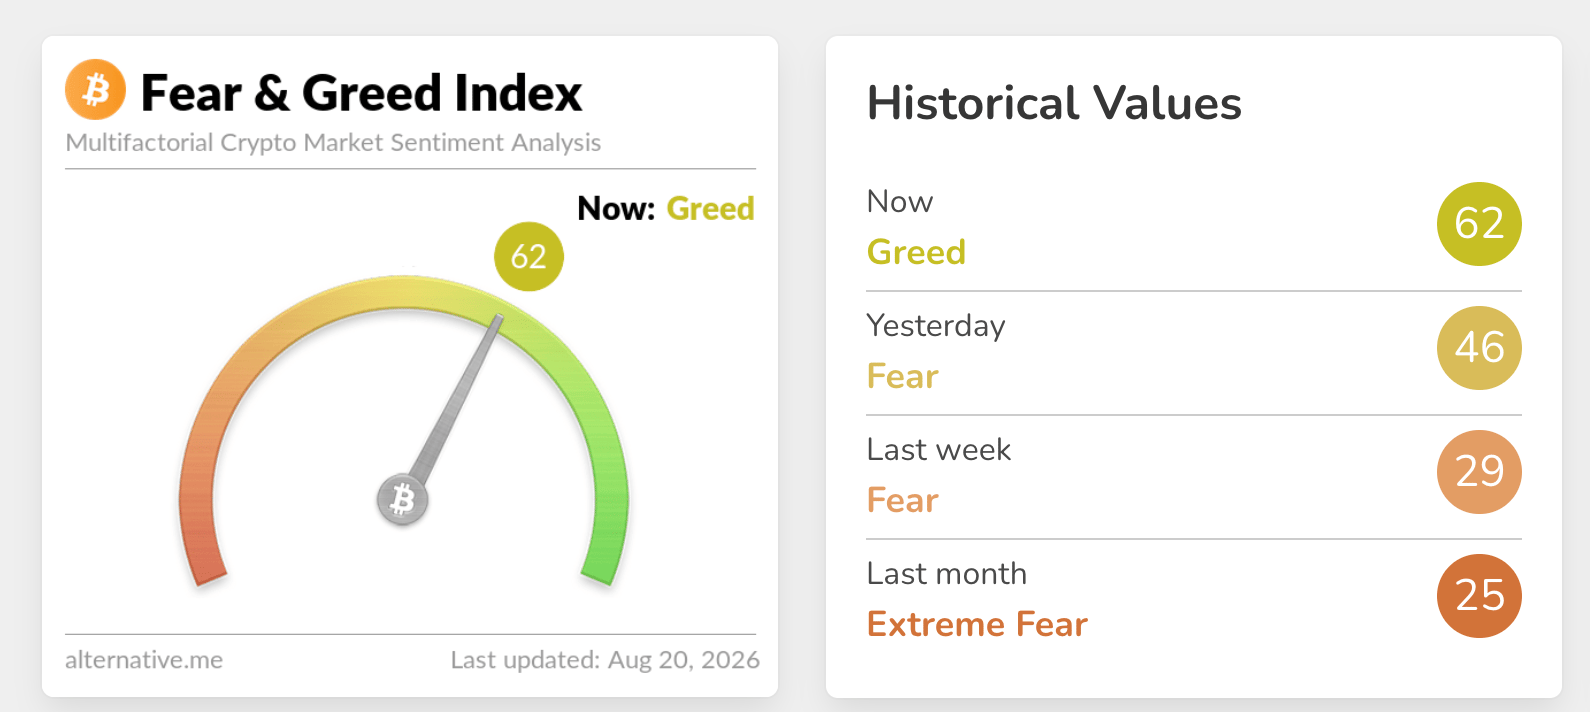
The crypto Fear & Greed Index is currently embedded in the Greed territory at 62, up from 46 the day before. If it holds, rising risk-on sentiment could boost Dogecoin’s outlook.
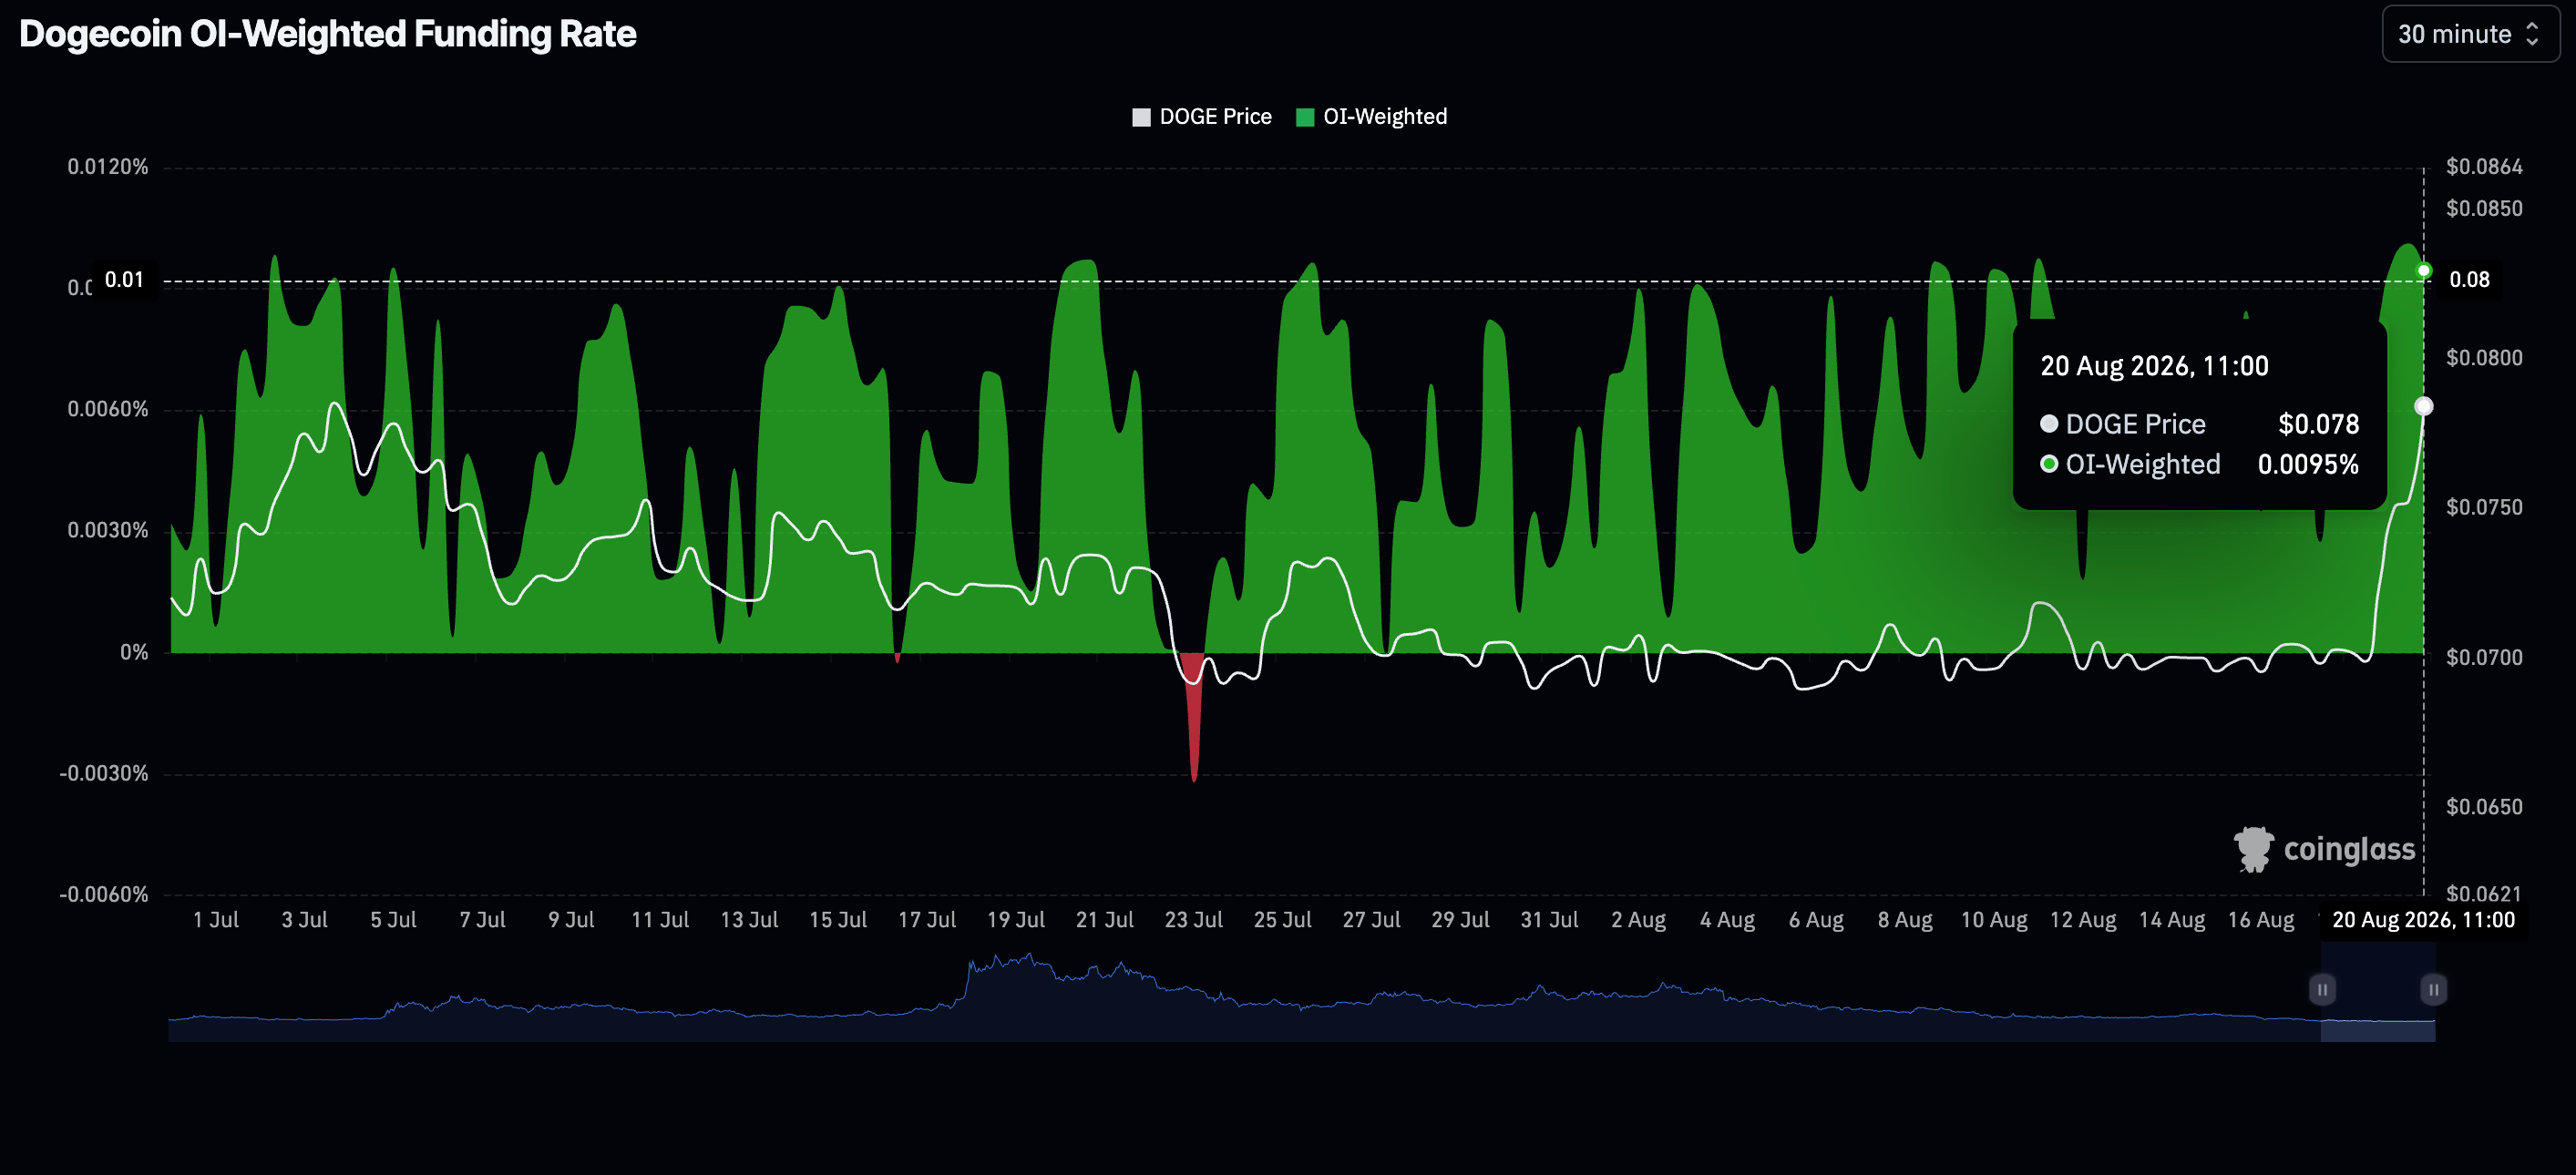
Retail investors are becoming increasingly exposed to the meme coin, as perpetual futures Open Interest (OI) Weighted Funding Rate held at 0.0096% on Thursday, down slightly from 0.0101% the previous day.
Positive, higher weighted funding rates suggest the bullish outlook is affirmed. However, traders should temper their expectations because if Dogecoin fails to break near-term hurdles, a correction could ensue, weighed by profit-taking and possible buyer exhaustion.
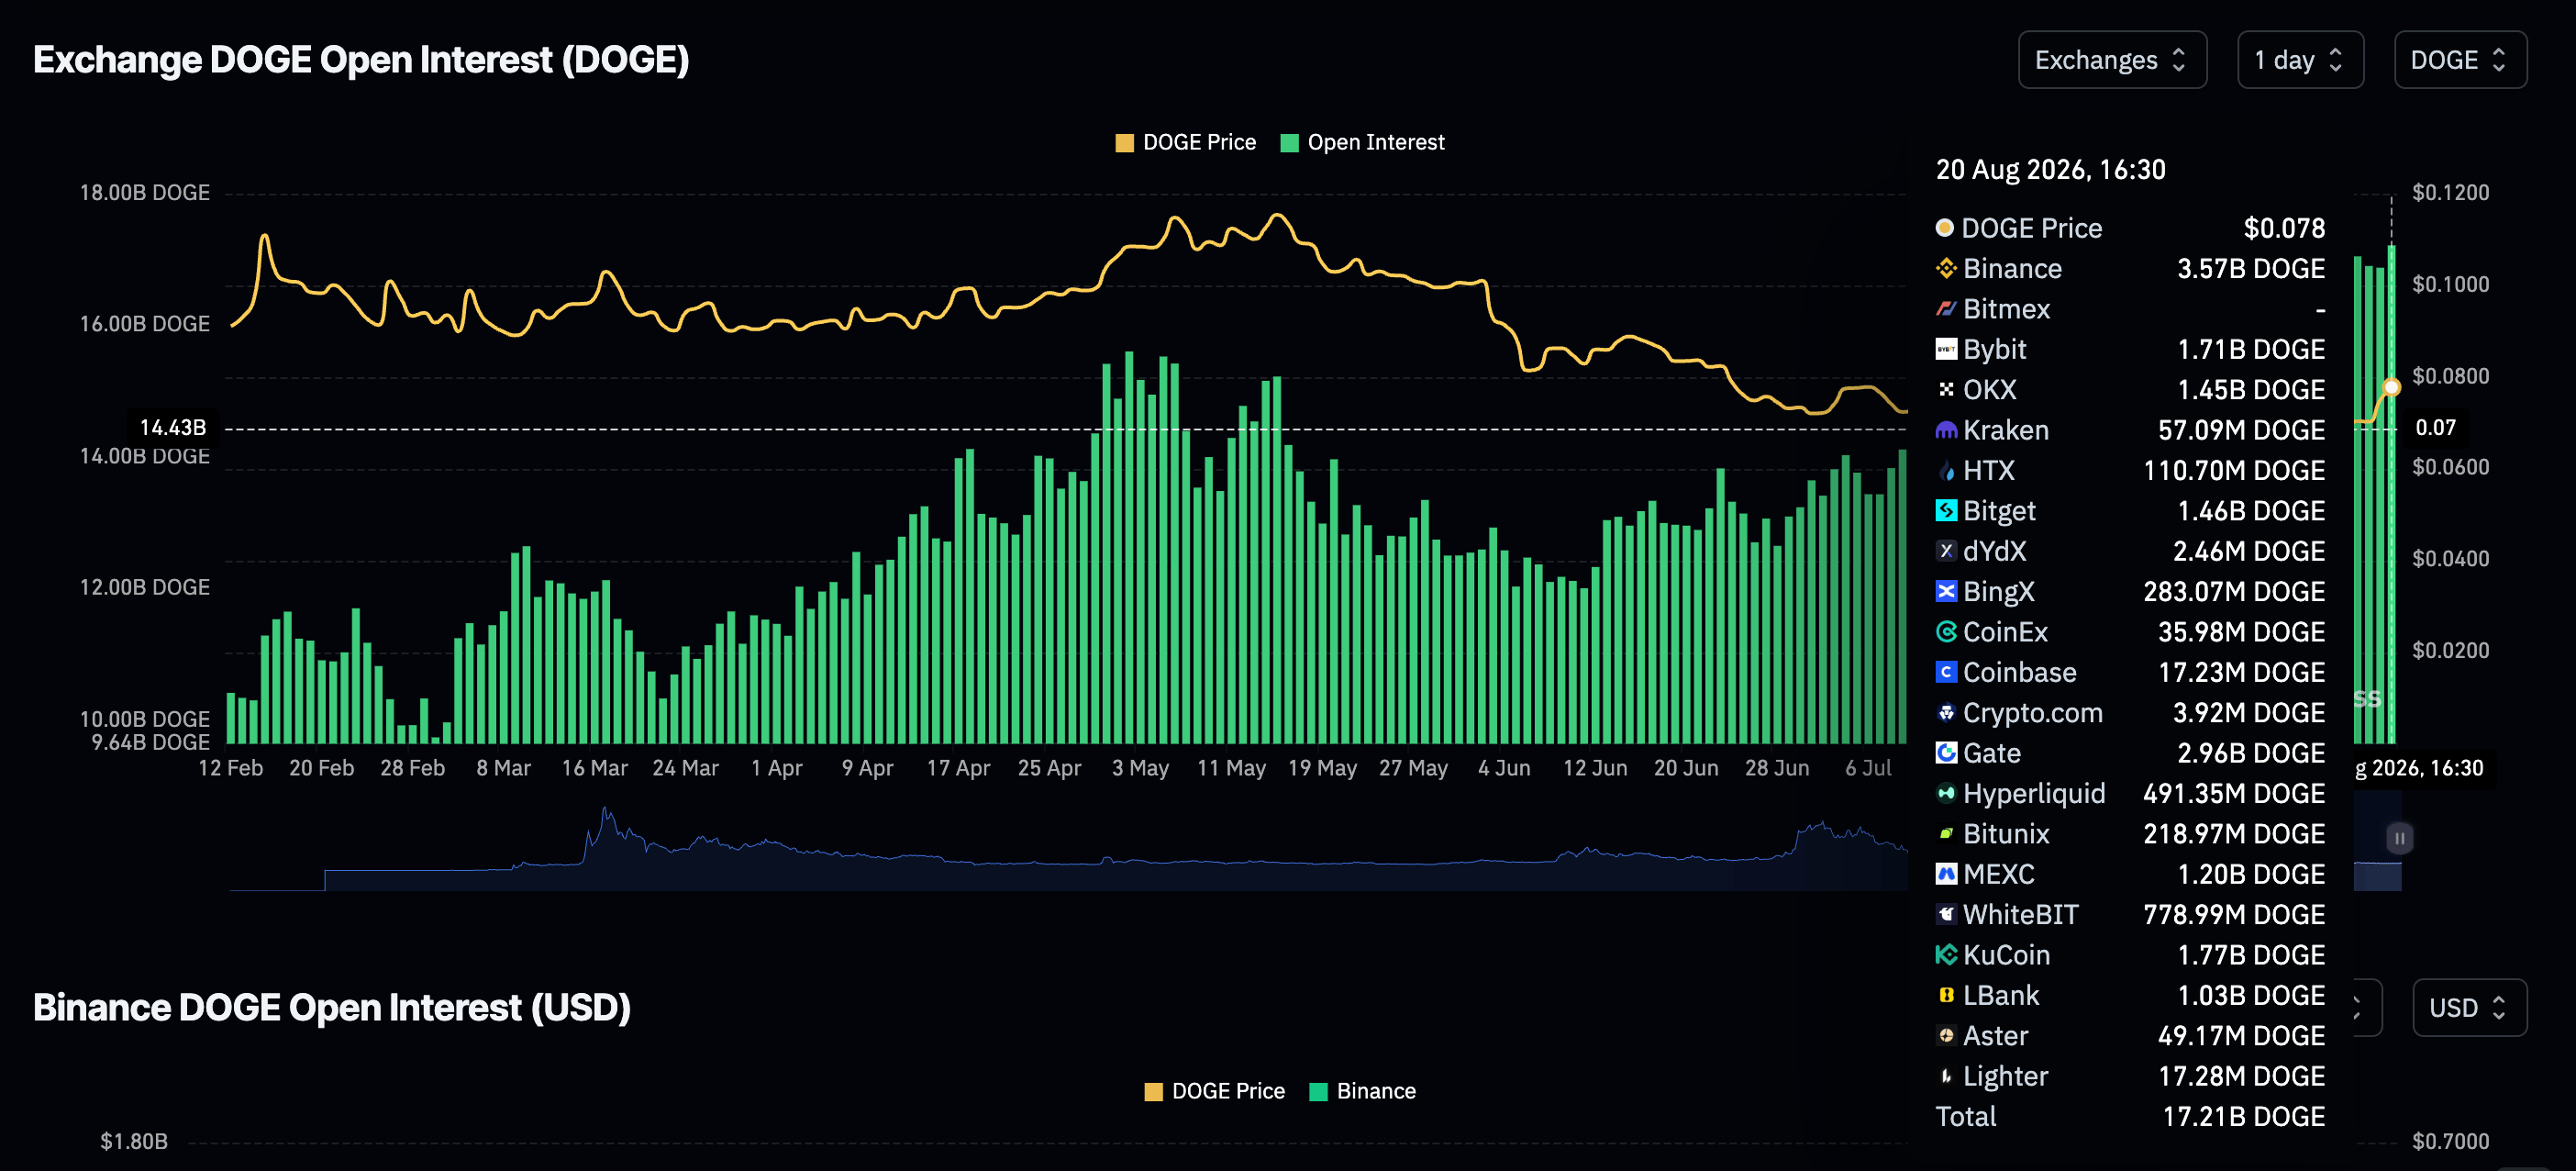
Futures open interest climbed to 17.21 billion DOGE on Thursday, up from 16.87 billion DOGE the previous day, lending support to the positive weighted funding rates. Notably, Dogecoin derivatives have consistently expanded since 12.01 billion DOGE on June 11, underscoring bullish momentum and strengthening the case for a potential breakout above $0.080.
Technical analysis: Dogecoin momentum remains construcitve
Dogecoin trades at $0.078, extending its rebound above the 50-day Exponential Moving Average (EMA) at $0.074 and holding over the SuperTrend support at $0.069. Price action sits beneath the 100-day EMA at $0.080 and the distant 200-day EMA at $0.095, but the coin remains supported by the reclaimed descending trendline break level at $0.068.
A near-overbought Relative Strength Index (RSI) at 69 on the daily chart and a positive Moving Average Convergence Divergence (MACD) histogram suggest strong bullish momentum.
-1787238520860.png)
Immediate support is seen at the recent price area around $0.078, followed by the 50-day EMA at $0.074, with the SuperTrend line at $0.069 and the descending trendline break level at $0.068 reinforcing a broader demand zone on deeper pullbacks. On the topside, initial resistance emerges at the 100-day EMA at $0.080, ahead of the 200-day EMA near $0.094, where a sustained break would be required to open the way for a more convincing medium-term recovery.
(The technical analysis of this story was written with the help of an AI tool. Know more.)
Open Interest, funding rate FAQs
Higher Open Interest is associated with higher liquidity and new capital inflow to the market. This is considered the equivalent of increase in efficiency and the ongoing trend continues. When Open Interest decreases, it is considered a sign of liquidation in the market, investors are leaving and the overall demand for an asset is on a decline, fueling a bearish sentiment among investors.
Funding fees bridge the difference between spot prices and prices of futures contracts of an asset by increasing liquidation risks faced by traders. A consistently high and positive funding rate implies there is a bullish sentiment among market participants and there is an expectation of a price hike. A consistently negative funding rate for an asset implies a bearish sentiment, indicating that traders expect the cryptocurrency’s price to fall and a bearish trend reversal is likely to occur.
추천 기사


