


The NASDAQ 100 rallies on one earnings report while the Dow Jones Industrial Average barely moves
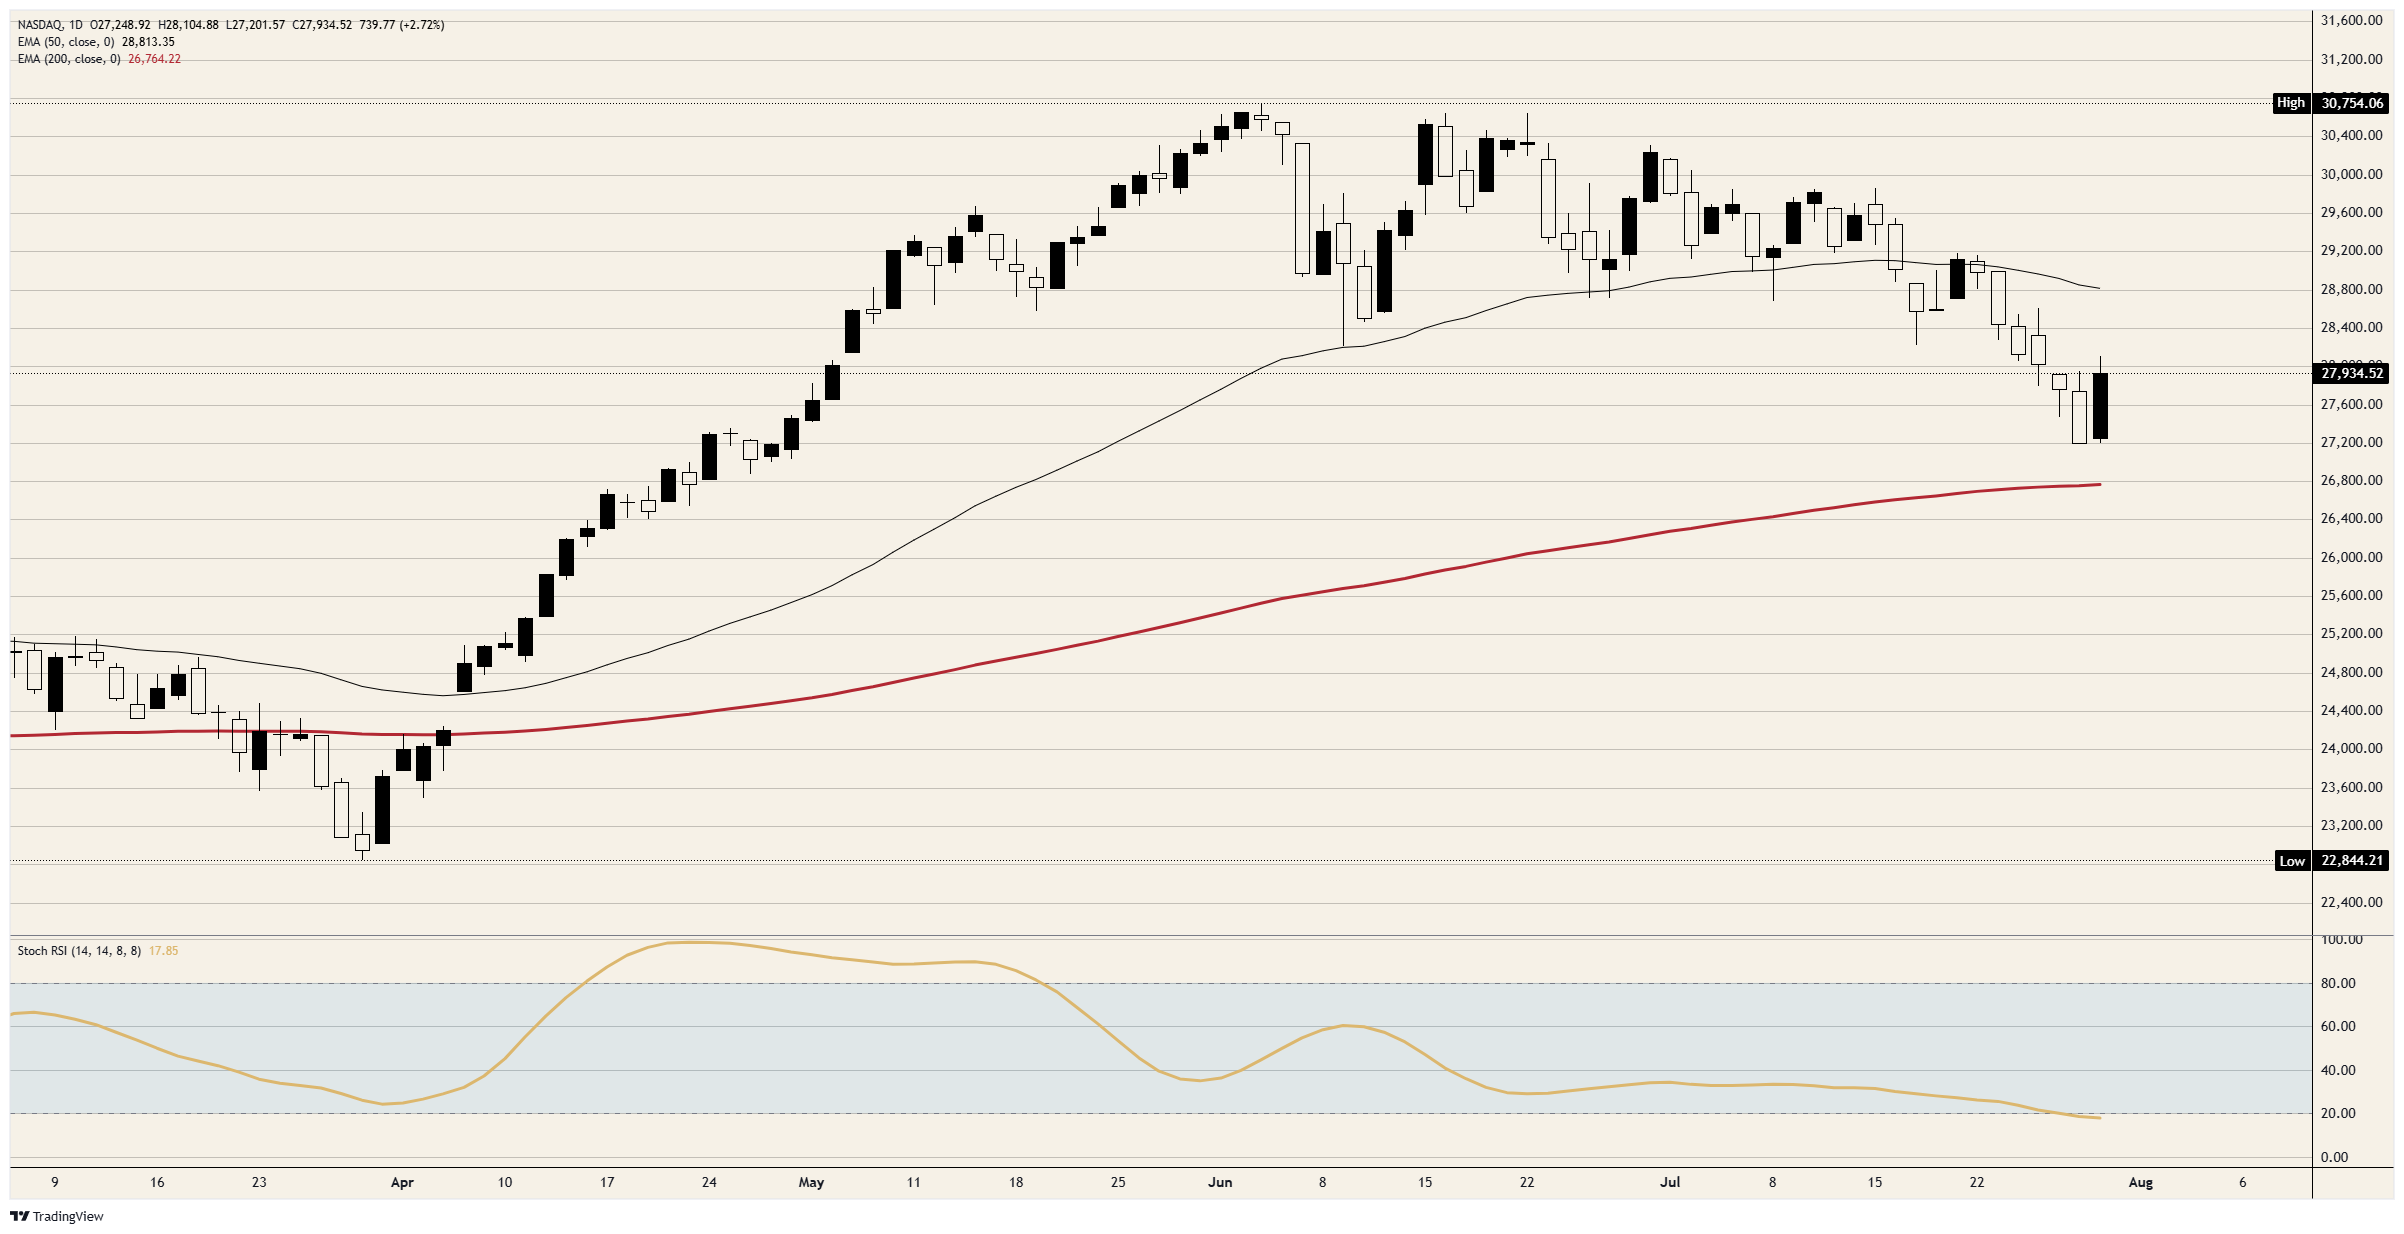
- NASDAQ rebounds almost 3% off a two-month low and still trades roughly 9% beneath its June peak, far under a declining 50-day EMA.
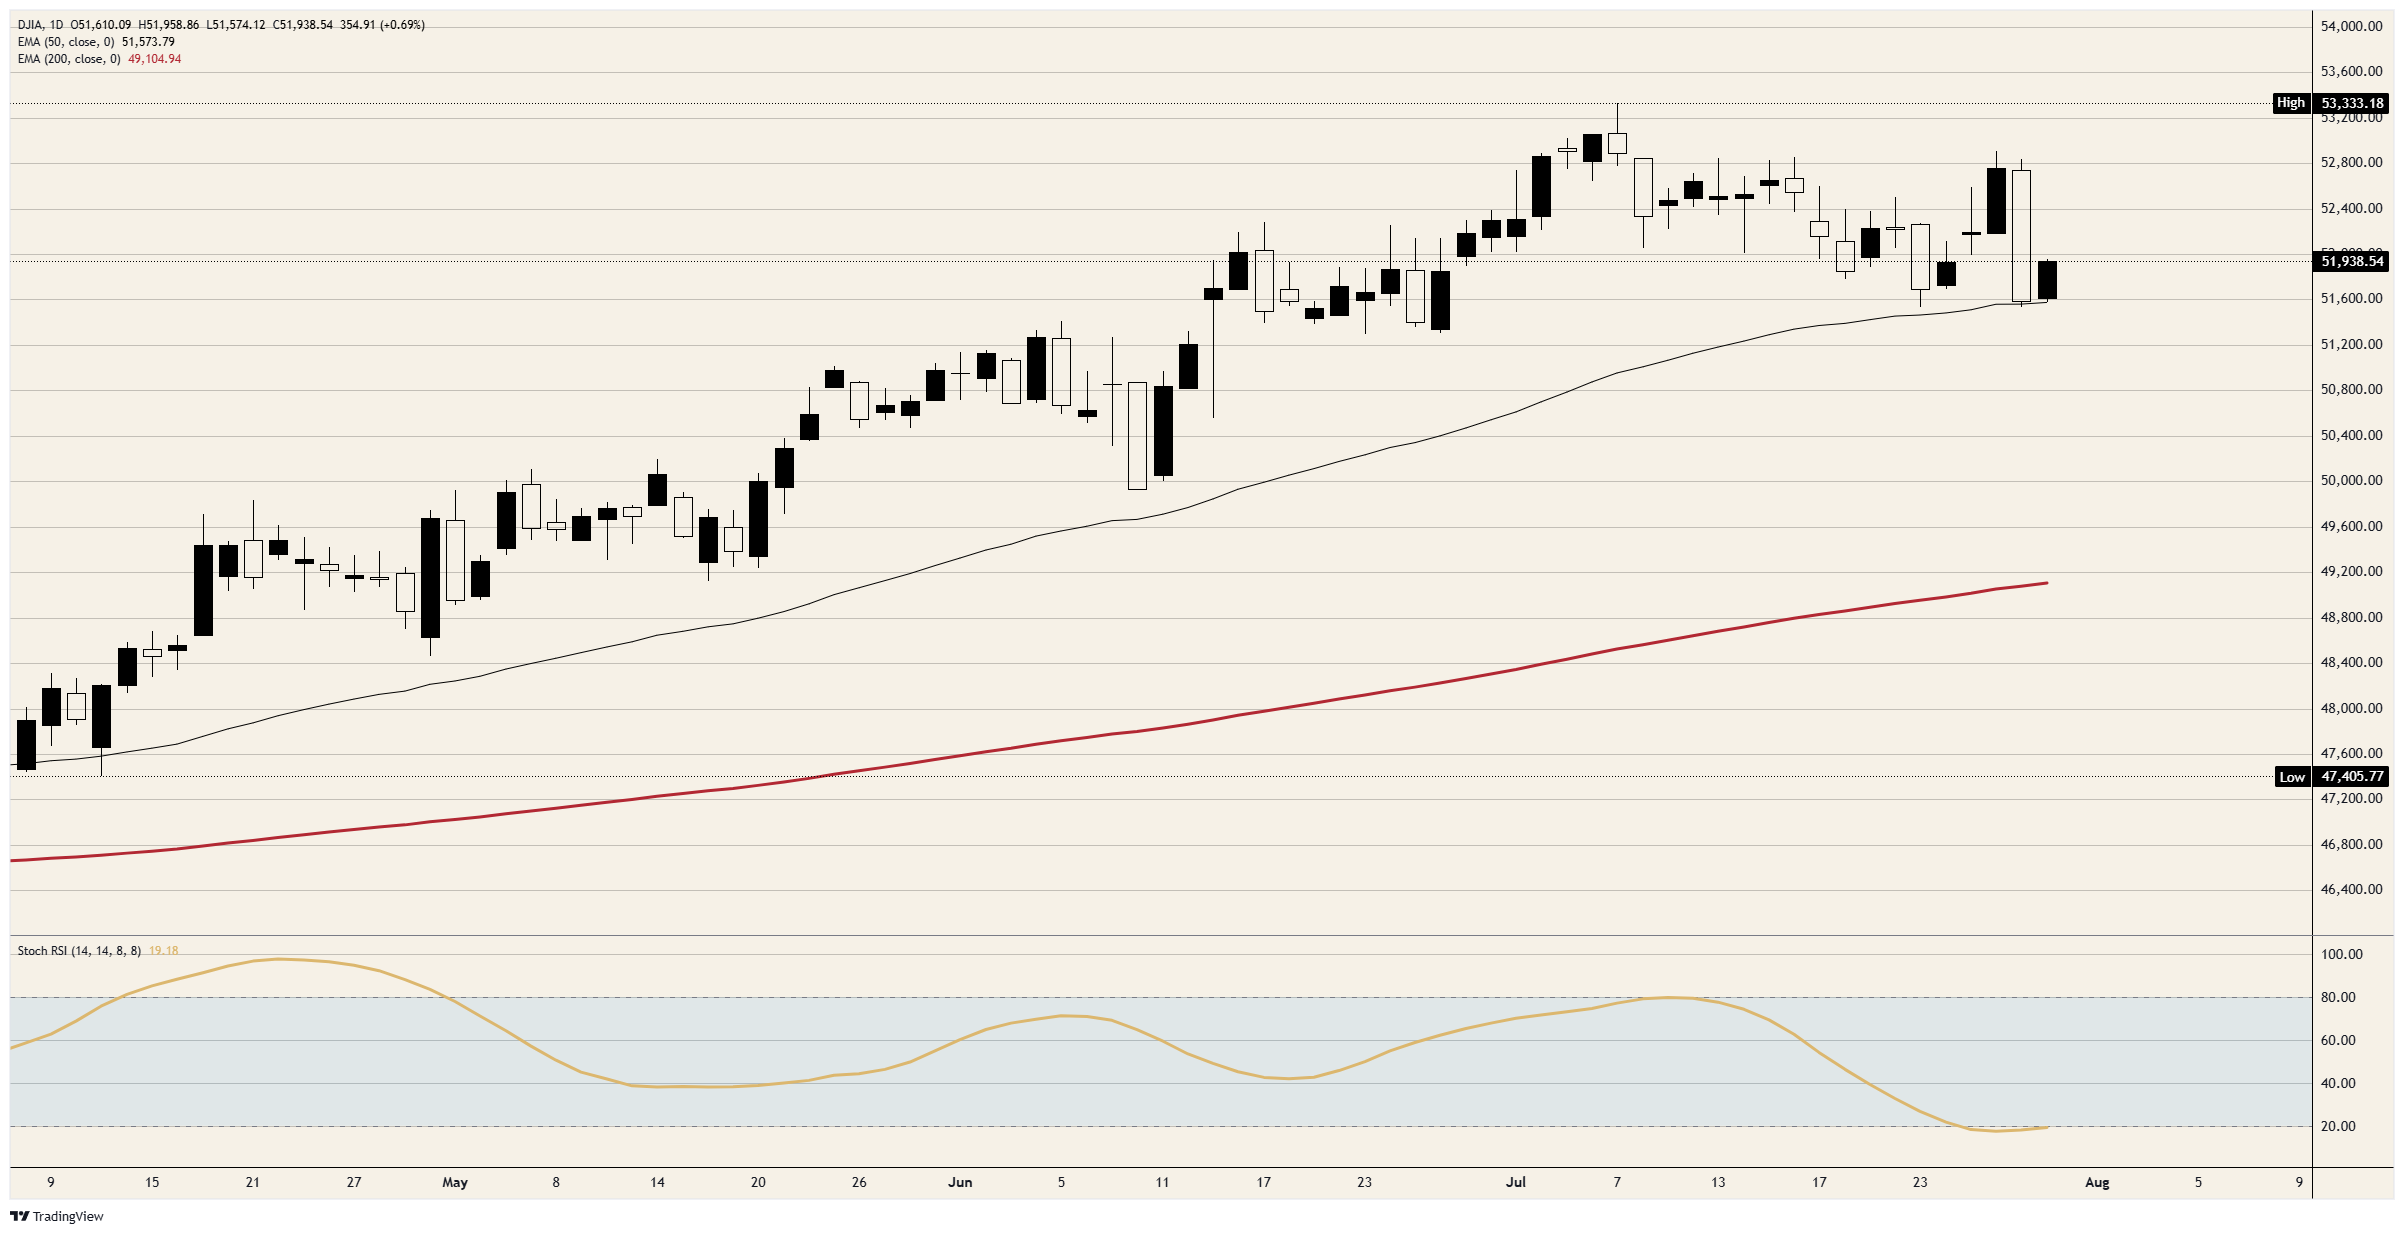
- The Dow Jones Industrial Average adds less than half a percent on the same session and holds within 3% of its record.
- Second-quarter growth undershoots at 1.5% while the GDP price index prints 6.3% against 3.6% expected.
The rebound in United States equities on Thursday is real, and it is one name deep. The NASDAQ 100 trades near 27,950 after a gain of almost 3%, having printed its lowest level in two months in the 27,200 area inside the opening minutes. The Dow Jones Industrial Average, which holds five of the same mega-cap constituents, is up around 200 points near 51,800. The two indices are not describing the same market.
A rebound with one author
Microsoft (MSFT) is up 15% on cloud growth and the semiconductor complex is rallying with it, the benchmark chip fund higher by more than 8%. Meta Platforms (META) is down 9% on a soft revenue forecast and a 91% drop in second-quarter free cash flow. The NASDAQ 100 carries all three of those stories and has still recovered more than 700 points from its low.
What the rally has not done is repair anything structural. The session high just above 28,100 stopped roughly 700 points short of the 50-day Exponential Moving Average (EMA) near 28,800, and the index still sits roughly 9% beneath the June peak just above 30,750. The low printed in the opening minutes was more than 11% under that peak, which is a correction rather than a dip.
The composition alibi does not hold
The tidy explanation for the gap is that the Dow is an old-economy average without the technology exposure to catch a session like this one. That stopped being true some time ago. Microsoft, Apple (AAPL), Amazon (AMZN), Nvidia (NVDA) and Alphabet (GOOGL) all sit inside the thirty, five of the seven largest technology names in the market, with Meta Platforms and Tesla (TSLA) the absentees.
The mechanic is the weighting instead. The Dow moves on dollars rather than percentages, at roughly six index points for every dollar of share-price movement across the thirty, so a 15% gain in one of its higher-priced constituents is worth north of 300 points on its own. The average is up around 200. The other twenty-nine names are, in aggregate, a drag.
Breadth corroborates that arithmetic. Only five of the eleven S&P 500 sectors are positive and the gainer count inside that index ran near 243 shortly after the opening bell, so fewer than half is participating. Information technology and consumer discretionary are carrying the tape, up around 4% and 1.3%.
What the tape is looking through
United States forces completed a heavy wave of strikes on Iran around 02:00 GMT, after Tehran fired ballistic missiles at an American base in Jordan, and a drone attack hit vessels at an Egyptian Mediterranean port. Brent is back above $90 and equity investors are looking straight past it, as they have all war.
The second pressure on the tape is mechanical rather than macro: a large artificial intelligence hedge fund is deleveraging after heavy losses, with its prime brokers marketing baskets of its long and short positions to buyers before the opening bell. Part of Thursday's move in software and chips is that unwind rather than a view about anything.
The bond market is not celebrating
The long end is pricing the opposite of a relief rally. The thirty-year Treasury yield reached 5.21% at 13:08 GMT, up nearly seven basis points on the session and the highest since 2007, after the Federal Reserve held rates on Wednesday. A term structure at two-decade highs is not the usual backdrop for the longest-duration index on the board gaining 3%.
Futures pricing points the same way. At 12:40 GMT the aggregated curve put at least one quarter-point increase at 59.2% by the 16 September meeting and 88% by 28 October, with a second at 31.3% by December and no cut priced at any 2026 meeting. Equity buyers are paying up for duration into a curve that expects tightening.
The data underneath the bounce
The 12:30 GMT releases gave the rally its excuse and buried the harder number. Core Personal Consumption Expenditures (PCE) prices rose 0.1% MoM in June against 0.2% expected, with the annual rate in line at 3.3% and down from 3.4%. Headline prices fell 0.1% MoM and the YoY rate eased to 3.7% from 4.1%.
The quarterly figures in the same batch read differently. Gross Domestic Product (GDP) grew 1.5% annualised in the second quarter against a 2.1% consensus, and the accompanying price index ran at 6.3% against 3.6% expected, the largest surprise on the page. Initial jobless claims printed 197K against 200K, up from 188K, so nothing in the labour data forces the Federal Reserve's hand either.
Still to come
The week's binary risk arrives after the bell, when Amazon, Apple and Coinbase (COIN) report, and two of the three sit in both indices here. Friday brings the second-quarter Employment Cost Index (ECI) at 12:30 GMT with a 0.8% consensus from 0.9%, the Chicago Purchasing Managers Index (PMI) at 13:45 GMT at 56 from 56.7, and the Michigan survey at 14:00 GMT carrying one-year inflation expectations of 4.2% and a five-year reading of 3.3%.
NASDAQ 100 technical outlook
Resistance: The session high just above 28,100 is the first line and it has already turned the tape back once. Above it, the declining 50-day EMA near 28,800 decides whether this is a rebound or a base, with the June peak just above 30,750 a distant reference.
Support: The 27,200 area, the low printed in the opening minutes, is the line that matters, and a break of it puts the 200-day EMA near 26,750 in play. The Dow Jones Industrial Average is the cross-check, its own 50-day EMA near 51,600 having held the session low exactly.
Bias: Bearish. The daily Stochastic Relative Strength Index (Stoch RSI) is beneath 20 on both indices, but the five-minute reading under 10 has already rolled the intraday rally over, and mega-cap results after the bell are as likely to sell the news as buy it. Sell rallies into the 28,800 area, objectives the 27,200 area and then the 200-day
Dow Jones daily chart
Nasdaq 100 daily chart
Nasdaq FAQs
The Nasdaq is a stock exchange based in the US that started out life as an electronic stock quotation machine. At first, the Nasdaq only provided quotations for over-the-counter (OTC) stocks but later it became an exchange too. By 1991, the Nasdaq had grown to account for 46% of the entire US securities’ market. In 1998, it became the first stock exchange in the US to provide online trading. The Nasdaq also produces several indices, the most comprehensive of which is the Nasdaq Composite representing all 2,500-plus stocks on the Nasdaq, and the Nasdaq 100.
The Nasdaq 100 is a large-cap index made up of 100 non-financial companies from the Nasdaq stock exchange. Although it only includes a fraction of the thousands of stocks in the Nasdaq, it accounts for over 90% of the movement. The influence of each company on the index is market-cap weighted. The Nasdaq 100 includes companies with a significant focus on technology although it also encompasses companies from other industries and from outside the US. The average annual return of the Nasdaq 100 has been 17.23% since 1986.
There are a number of ways to trade the Nasdaq 100. Most retail brokers and spread betting platforms offer bets using Contracts for Difference (CFD). For longer-term investors, Exchange-Traded Funds (ETFs) trade like shares that mimic the movement of the index without the investor needing to buy all 100 constituent companies. An example ETF is the Invesco QQQ Trust (QQQ). Nasdaq 100 futures contracts allow traders to speculate on the future direction of the index. Options provide the right, but not the obligation, to buy or sell the Nasdaq 100 at a specific price (strike price) in the future.
Many different factors drive the Nasdaq 100 but mainly it is the aggregate performance of the component companies revealed in their quarterly and annual company earnings reports. US and global macroeconomic data also contributes as it impacts on investor sentiment, which if positive drives gains. The level of interest rates, set by the Federal Reserve (Fed), also influences the Nasdaq 100 as it affects the cost of credit, on which many corporations are heavily reliant. As such the level of inflation can be a major driver too as well as other metrics which impact on the decisions of the Fed.
추천 기사


