


US Dollar Index eases from tops, back to 101.30 ahead of Fed
- The US Dollar loses some upside momentum and slips back toward the daily lows.
- US Treasury yields extend the drop to multi-day lows across the curve.
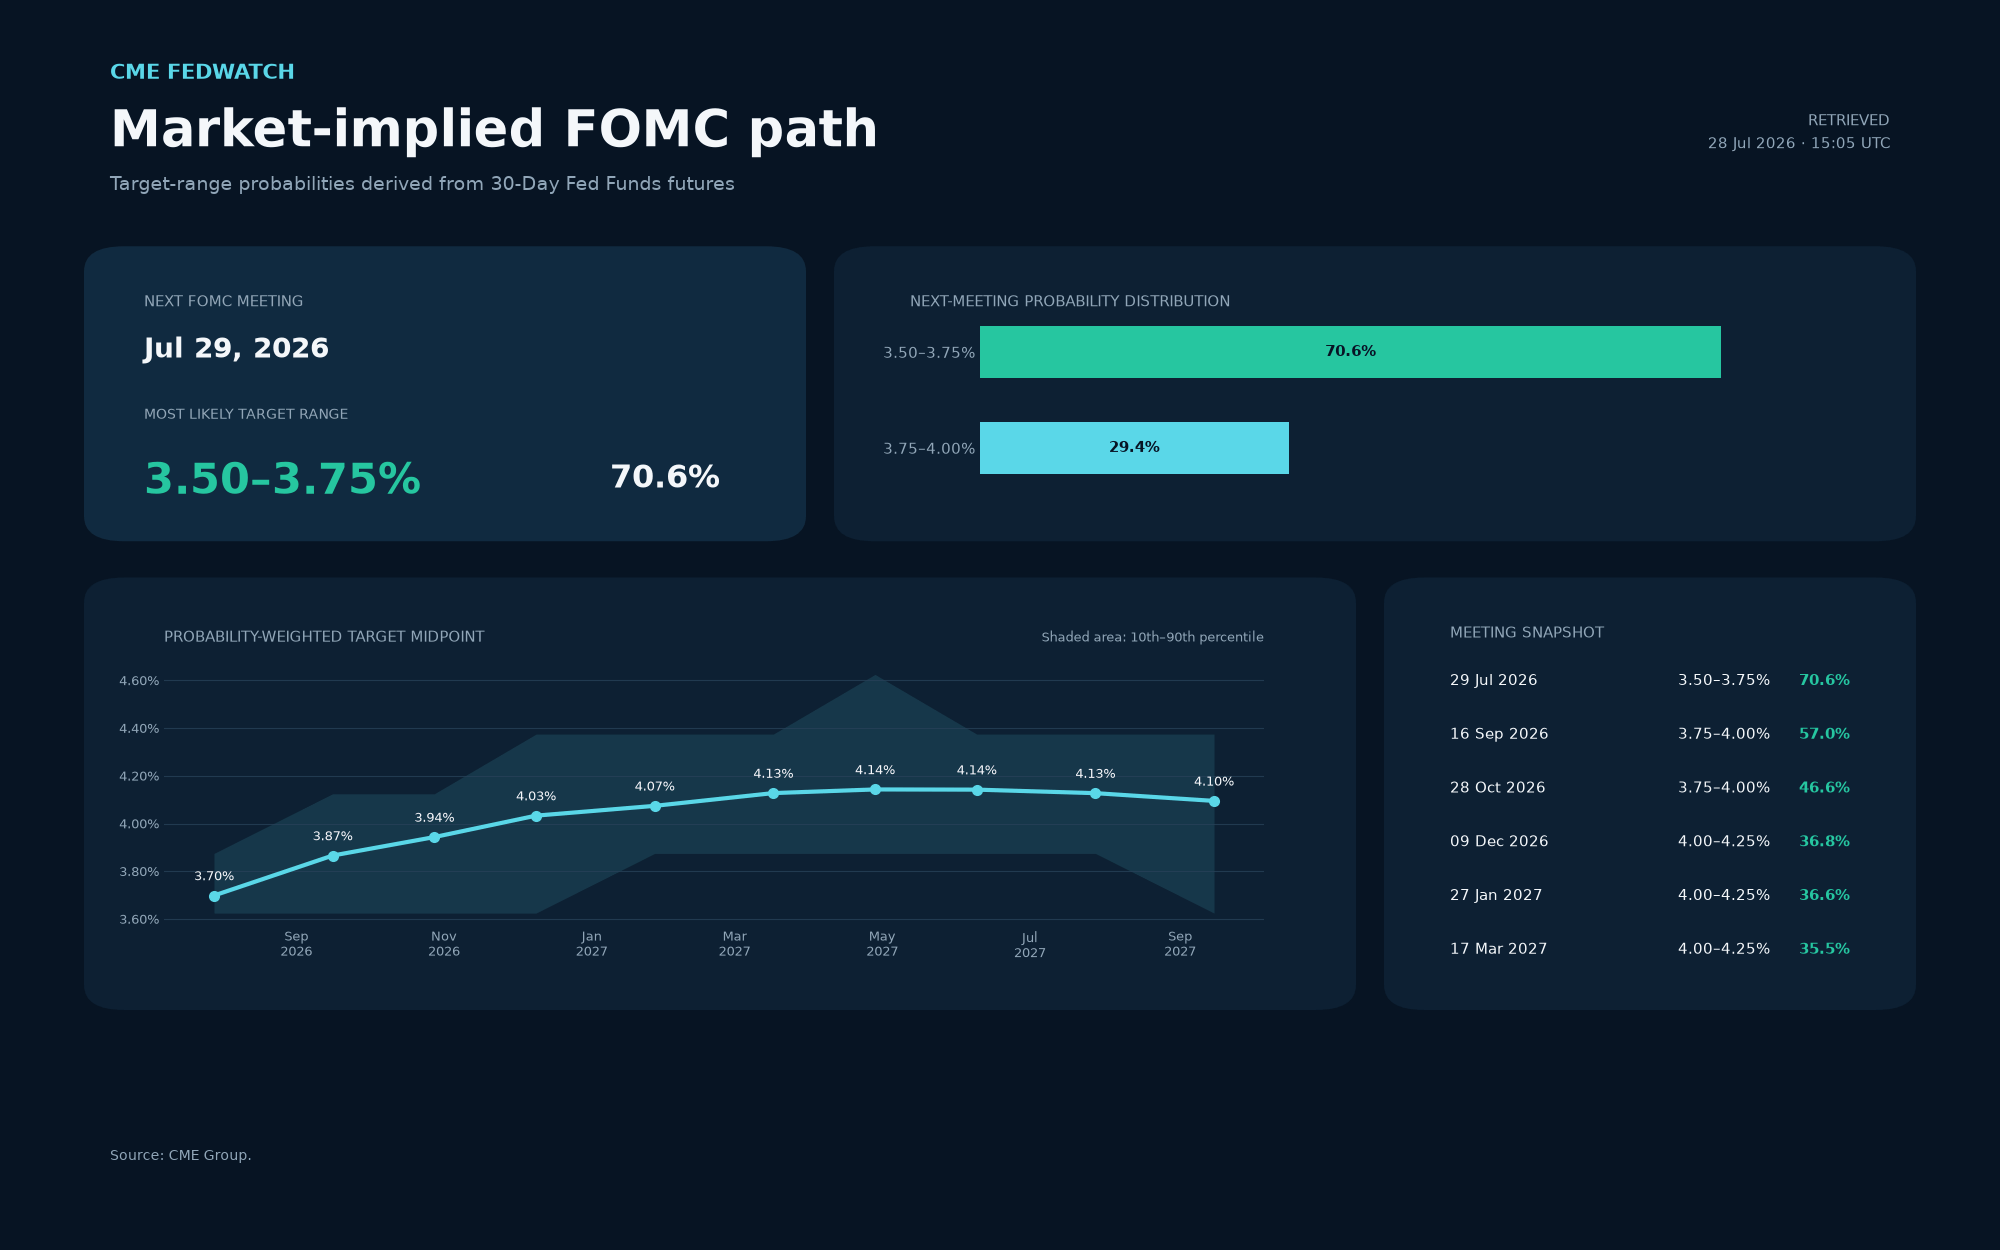
- The Fed begins its two-day meeting and is expected to keep rates unchanged.
The Greenback, when tracked by the US Dollar Index (DXY), abandons the area of monthly peaks and recedes toward the 101.30 zone on turnaround Tuesday.
A test of the YTD peaks remains in place
The US Dollar’s correction comes after three consecutive daily advances and seems to have met a tough nut to crack in the 101.60-101.70 band, a region close to its yearly highs around 101.80 recorded in late June. Despite the daily pullback, the index continues to trade well above its key 200-day SMA, keeping the short-term constructive outlook in place and allowing for extra advances down the road.
Oil, yields and inflation
Cooling tensions in the Middle East have been collaborating with the severe pullback in crude oil prices. That said, prices for a barrel of the American benchmark for sweet light crude oil (WTI) have retreated for the third consecutive day, breaching the key $80.00 mark and hitting new two-week troughs.
By the same token, inflation fears seem to have shrunk a tad, motivating US Treasury yields to extend their corrective move across the spectrum, all at the time when market participants continue to assess the potential Fed rate path prior to the FOMC event on Wednesday.
On the latter, the central bank is widely anticipated to keep its hand steady once again, leaving its Fed Funds Target Range (FFTR) intact at 3.25%-3.75%. Meanwhile, US inflation is expected to gather all the attention of the media questions, particularly in light of the softer-than-expected CPI data in June and the current cooling of geopolitical effervescence and its impact on consumer prices going forward.
Back in the US, disappointing data from the Conference Board’s Consumer Confidence gauge accompany the move lower in the buck. Next on tap is the API’s weekly release of US crude oil inventories ahead of Wednesday’s official data by the EIA.
Technical view
In the daily chart, the US Dollar Index trades at 101.29. The near-term bias is bullish, with price holding above the 55-day, 100-day and 200-day simple moving averages (SMAs), which cluster between roughly 99.1 and 100.3 and reinforce an underlying uptrend. Momentum remains constructive, as the 14-period Relative Strength Index at 57.18 stays comfortably above the midline, while the Average Directional Index around 25.64 suggests a modest but still active trend rather than an exhausted move.
On the topside, initial resistance is outlined by the recent horizontal cap at 101.98, where a daily close higher would open the way for further gains. On the downside, immediate support is seen at 100.64 and then 100.39, with a deeper pullback eyeing the 99.50 area ahead of the 55-day SMA near 100.30 and the 100-day SMA around 99.72; a break below these moving averages would expose the more distant structural floors at 97.62 and the mid-95.00s.
(The technical analysis of this story was written with the help of an AI tool. Know more.)
Fed FAQs
Monetary policy in the US is shaped by the Federal Reserve (Fed). The Fed has two mandates: to achieve price stability and foster full employment. Its primary tool to achieve these goals is by adjusting interest rates. When prices are rising too quickly and inflation is above the Fed’s 2% target, it raises interest rates, increasing borrowing costs throughout the economy. This results in a stronger US Dollar (USD) as it makes the US a more attractive place for international investors to park their money. When inflation falls below 2% or the Unemployment Rate is too high, the Fed may lower interest rates to encourage borrowing, which weighs on the Greenback.
The Federal Reserve (Fed) holds eight policy meetings a year, where the Federal Open Market Committee (FOMC) assesses economic conditions and makes monetary policy decisions. The FOMC is attended by twelve Fed officials – the seven members of the Board of Governors, the president of the Federal Reserve Bank of New York, and four of the remaining eleven regional Reserve Bank presidents, who serve one-year terms on a rotating basis.
In extreme situations, the Federal Reserve may resort to a policy named Quantitative Easing (QE). QE is the process by which the Fed substantially increases the flow of credit in a stuck financial system. It is a non-standard policy measure used during crises or when inflation is extremely low. It was the Fed’s weapon of choice during the Great Financial Crisis in 2008. It involves the Fed printing more Dollars and using them to buy high grade bonds from financial institutions. QE usually weakens the US Dollar.
Quantitative tightening (QT) is the reverse process of QE, whereby the Federal Reserve stops buying bonds from financial institutions and does not reinvest the principal from the bonds it holds maturing, to purchase new bonds. It is usually positive for the value of the US Dollar.
추천 기사


