


The Dow Jones Industrial Average discovers the virtue of owning no semiconductors
- DJIA trades near 52,800, up roughly 160 points, outperforming the S&P 500 and the Nasdaq as chip stocks bleed on Taiwan Semiconductor's spending guidance.
- UnitedHealth jumps more than 6% on an earnings beat, doing the price-weighted heavy lifting while more than 87% of early reporters top estimates.
- Claims at 208K and a five-year high in the Philadelphia Federal Reserve survey flatter the real economy the index is built to represent.
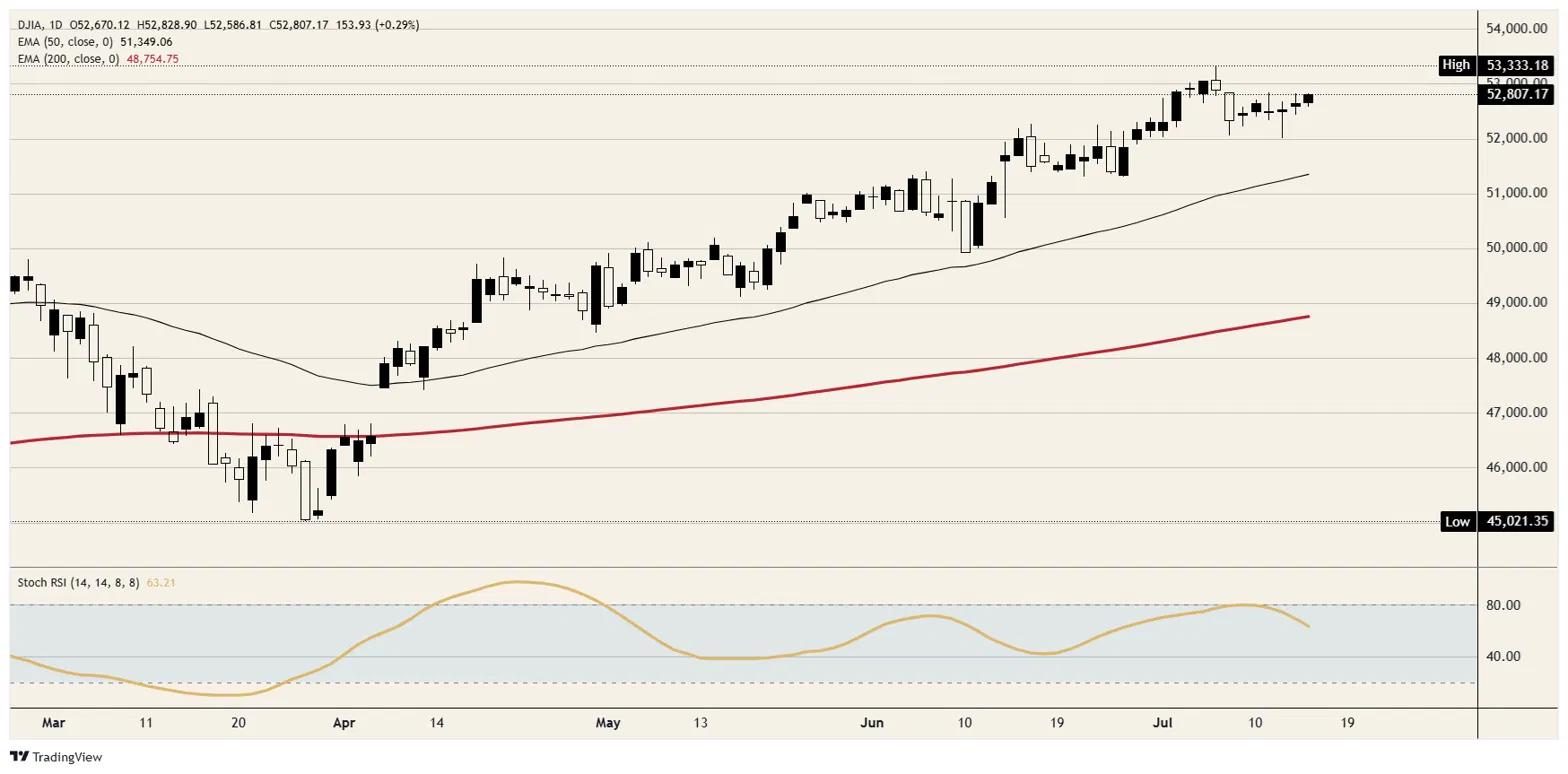
The Dow Jones Industrial Average added roughly 160 points, or 0.3%, to trade near 52,800 on Thursday while the S&P 500 slipped 0.2% and the Nasdaq Composite shed 0.9%. An early dip to 52,586.81 found buyers within the first hours, and the index has since ground to a session high at 52,828.90, leaving last week's record at 53,333.18 within 1% of the tape. The blue-chip benchmark is the only major in the green, and the reason is as much about what it lacks as what it holds.
Outperformance by subtraction
Semiconductors are Thursday's problem, and the Dow Jones Industrial Average barely owns any. Taiwan Semiconductor (TSM) beat second-quarter expectations but raised its capital spending guidance to between $60 billion and $64 billion from a prior $52 billion to $56 billion range, and the market read the bill rather than the beat. The stock trades down about 2% while Arm Holdings (ARM) drops more than 7%, Micron (MU) more than 5%, Advanced Micro Devices (AMD) more than 4%, Broadcom (AVGO) more than 3%, and the American listing of SK Hynix (SKHY) craters more than 9%.
The index's escape route runs through a health insurer. UnitedHealth (UNH) advances more than 6% after easily topping expectations, and in a price-weighted construction one expensive stock outweighs a sector's worth of silicon grief. Add the banks that cleared their bar earlier in the week and a beat rate above 87% across the first 40 S&P 500 reporters, and Thursday's leadership looks less like rotation into the old economy than rotation away from everything the old economy never bought. Strategists' verdict that earnings strength runs across all caps only sharpens the point; the weakness is concentrated in one crowded trade.
The data flatters Main Street and complicates the Federal Reserve
The 12:30 GMT data sweep came in hot where it counts. Initial jobless claims fell to 208K against a 217K consensus; the Philadelphia Federal Reserve's manufacturing index soared to 41.4 versus 13 expected, its strongest reading since November 2021; and the New York Federal Reserve's services gauge posted 8.7, its first positive reading in nearly two years. Retail sales rose 0.2% MoM as expected with the control group matching its 0.5% consensus, though the ex-autos read slipped 0.2% and gasoline stations gave up 5.3% on falling pump prices.
Strength cuts both ways under a central bank that has removed its easing bias. Futures assign roughly an 83% probability to a hold at the July 28 to 29 meeting, September pricing tilts toward a hike, and half the committee's June projections pencilled in at least one increase this year; Tuesday's cooler inflation print bought the doves a hearing, which is precisely why a 41-handle factory survey lands awkwardly. Three Federal Reserve speakers, including the Vice Chair, take the microphone from 16:30 GMT. Pending home sales, down 5.4% MoM against a 0.5% decline expected, supplied the 14:00 GMT reminder that the rate-sensitive corners are enjoying none of this.
A record within reach and nobody sprinting
The index sits within striking distance of its all-time high and trades like it would rather not discuss it. Volume-light grinding, a leadership list one earnings report deep, and a Middle East that reinstated a naval blockade this week without denting equities describe a market long of complacency and short of new money. Daily momentum agrees with the hesitation: the Stochastic Relative Strength Index eases through the low 60s even as price holds within a percent of the top, the signature of a market marking time rather than accumulating. That posture holds until either the record breaks on its own or Friday's data hands the tape an excuse.
Friday brings the sentiment check
Friday's docket opens with June housing starts and building permits at 12:30 GMT, numbers that inherit extra weight after Thursday's pending home sales miss, followed by industrial production at 13:15 GMT. The main event is the University of Michigan's preliminary July consumer sentiment at 14:00 GMT, expected at 51 from 49.5, alongside one-year inflation expectations last seen at 4.6%. A consumer who keeps spending through inflation expectations north of 4% is the entire bull case for the real-economy index. An expectations spike hands the hawks the back half of July.
Technical levels
Resistance: The session high at 52,828.90 caps the day so far, with the record at 53,333.18 the only structure above it on the daily chart.
Support: Thursday's low at 52,586.81 is the near shelf. Below that, the 52,000 handle and the rising 50-day Exponential Moving Average at 51,349 frame the July uptrend.
Bias: Higher. Breadth is ugly but this index does not carry the ugly parts. Earnings are beating, the real-economy data is accelerating, and a hold above 52,586.81 keeps a record retest as the path of least resistance into next week.
Dow Jones daily chart
Dow Jones FAQs
The Dow Jones Industrial Average, one of the oldest stock market indices in the world, is compiled of the 30 most traded stocks in the US. The index is price-weighted rather than weighted by capitalization. It is calculated by summing the prices of the constituent stocks and dividing them by a factor, currently 0.152. The index was founded by Charles Dow, who also founded the Wall Street Journal. In later years it has been criticized for not being broadly representative enough because it only tracks 30 conglomerates, unlike broader indices such as the S&P 500.
Many different factors drive the Dow Jones Industrial Average (DJIA). The aggregate performance of the component companies revealed in quarterly company earnings reports is the main one. US and global macroeconomic data also contributes as it impacts on investor sentiment. The level of interest rates, set by the Federal Reserve (Fed), also influences the DJIA as it affects the cost of credit, on which many corporations are heavily reliant. Therefore, inflation can be a major driver as well as other metrics which impact the Fed decisions.
Dow Theory is a method for identifying the primary trend of the stock market developed by Charles Dow. A key step is to compare the direction of the Dow Jones Industrial Average (DJIA) and the Dow Jones Transportation Average (DJTA) and only follow trends where both are moving in the same direction. Volume is a confirmatory criteria. The theory uses elements of peak and trough analysis. Dow’s theory posits three trend phases: accumulation, when smart money starts buying or selling; public participation, when the wider public joins in; and distribution, when the smart money exits.
There are a number of ways to trade the DJIA. One is to use ETFs which allow investors to trade the DJIA as a single security, rather than having to buy shares in all 30 constituent companies. A leading example is the SPDR Dow Jones Industrial Average ETF (DIA). DJIA futures contracts enable traders to speculate on the future value of the index and Options provide the right, but not the obligation, to buy or sell the index at a predetermined price in the future. Mutual funds enable investors to buy a share of a diversified portfolio of DJIA stocks thus providing exposure to the overall index.
추천 기사


