


ONDO Price Forecast: ONDO’s rally nears $0.40 as network partners with Japan’s SBI Group
- ONDO surges more than 6%, shrugging off a broader cool-down in the cryptocurrency market on Thursday.
- Ondo Finance partners with Japan’s SBI Group, aiming to expand tokenized real-world assets on-chain.
- ONDO builds momentum, supported by a MACD buy signal.
Ondo Finance (ONDO) edges higher toward the nearest resistance at $0.40 at the time of writing on Thursday. The rally follows the network’s strategic partnership with Japan’s SBI Group, shrugging off a broader cool-down in the cryptocurrency market.
Ondo Finance, SBI Group partner to tokenized real-world assets
Ondo Finance has announced a strategic partnership with SBI Group, one of Japan’s leading financial conglomerates. The collaboration aims to bring Japan's massive traditional capital markets directly on-chain.
According to the announcement, the partnership will focus on tokenizing Japanese assets, leveraging the SBI ecosystem for broad distribution. Transactions will be settled using the Yen-backed JPYSC stablecoin, establishing an efficient, compliant corridor for digital assets.
Ondo CEO Ian De Bode emphasized Japan's status as a sophisticated capital market, stating the deal "creates a path to bring Japanese assets" on-chain. Yoshitaka Kitao, CEO of SBI Holdings, noted that Ondo will be a "key strategic partner" in forming SBI’s global digital asset corridor.
The integration of Japanese equities with global DeFi marks a major milestone for institutional blockchain adoption, signaling strong growth momentum for the ONDO token.
Price analysis: ONDO builds momentum
ONDO extends its breakout above the descending trendline, establishing a solid support base near $0.31. The token continues to trade confidently above key Exponential Moving Averages (EMAs), including the 50-day EMA and the 100-day EMA at $0.34, while the 200-day EMA lies at $0.38, underscoring a bullish near-term outlook.
The spot price also sits above the Bollinger Bands middle layer at $0.33 and the upper band at $0.36, while the Relative Strength Index (RSI) at 67 hovers just below the overbought threshold. Moreover, the Moving Average Convergence Divergence (MACD) histogram remains positive, hinting at strong but stretched upside momentum.
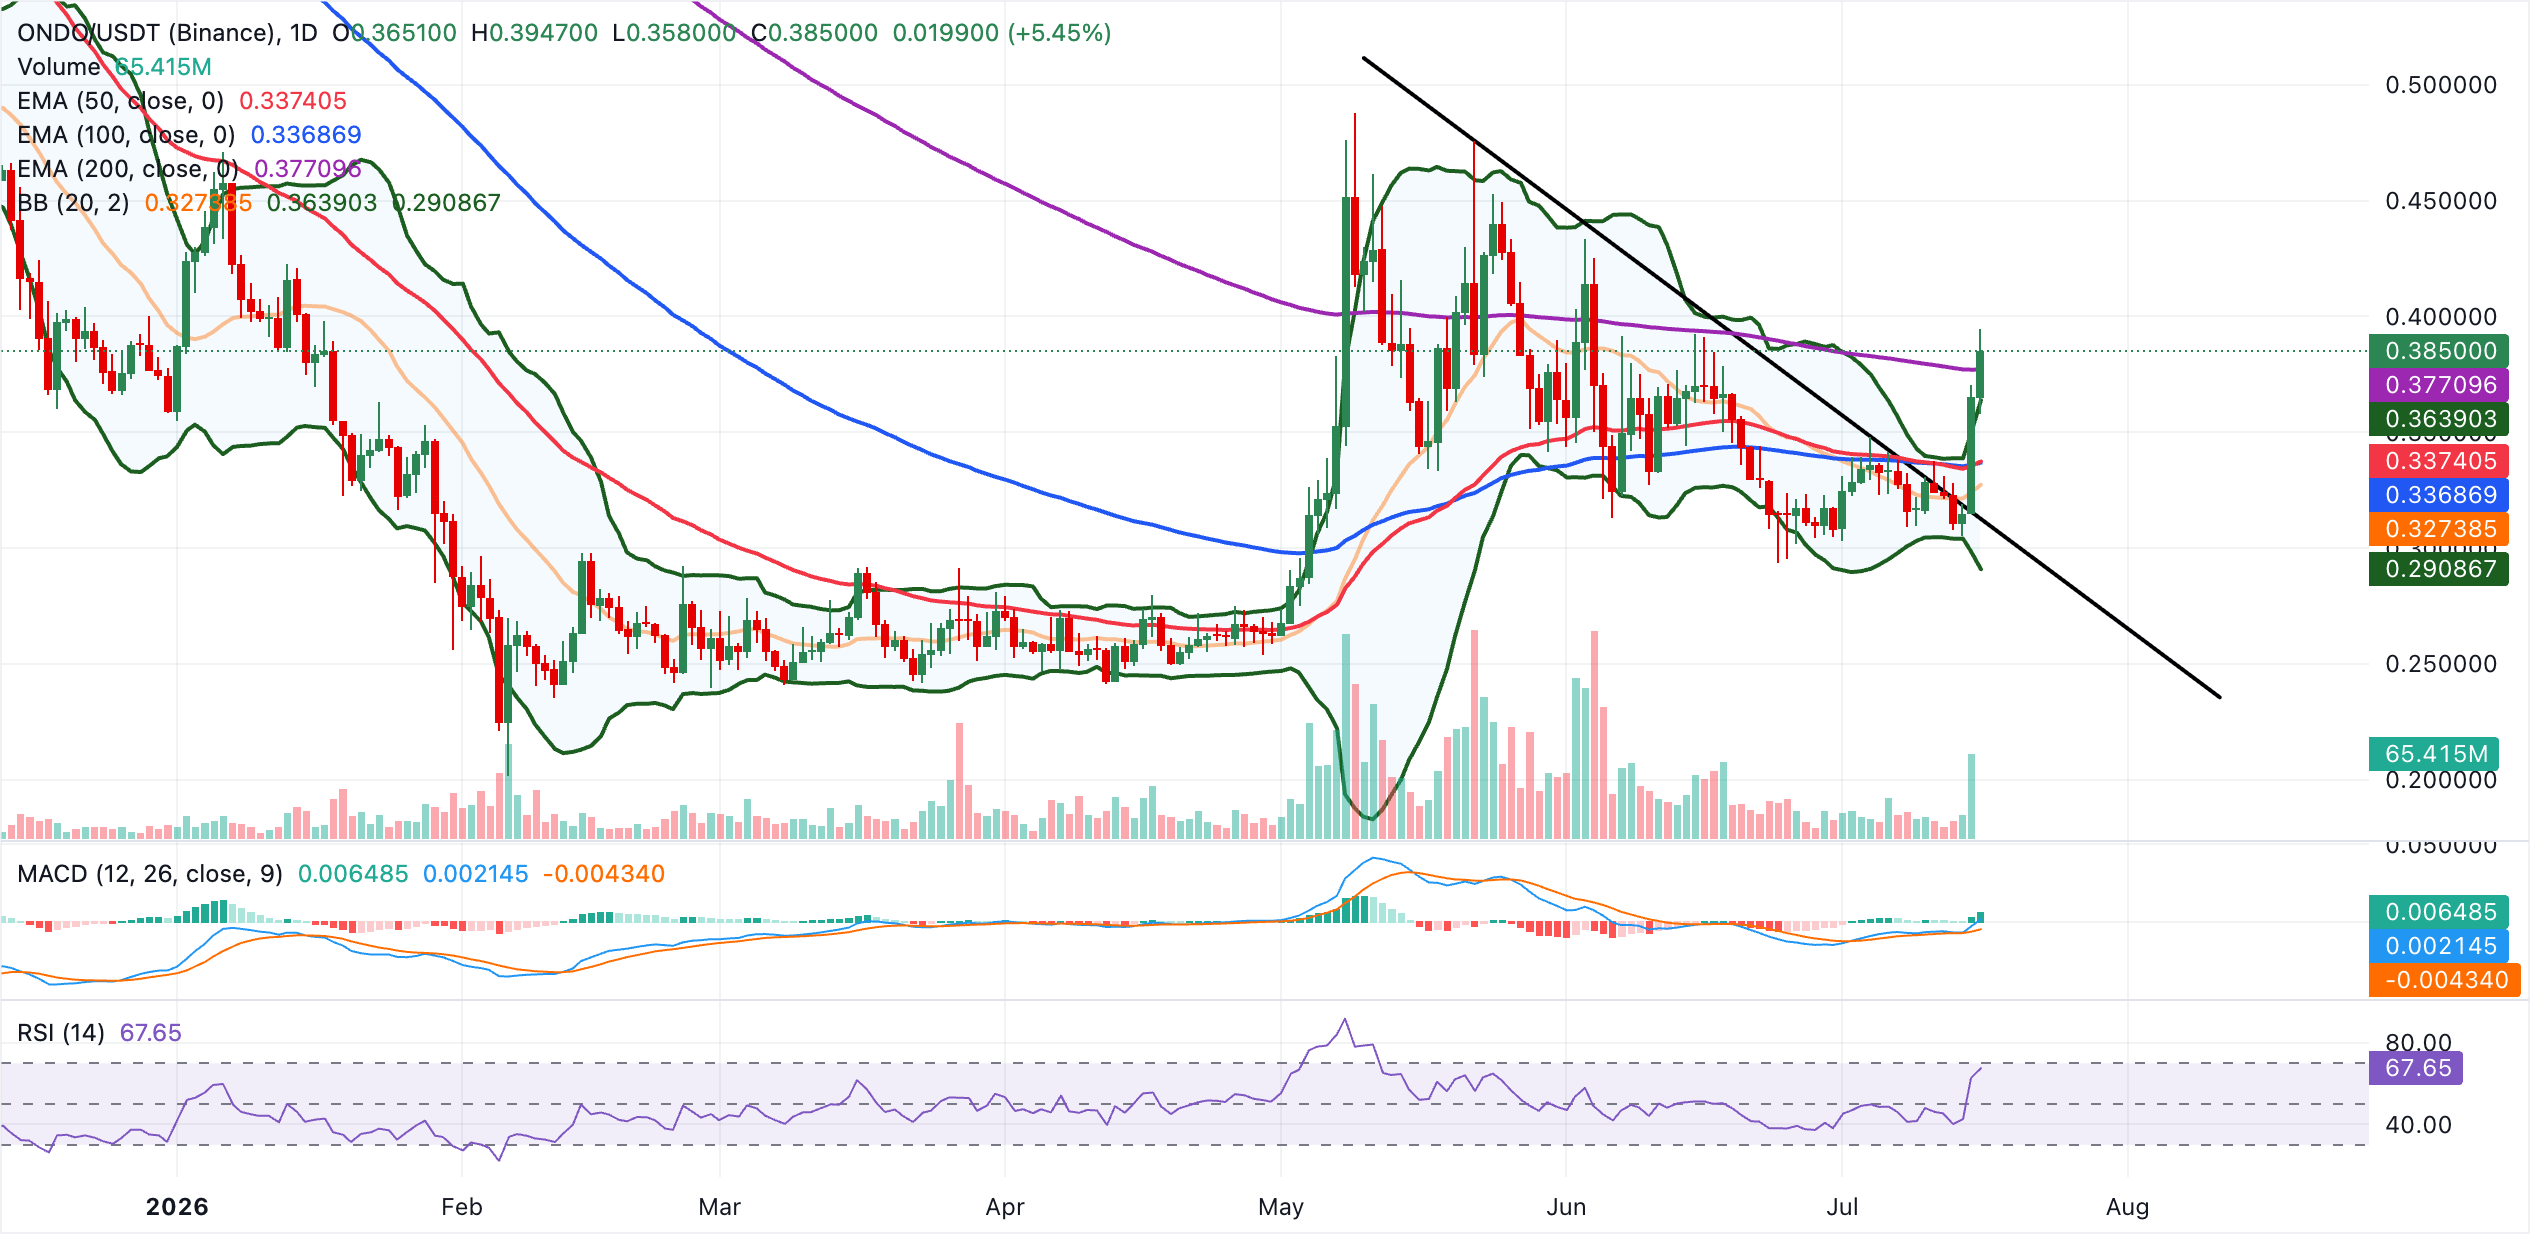
On the downside, immediate support emerges at the 200-day EMA around $0.38, followed by the Bollinger upper band near $0.36, before the cluster formed by the 50-day and 100-day EMAs around $0.34 and the Bollinger middle band at $0.33. Deeper pullbacks would expose the former downtrend break level at $0.31 and then the Bollinger lower band near $0.29, where buyers could attempt to reassert the broader bullish structure.
(The technical analysis of this story was written with the help of an AI tool. Know more.)
Bitcoin, altcoins, stablecoins FAQs
Bitcoin is the largest cryptocurrency by market capitalization, a virtual currency designed to serve as money. This form of payment cannot be controlled by any one person, group, or entity, which eliminates the need for third-party participation during financial transactions.
Altcoins are any cryptocurrency apart from Bitcoin, but some also regard Ethereum as a non-altcoin because it is from these two cryptocurrencies that forking happens. If this is true, then Litecoin is the first altcoin, forked from the Bitcoin protocol and, therefore, an “improved” version of it.
Stablecoins are cryptocurrencies designed to have a stable price, with their value backed by a reserve of the asset it represents. To achieve this, the value of any one stablecoin is pegged to a commodity or financial instrument, such as the US Dollar (USD), with its supply regulated by an algorithm or demand. The main goal of stablecoins is to provide an on/off-ramp for investors willing to trade and invest in cryptocurrencies. Stablecoins also allow investors to store value since cryptocurrencies, in general, are subject to volatility.
Bitcoin dominance is the ratio of Bitcoin's market capitalization to the total market capitalization of all cryptocurrencies combined. It provides a clear picture of Bitcoin’s interest among investors. A high BTC dominance typically happens before and during a bull run, in which investors resort to investing in relatively stable and high market capitalization cryptocurrency like Bitcoin. A drop in BTC dominance usually means that investors are moving their capital and/or profits to altcoins in a quest for higher returns, which usually triggers an explosion of altcoin rallies.
추천 기사


