


Dow Jones Industrial Average learns the old war playbook now runs in reverse
- DJIA surrendered 700 points after Washington declared the Iran ceasefire over and promised further strikes overnight.
- Crude Oil's near-8% surge dragged Treasury yields and Federal Reserve hike odds higher together, cancelling the safe-haven cushion that once softened geopolitical shocks.
- FOMC minutes land at 18:00 GMT with July hike odds already better than one in three; jobless claims and a New York Fed appearance follow Thursday.
The Dow Jones Industrial Average opened Wednesday within a few points of its 52,847 session high and spent the rest of the day paying down three weeks of ceasefire faith, giving back 700 points through the day. President Donald Trump told the North Atlantic Treaty Organization summit in Ankara that the ceasefire with Iran is over, and equities repriced the region's risk premium in a single session.
One podium in Ankara, one repricing
Trump's declaration followed Tuesday's attacks on three commercial vessels in the Strait of Hormuz, which drew an American response described as a series of powerful strikes against more than 80 Iranian targets, from air defence systems to anti-ship missile batteries. The president dismissed further dealings with Tehran as a waste of time and promised to hit the country hard again overnight, while the Treasury revoked the waiver that had allowed Iranian barrels back onto the world market.
Energy markets did the arithmetic immediately; Brent futures jumped 8% to $80.07 and West Texas Intermediate popped 7.6% to $75.77. NATO Secretary General Mark Rutte called the American strikes absolutely necessary, which told traders the alliance now treats escalation as policy rather than accident. Europe's Stoxx 600 closed nearly 2% lower with energy producers the only group spared.
The safe-haven trade forgot to show up
The classic sequence had missiles flying, Treasuries rallying, the Federal Reserve turning patient, and equity dip-buyers collecting the rebound. Wednesday inverted every step of it; the 10-year yield climbed to 4.58% from 4.55%, against 3.97% before the war began, while Gold slid below $4,100 into a firmer Dollar.
Bank of America's technical desk now maps the 10-year toward 4.65% and potentially 4.82% while the yield holds above 4.45%, and rate futures price roughly one-in-three odds of a hike at the July 29 meeting with better-than-even odds of at least one increase by September. Crude Oil parked in a $70 to $90 band reads as moderately inflationary to a committee that has already stripped out its easing bias, so a supply shock now tightens policy expectations instead of loosening them. That combination taxes equity multiples directly, and the index's rate-sensitive cyclicals paid most of the bill.
Winners, losers, and a stubborn dip bid
Inside the average, Chevron rose 2% on the energy bid while Home Depot fell 3% and McDonald's lost more than 1% as fuel-cost math worked through consumer names. The damage ran wider outside the index; materials tracked toward their worst session in more than a year, travel names sold off, and Marathon Petroleum ran 5% higher as refiners priced the new supply reality.
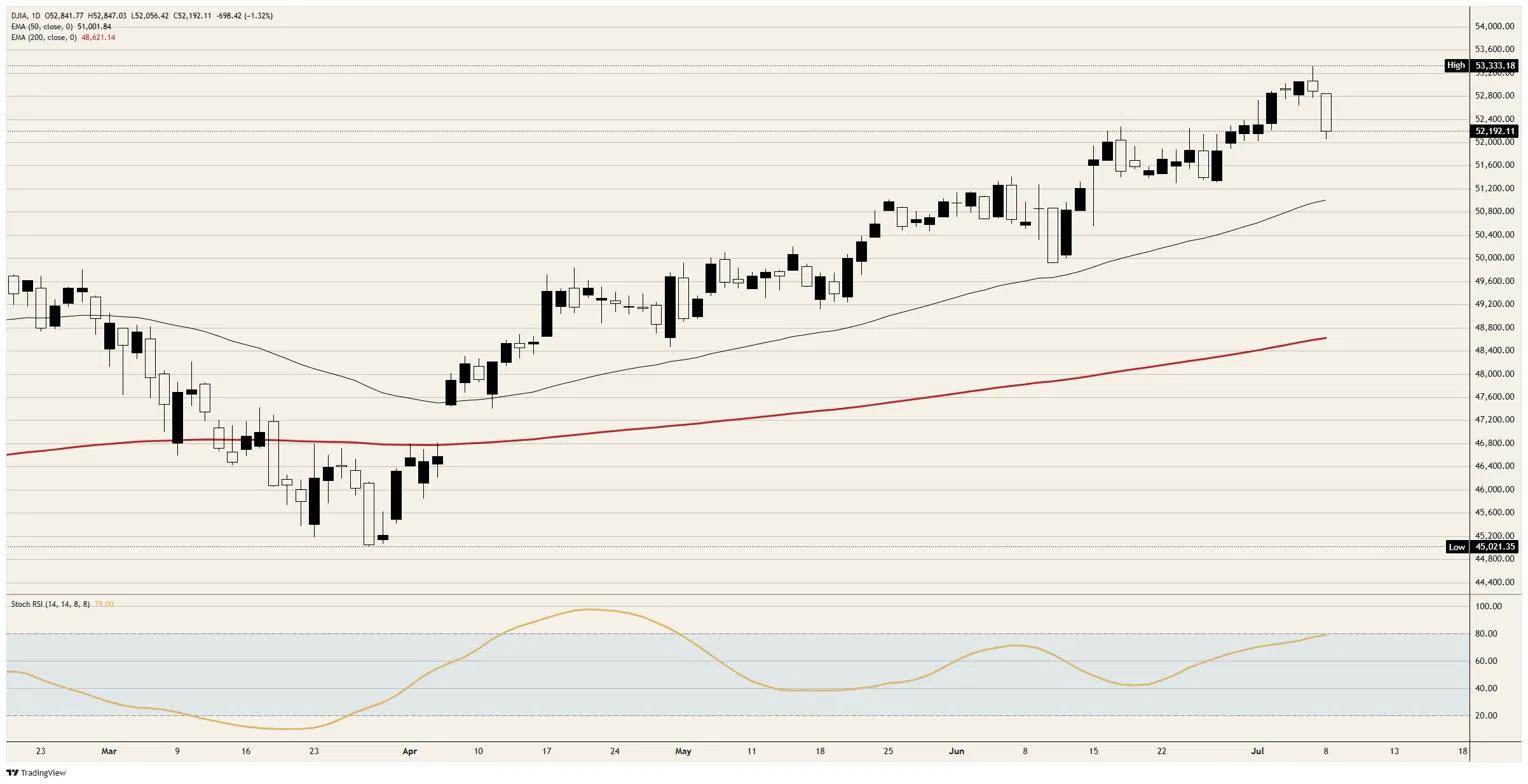
The tape itself refused to capitulate cleanly even with more strikes promised overnight. A midday rebound stalled at 52,500, the afternoon washout printed 52,056, and buyers still lifted the index more than 130 points off the low into the close. That reflex has paid all quarter, and RBC Wealth Management's strategy desk still treats flare-ups as the base case rather than regime change, yet the daily Stochastic Relative Strength Index rolling over from 79 after this week's record print at 53,333 says the headline hit a stretched tape, not a braced one.
Minutes first, claims later
Federal Open Market Committee minutes due at 18:00 GMT carry the first internal accounting of the new Chair's first meeting, where rates held and the guidance tilted toward further tightening if inflation persists. The Chair has already characterized that debate as contentious, so the size of the hike camp is the detail that moves pricing, and hawkish minutes stapled to a Crude Oil shock would finish what the morning started.
The data backdrop gives the hawks material; Monday's Institute for Supply Management services survey printed 54.0 with prices paid easing to 67.7 from 71.3 and employment back in expansion at 51.2, while the four-week ADP payroll average slipped to 21,000. Thursday brings initial jobless claims at 12:30 GMT, with 218K expected against 215K prior, a New York Fed president appearance at 13:00 GMT, and June existing home sales at 14:00 GMT. Minutes soft enough to cap yields hand the dip bid its opening; anything else leaves rallies for sale.
Dow Jones Industrial Average technical levels to watch
Resistance: The 52,500 intraday rebound cap is the first obstacle; beyond it sit the 52,850 breakdown origin and the 53,000 round handle, which guard the approach to this week's record at 53,333.
Support: Wednesday's 52,056 session low rests just above the 52,000 round handle, and a daily close through both exposes late-June congestion near 51,600 with the 50-day Exponential Moving Average waiting just above 51,000.
Bias: Lower; rallies into 52,500 are for selling while Crude Oil holds its bid and hike odds climb, and only a daily close back above 52,850 puts the record run back on the board.
Dow Jones daily chart
Dow Jones FAQs
The Dow Jones Industrial Average, one of the oldest stock market indices in the world, is compiled of the 30 most traded stocks in the US. The index is price-weighted rather than weighted by capitalization. It is calculated by summing the prices of the constituent stocks and dividing them by a factor, currently 0.152. The index was founded by Charles Dow, who also founded the Wall Street Journal. In later years it has been criticized for not being broadly representative enough because it only tracks 30 conglomerates, unlike broader indices such as the S&P 500.
Many different factors drive the Dow Jones Industrial Average (DJIA). The aggregate performance of the component companies revealed in quarterly company earnings reports is the main one. US and global macroeconomic data also contributes as it impacts on investor sentiment. The level of interest rates, set by the Federal Reserve (Fed), also influences the DJIA as it affects the cost of credit, on which many corporations are heavily reliant. Therefore, inflation can be a major driver as well as other metrics which impact the Fed decisions.
Dow Theory is a method for identifying the primary trend of the stock market developed by Charles Dow. A key step is to compare the direction of the Dow Jones Industrial Average (DJIA) and the Dow Jones Transportation Average (DJTA) and only follow trends where both are moving in the same direction. Volume is a confirmatory criteria. The theory uses elements of peak and trough analysis. Dow’s theory posits three trend phases: accumulation, when smart money starts buying or selling; public participation, when the wider public joins in; and distribution, when the smart money exits.
There are a number of ways to trade the DJIA. One is to use ETFs which allow investors to trade the DJIA as a single security, rather than having to buy shares in all 30 constituent companies. A leading example is the SPDR Dow Jones Industrial Average ETF (DIA). DJIA futures contracts enable traders to speculate on the future value of the index and Options provide the right, but not the obligation, to buy or sell the index at a predetermined price in the future. Mutual funds enable investors to buy a share of a diversified portfolio of DJIA stocks thus providing exposure to the overall index.
추천 기사


