


Dow Jones Industrial Average extends ceasefire rally as Netanyahu opens Lebanon talks
- Wall Street rose for a second straight session as traders bet the US-Iran ceasefire can hold despite early violations.
- The Dow added over 300 points, closing above 48,000 for the first time in over a month.
- Oil prices rebounded above $98 per barrel but retreated after Israel signaled willingness to negotiate with Lebanon.
- February PCE inflation data came inline with expectations while Q4 GDP growth was revised lower.
The Dow Jones Industrial Average climbed around 300 points on Thursday, or roughly 0.7%, extending a two-day rally that has seen the index recover sharply from its war-era lows. The S&P 500 added 0.6%, and the Nasdaq Composite gained 0.7% as risk appetite held up despite growing doubts about the durability of the two-week ceasefire between the US and Iran.
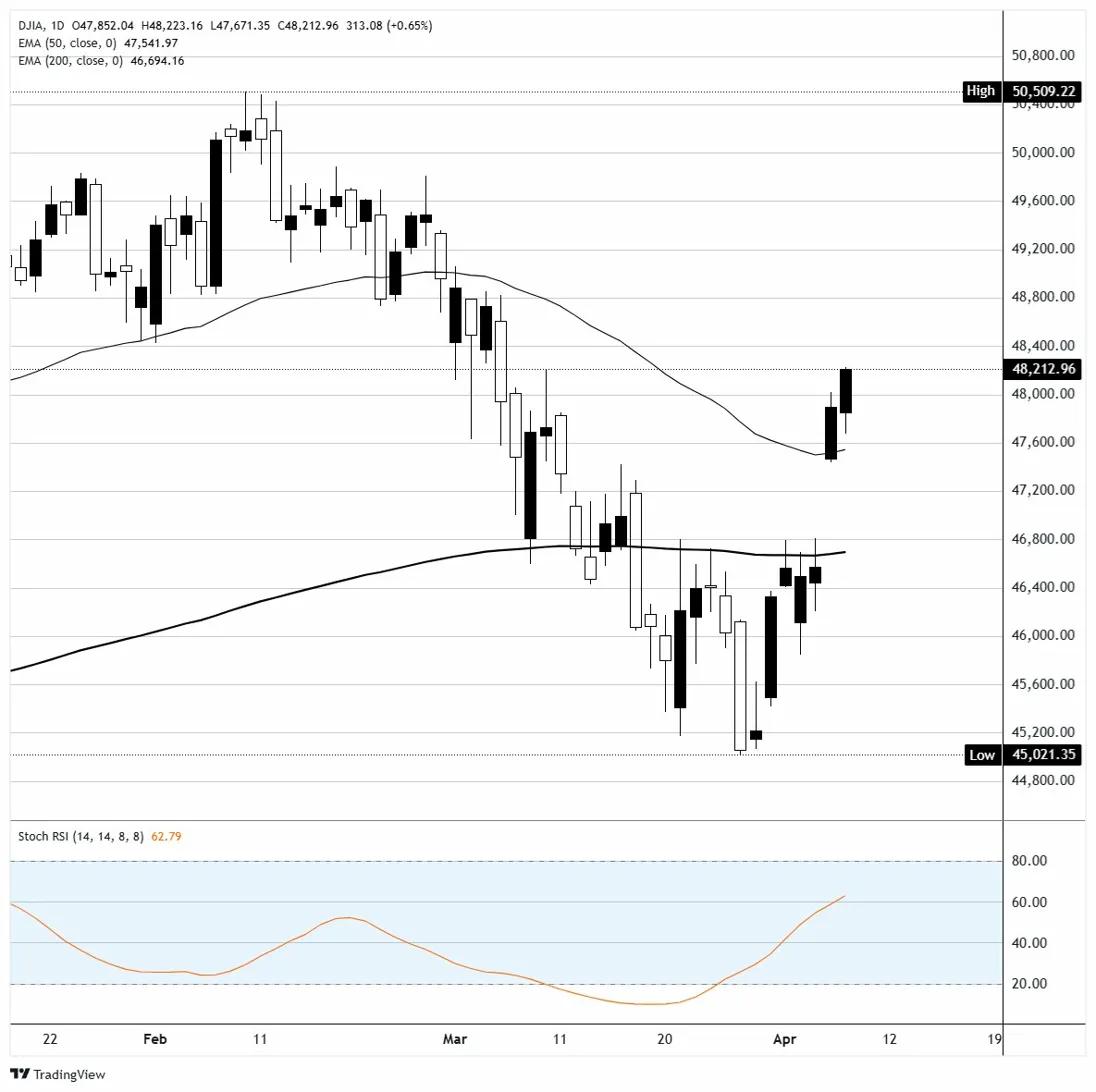
The index is now trading above 48,000 after bouncing firmly off the 200-day exponential moving average (EMA) near 46,700 and reclaiming the 50-day EMA around 47,550. The Stochastic RSI on the daily chart is pushing above 60, suggesting bullish momentum is building but not yet overextended. Resistance looms near the 48,200 level, which marks Thursday's close and a zone where price has previously stalled.
Lebanon talks lift sentiment late in the session
Markets got a late-session boost after Israeli Prime Minister Benjamin Netanyahu announced he had instructed his cabinet to begin direct negotiations with Lebanon. The talks, which are expected to start next week at the State Department in Washington, will focus on disarming Hezbollah and establishing peaceful relations between the two countries. The announcement followed calls with President Trump and White House envoy Steve Witkoff, who reportedly urged Netanyahu to scale back strikes on Lebanon to support the broader peace process. Iran's parliamentary speaker, Mohammad Bagher Ghalibaf, had earlier warned that continued Israeli strikes on Hezbollah would carry consequences, calling the attacks a violation of the ceasefire agreement. The S&P 500 moved into the green and Oil prices came off their intraday highs following the Netanyahu statement, as traders interpreted the willingness to negotiate as a step toward de-escalation on the Lebanon front, which had been the primary threat to the fragile truce.
Oil rebounds but the direction remains uncertain
West Texas Intermediate (WTI) futures traded above $98 per barrel on Thursday after briefly topping $100 earlier in the session. International Brent crude futures rose around 1% to above $95. The bounce comes after Wednesday's dramatic intraday plunge of over 10% following the ceasefire announcement. The Strait of Hormuz remains functionally closed, with only some dry cargo bulk carriers traversing the waterway since the deal was struck. Around 230 ships loaded with Oil are reportedly waiting to pass through. The head of the UAE's main oil company said vessels must be allowed to navigate the corridor without conditions. Vice President JD Vance is set to lead a US delegation to Islamabad on Saturday for the first round of direct talks with Iran.
PCE in line, GDP revised lower
Thursday's economic calendar was heavy. The Core Personal Consumption Expenditures Price Index (PCE), the Federal Reserve's (Fed) preferred inflation gauge, came in at 0.4% MoM for February, matching consensus and the prior reading. On a YoY basis, core PCE held at 3%, also in line with expectations. Gross Domestic Product (GDP) growth for Q4 was revised lower to an annualised 0.5%, down from 0.7% previously, suggesting the economy was already losing momentum before the Iran conflict escalated. Initial jobless claims rose to 219K, above the 210K consensus, adding to signs of softening in the labour market. Personal income fell 0.1% MoM, a sharp miss against the 0.3% forecast, though personal spending edged up 0.5%.
Minutes from the Federal Open Market Committee's (FOMC) March meeting, also released this week, revealed that policymakers remain divided. Some members viewed a rate hike as potentially necessary to contain Oil-driven inflation, while others still expected one rate cut this year. The ceasefire has shifted rate expectations meaningfully. At the start of the week, markets had priced out any chance of a cut. Now, futures are beginning to price at least one reduction back into the curve.
Meta jumps on AI model launch
In single-stock action, Meta (META) rose more than 3% on Thursday, extending a 6.5% pop from Wednesday's session. The gains followed the company's launch of Muse Spark, its first major artificial intelligence model developed under the Meta Superintelligence Labs division. The model is proprietary, marking a shift from Meta's previous open-source approach. Defensive names also attracted buying, with Walmart (WMT) and utilities such as Constellation Energy (CEG) trading higher. The broader rally was underpinned by lingering optimism from Wednesday's surge, which saw all three major US indexes jump more than 2%, with the Dow posting its best single-day gain since April 2025.
Looking ahead
Friday's March Consumer Price Index (CPI) report at 12:30 GMT is the week's main event. Consensus expects a 0.9% MoM reading and 3.3% YoY, both sharp increases from February's 0.3% and 2.4% respectively, reflecting the initial pass-through of elevated energy costs. A hot print could quickly revive rate hike expectations and stall the equity rally, while a softer number would reinforce the narrative that the Fed has room to cut later this year. The preliminary April University of Michigan (UoM) consumer sentiment survey, also due Friday, will offer an early read on how the ceasefire is filtering into household confidence. The index is expected to fall to 52 from 53.3.
Dow Jones daily chart
Dow Jones FAQs
The Dow Jones Industrial Average, one of the oldest stock market indices in the world, is compiled of the 30 most traded stocks in the US. The index is price-weighted rather than weighted by capitalization. It is calculated by summing the prices of the constituent stocks and dividing them by a factor, currently 0.152. The index was founded by Charles Dow, who also founded the Wall Street Journal. In later years it has been criticized for not being broadly representative enough because it only tracks 30 conglomerates, unlike broader indices such as the S&P 500.
Many different factors drive the Dow Jones Industrial Average (DJIA). The aggregate performance of the component companies revealed in quarterly company earnings reports is the main one. US and global macroeconomic data also contributes as it impacts on investor sentiment. The level of interest rates, set by the Federal Reserve (Fed), also influences the DJIA as it affects the cost of credit, on which many corporations are heavily reliant. Therefore, inflation can be a major driver as well as other metrics which impact the Fed decisions.
Dow Theory is a method for identifying the primary trend of the stock market developed by Charles Dow. A key step is to compare the direction of the Dow Jones Industrial Average (DJIA) and the Dow Jones Transportation Average (DJTA) and only follow trends where both are moving in the same direction. Volume is a confirmatory criteria. The theory uses elements of peak and trough analysis. Dow’s theory posits three trend phases: accumulation, when smart money starts buying or selling; public participation, when the wider public joins in; and distribution, when the smart money exits.
There are a number of ways to trade the DJIA. One is to use ETFs which allow investors to trade the DJIA as a single security, rather than having to buy shares in all 30 constituent companies. A leading example is the SPDR Dow Jones Industrial Average ETF (DIA). DJIA futures contracts enable traders to speculate on the future value of the index and Options provide the right, but not the obligation, to buy or sell the index at a predetermined price in the future. Mutual funds enable investors to buy a share of a diversified portfolio of DJIA stocks thus providing exposure to the overall index.
추천 기사


