

Dow Jones Industrial Average treads water as stocks await meaningful news
- The Dow Jones stuck close to the middle on Tuesday, holding above 45,000.
- US Durable Goods Orders hit markets without so much as a splash.
- The latest round of key US inflation data looms large later this week.
The Dow Jones Industrial Average (DJIA) spun a tight circle on Tuesday, holding steady near familiar levels as investors await meaningful data or news headlines to get the machine chugging again. Global markets are bracing for the latest round of US Personal Consumption Expenditures Price Index (PCE) inflation due later this week. Federal Reserve (Fed) interest rate cut expectations will hinge on whether the Fed will continue to focus more on slumping jobs data.
Trump attempts to fire Fed officials
US President Donald Trump attempted to declare Fed Board of Governors member Dr. Lisa Cook “fired” on Monday evening, and investors are watching from the sidelines to see how things progress. Donald Trump’s claim of being able to fire Fed members for cause under a century-old amendment, and whether that cause applies to faulty tax filings, are bound to face a steep legal battle moving forward.
Devil's in the details
US Durable Goods Orders declined in July, printing at -2.8%, but the figure still represents a larger rebound from the previous month’s -9.4% than analysts expected. The US Census Bureau noted that, excluding transportation, new orders actually rose by 1.1%. However, excluding defense spending, new orders still decreased by 2.5%. The key missed datapoint in Tuesday’s Durable Goods Orders data was investment in transportation equipment, which declined 9.7%, extending into a third monthly decline over a four-month period.
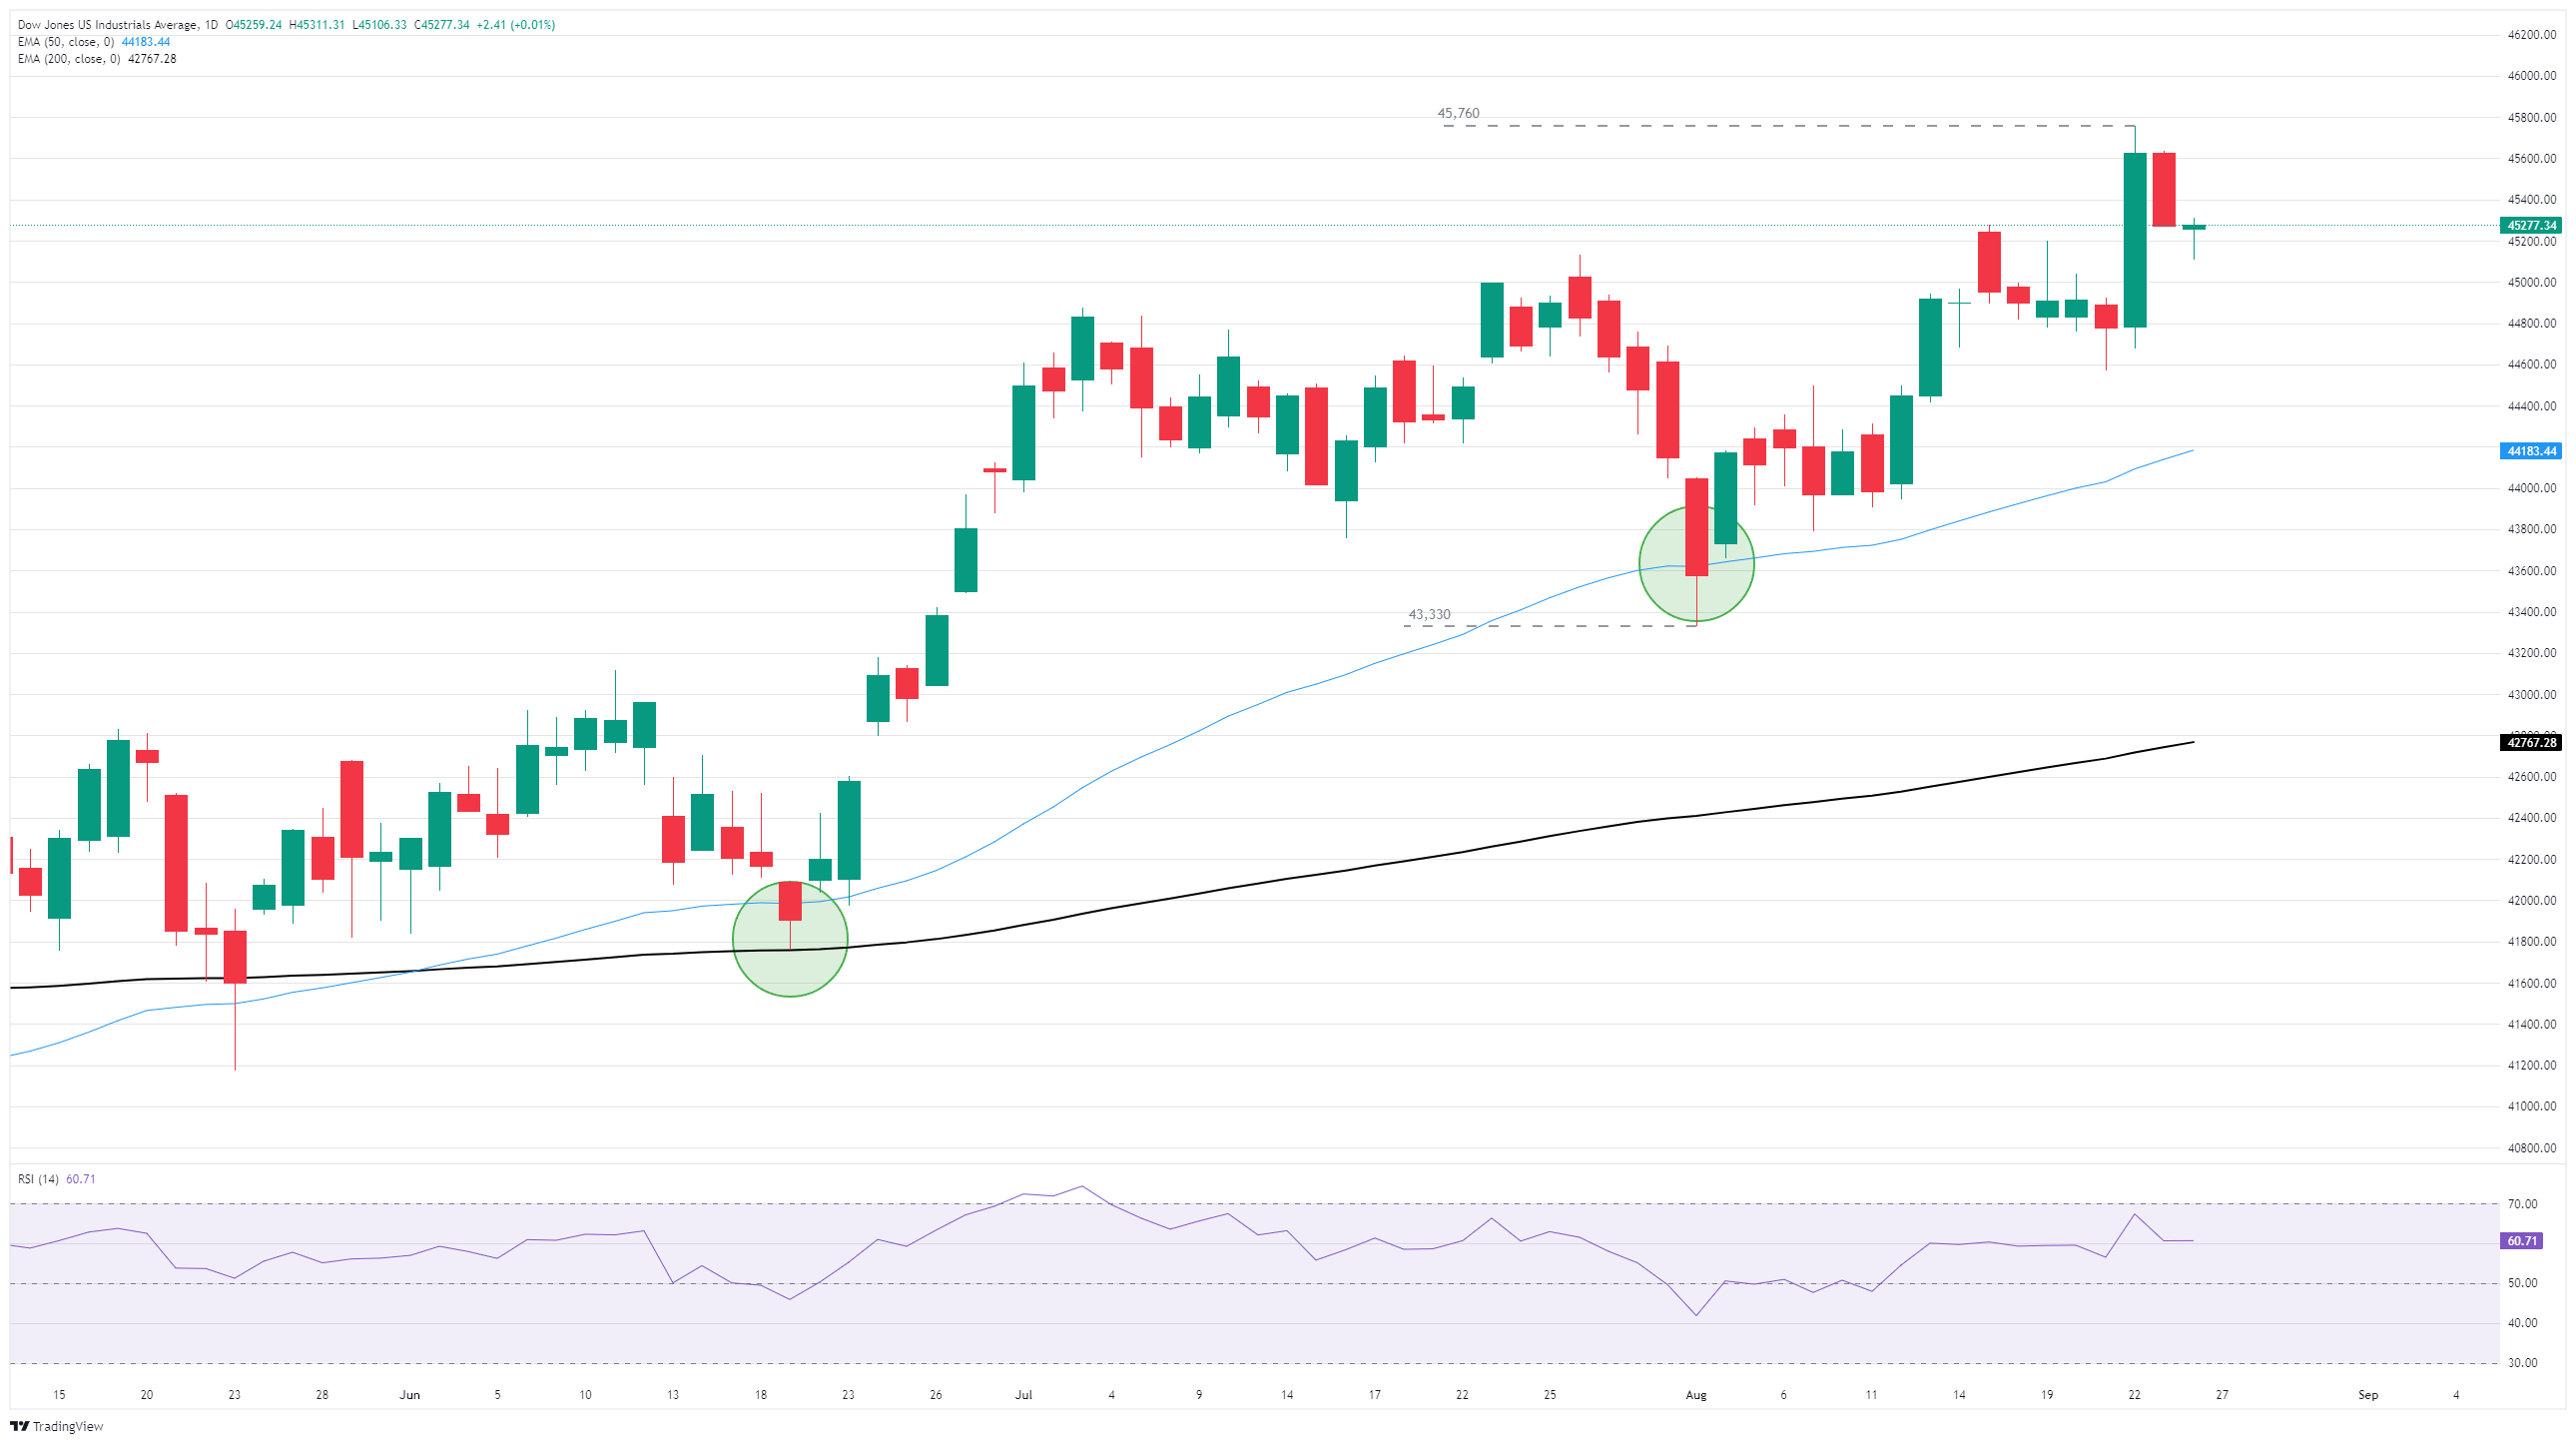
Dow Jones daily chart
Dow Jones FAQs
The Dow Jones Industrial Average, one of the oldest stock market indices in the world, is compiled of the 30 most traded stocks in the US. The index is price-weighted rather than weighted by capitalization. It is calculated by summing the prices of the constituent stocks and dividing them by a factor, currently 0.152. The index was founded by Charles Dow, who also founded the Wall Street Journal. In later years it has been criticized for not being broadly representative enough because it only tracks 30 conglomerates, unlike broader indices such as the S&P 500.
Many different factors drive the Dow Jones Industrial Average (DJIA). The aggregate performance of the component companies revealed in quarterly company earnings reports is the main one. US and global macroeconomic data also contributes as it impacts on investor sentiment. The level of interest rates, set by the Federal Reserve (Fed), also influences the DJIA as it affects the cost of credit, on which many corporations are heavily reliant. Therefore, inflation can be a major driver as well as other metrics which impact the Fed decisions.
Dow Theory is a method for identifying the primary trend of the stock market developed by Charles Dow. A key step is to compare the direction of the Dow Jones Industrial Average (DJIA) and the Dow Jones Transportation Average (DJTA) and only follow trends where both are moving in the same direction. Volume is a confirmatory criteria. The theory uses elements of peak and trough analysis. Dow’s theory posits three trend phases: accumulation, when smart money starts buying or selling; public participation, when the wider public joins in; and distribution, when the smart money exits.
There are a number of ways to trade the DJIA. One is to use ETFs which allow investors to trade the DJIA as a single security, rather than having to buy shares in all 30 constituent companies. A leading example is the SPDR Dow Jones Industrial Average ETF (DIA). DJIA futures contracts enable traders to speculate on the future value of the index and Options provide the right, but not the obligation, to buy or sell the index at a predetermined price in the future. Mutual funds enable investors to buy a share of a diversified portfolio of DJIA stocks thus providing exposure to the overall index.
추천 기사


