

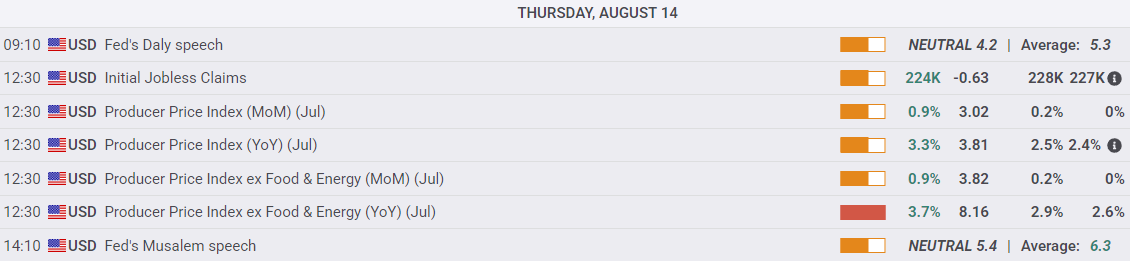
Dow Jones Industrial Average stumbles after PPI inflation soars
- The Dow Jones snapped a two-day winning streak on Thursday.
- US PPI inflation soared to a six-month high in July, erasing months of progress.
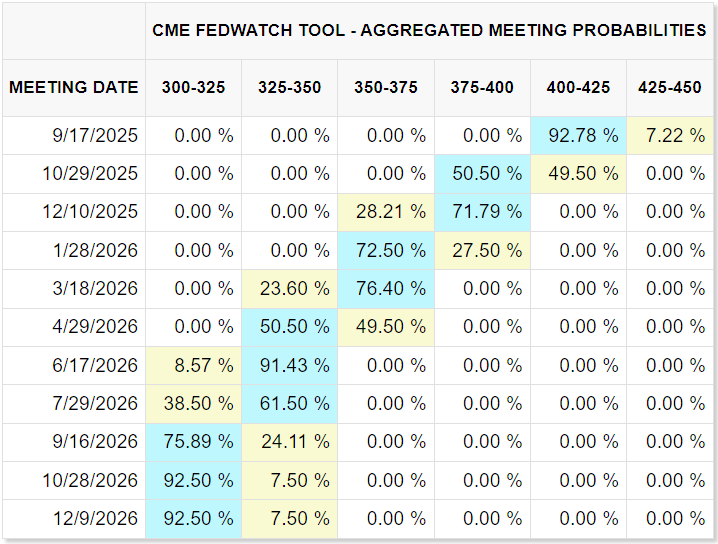
- Fed rate cut bets sank post-PPI, with rate traders yanking a third cut in 2025 off the table.
The Dow Jones Industrial Average (DJIA) declined on Thursday, ending a two-day bullish run and shedding around 200 points. Equities took a hit after United States (US) Producer Price Index (PPI) inflation rose much faster than expected in July, knocking back bets of three Federal Reserve (Fed) interest rate cuts before the end of the year.
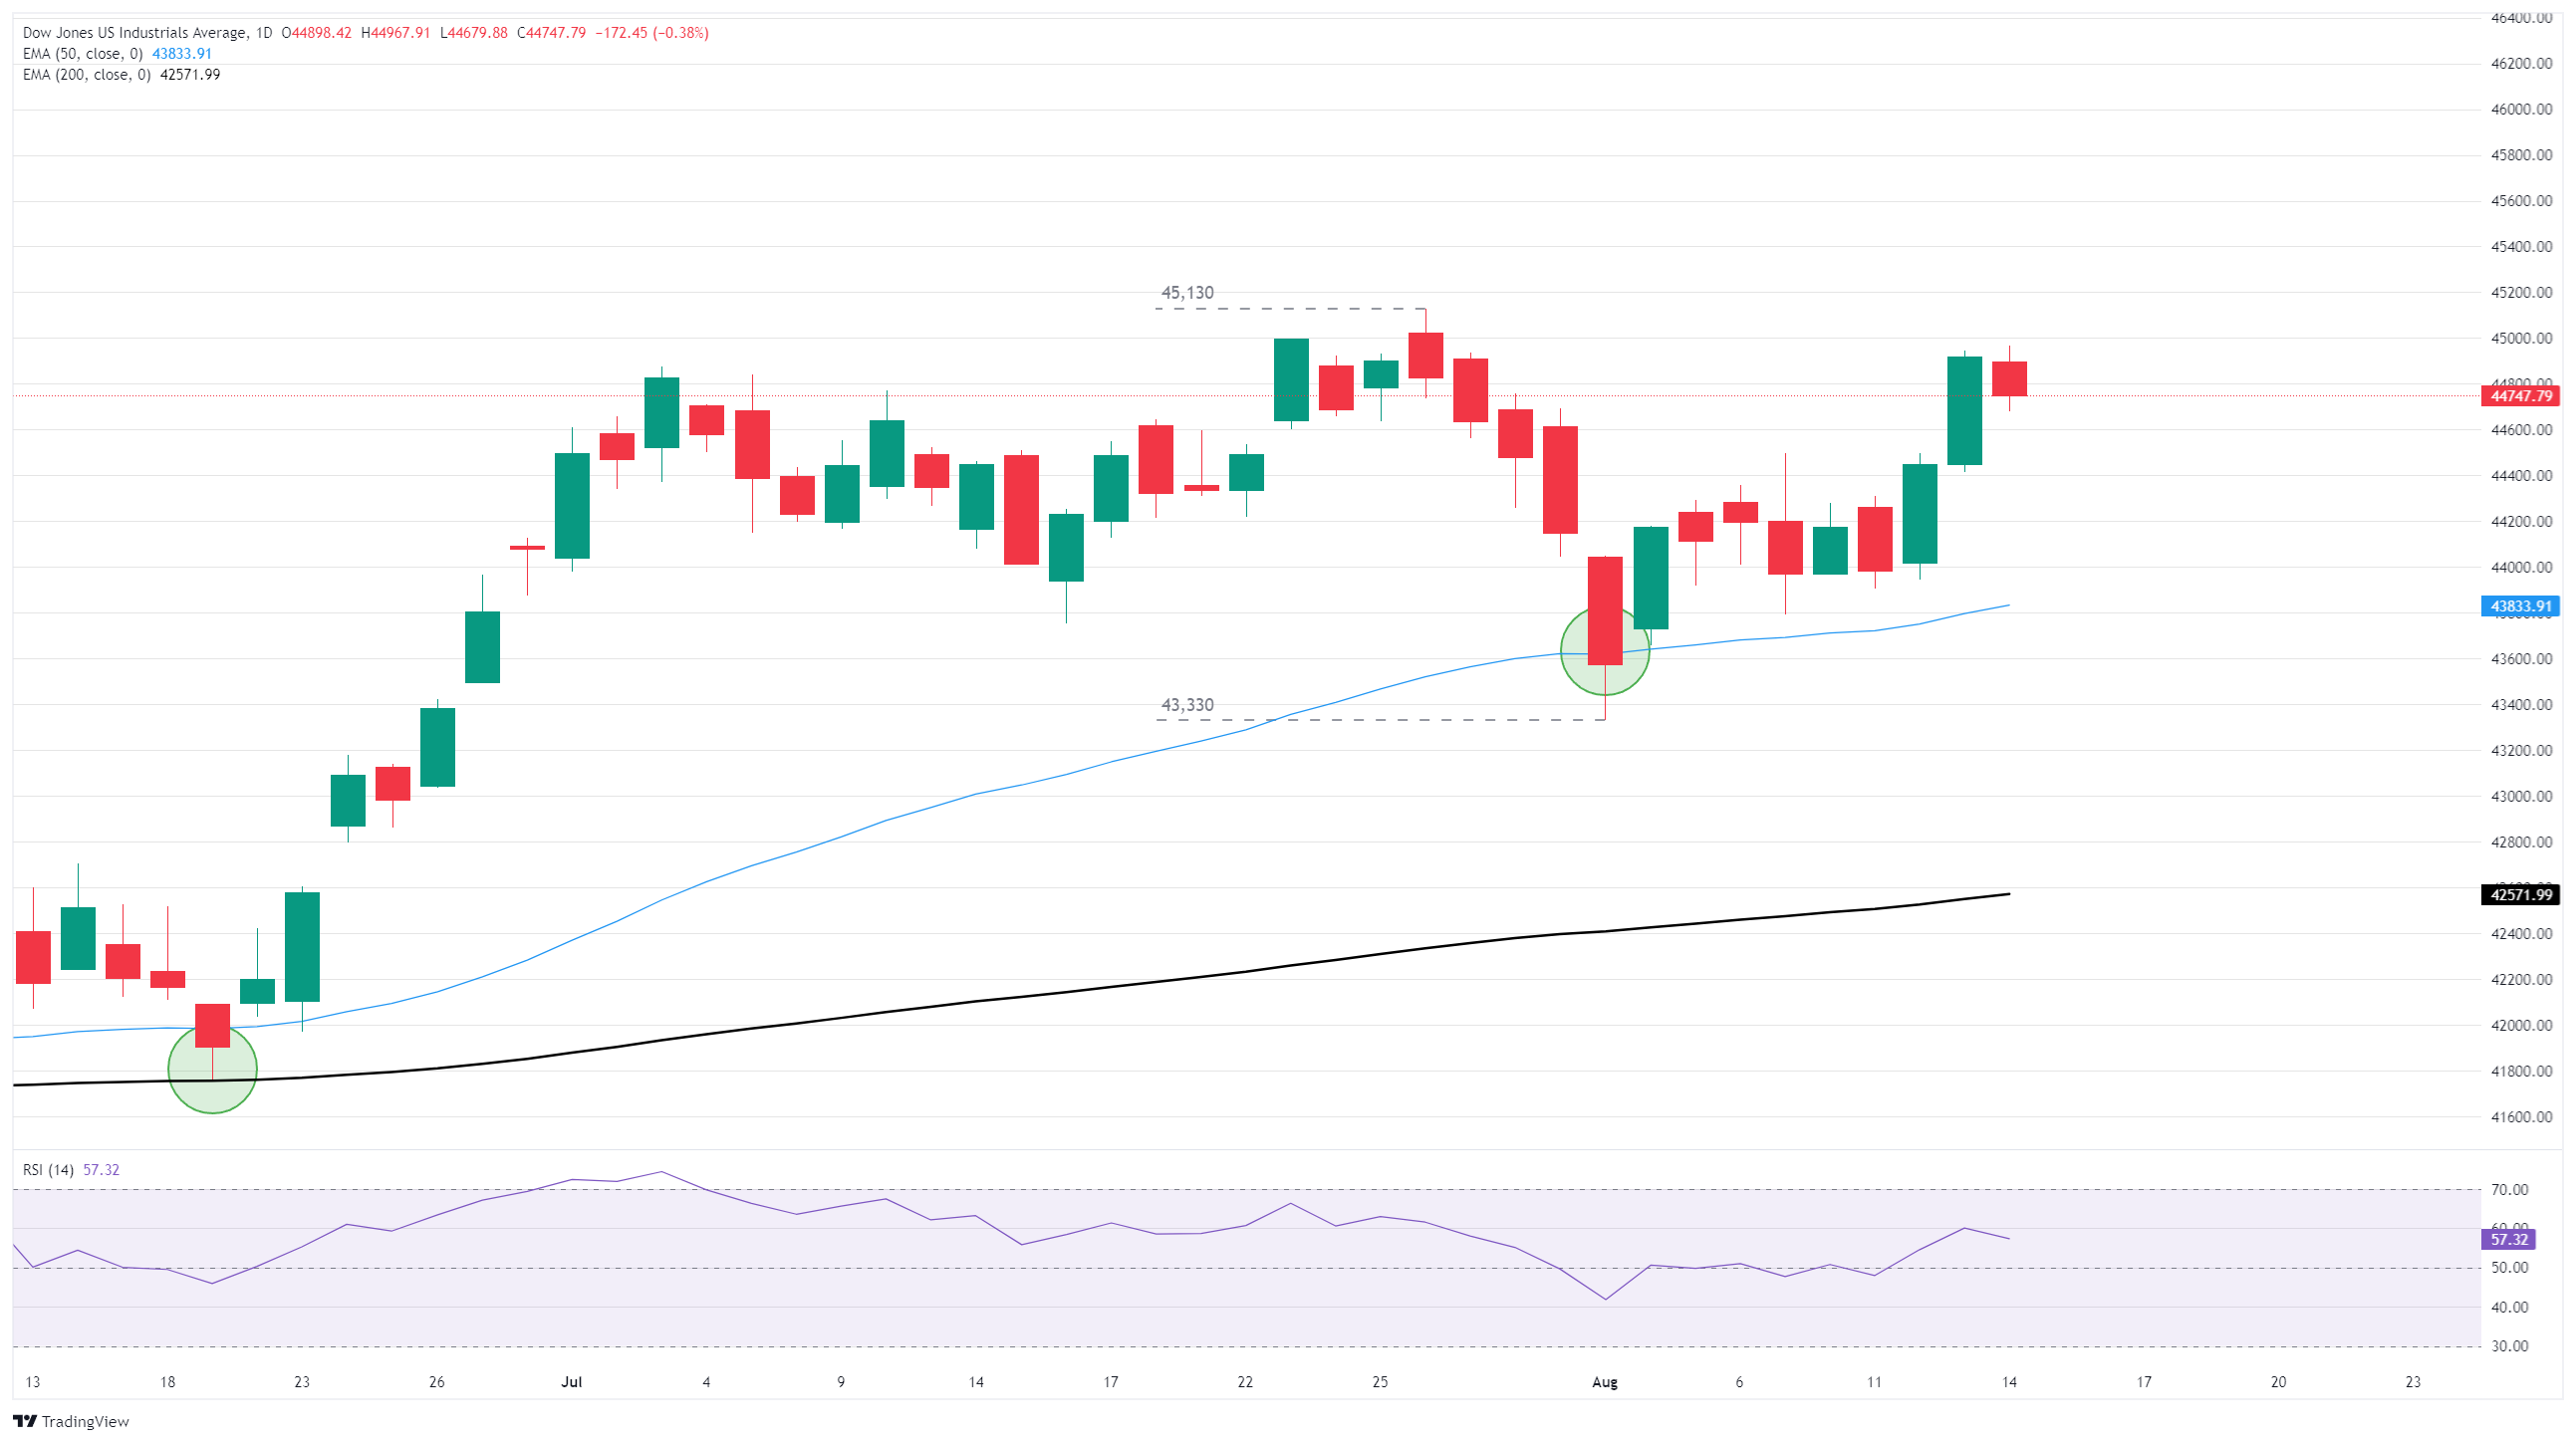
The Dow Jones has fumbled a bullish push to regain the 45,000 major handle, but the major equity index is still trading well into bull country, a full two percent above the 50-day Exponential Moving Average (EMA) near 43,830. Despite fresh weakness on disappointing macro data, the Dow has still managed to claw out nearly 3.8% bottom-to-top from its last swing low.
US PPI rises sharply in July, trims Fed rate cut bets
Core US PPI inflation accelerated to 3.7% YoY in July versus the expected rise to 2.9%, wiping out four months of progress on taming inflation and pushing producer-level price pressures back to where they were when the year started. Headline PPI inflation also rose to a six-month high of 3.3% over the same period, while the previous period saw a slight upside revision to 2.4%.
Interest rate markets are still pricing in over 90% odds of a quarter-point interest rate cut when the Fed makes its next rate call on September 17, but hopes for a new rate-cutting cycle were dashed by Thursday’s sharp increase in business-level inflation. According to the CME’s FedWatch tool, interest rate markets are now pricing in barely even odds of a second interest rate cut in October, and less than 30% odds of a third cut in December.
Dow Jones 5-minute chart

Dow Jones daily chart
Dow Jones FAQs
The Dow Jones Industrial Average, one of the oldest stock market indices in the world, is compiled of the 30 most traded stocks in the US. The index is price-weighted rather than weighted by capitalization. It is calculated by summing the prices of the constituent stocks and dividing them by a factor, currently 0.152. The index was founded by Charles Dow, who also founded the Wall Street Journal. In later years it has been criticized for not being broadly representative enough because it only tracks 30 conglomerates, unlike broader indices such as the S&P 500.
Many different factors drive the Dow Jones Industrial Average (DJIA). The aggregate performance of the component companies revealed in quarterly company earnings reports is the main one. US and global macroeconomic data also contributes as it impacts on investor sentiment. The level of interest rates, set by the Federal Reserve (Fed), also influences the DJIA as it affects the cost of credit, on which many corporations are heavily reliant. Therefore, inflation can be a major driver as well as other metrics which impact the Fed decisions.
Dow Theory is a method for identifying the primary trend of the stock market developed by Charles Dow. A key step is to compare the direction of the Dow Jones Industrial Average (DJIA) and the Dow Jones Transportation Average (DJTA) and only follow trends where both are moving in the same direction. Volume is a confirmatory criteria. The theory uses elements of peak and trough analysis. Dow’s theory posits three trend phases: accumulation, when smart money starts buying or selling; public participation, when the wider public joins in; and distribution, when the smart money exits.
There are a number of ways to trade the DJIA. One is to use ETFs which allow investors to trade the DJIA as a single security, rather than having to buy shares in all 30 constituent companies. A leading example is the SPDR Dow Jones Industrial Average ETF (DIA). DJIA futures contracts enable traders to speculate on the future value of the index and Options provide the right, but not the obligation, to buy or sell the index at a predetermined price in the future. Mutual funds enable investors to buy a share of a diversified portfolio of DJIA stocks thus providing exposure to the overall index.
추천 기사


