
Solana Price Forecast: SOL recovery eyes $180 as dead cat bounce risk looms
- Solana extends recovery as the second round of US-China trade talks starts on Monday.
- The recovery boosts optimism in Solana derivatives, resulting in a surge in Open Interest and increased buy volume.
- The technical outlook suggests an extended recovery for Solana if it can hold the psychological support level at $150.
Solana (SOL) edges higher by over 1.50% at press time on Monday after three consecutive days of growth, signaling a recovery trend in motion. The rising optimism in the crypto market is due to the second round of US-China trade talks later in the day. Despite this, the upbeat sentiment in Solana derivatives fuels the surge in Open Interest (OI), and the technical outlook projects an uptrend to $180 if bulls hold the fort above the $150 psychological level.
Solana’s breakthrough above $150 eyes $180
Solana recovers to $154 at the time of writing, with its fourth consecutive bullish candle in progress, crossing above Thursday’s 5.85% drop. The reversal rally accounts for a surge of over 7% and reclaims the $150 psychological level.
Solana has maintained dominance for over a month, holding the crucial $142 support level, which aligns with the 23.6% Fibonacci retracement level, drawn from Solana’s highest closing price at $261 on January 18 to its lowest closing price in April at $105.
As the uptrend continues, a daily closing above $157, the highest closing price in a week, could prolong the uptrend to $183, aligning with the 50% Fibonacci level.
The Relative Strength Index (RSI) points higher at 45, having bounced off the oversold boundary in the daily chart, indicating fading bearish pressure. However, traders must wait for RSI to cross above the halfway level to signal a new bullish momentum in motion.
Similarly, the Moving Average Convergence/Divergence (MACD) indicator is on the verge of triggering a buy signal. The blue line is approaching to cross above the red line, indicating the start of a bullish trend. Traders could wait for the blue and red lines to surface above the zero line to avoid false signals.

SOL/USDT daily price chart. Source: Tradingview
Conversely, a failure to close above $157 could result in Solana retesting the 23.6% Fibonacci level at $142. A closing below the Fibonacci level and the $140 zone could extend the declining trend to April’s lowest closing at $105.
Solana derivatives witness a power shift
As Solana reclaims the $150 psychological level, the gradual recovery fuels the optimism in the derivatives market. The SOL Open Interest has increased by 2.20% in 24 hours, reaching $6.55 billion, and reflecting a rise in capital flow in Solana derivatives.
The OI-weighted funding rate flips positive to 0.0053%, indicating that bulls are willing to pay a premium to bears, which is necessary to keep the swap prices aligned with spot prices.
Furthermore, the increased short liquidations rose to $5.12 million in the past 24 hours, as compared to $1.77 million in long liquidations. As a significant value of bearish-aligned positions is wiped off in Solana derivatives, the bullish dominance grows.
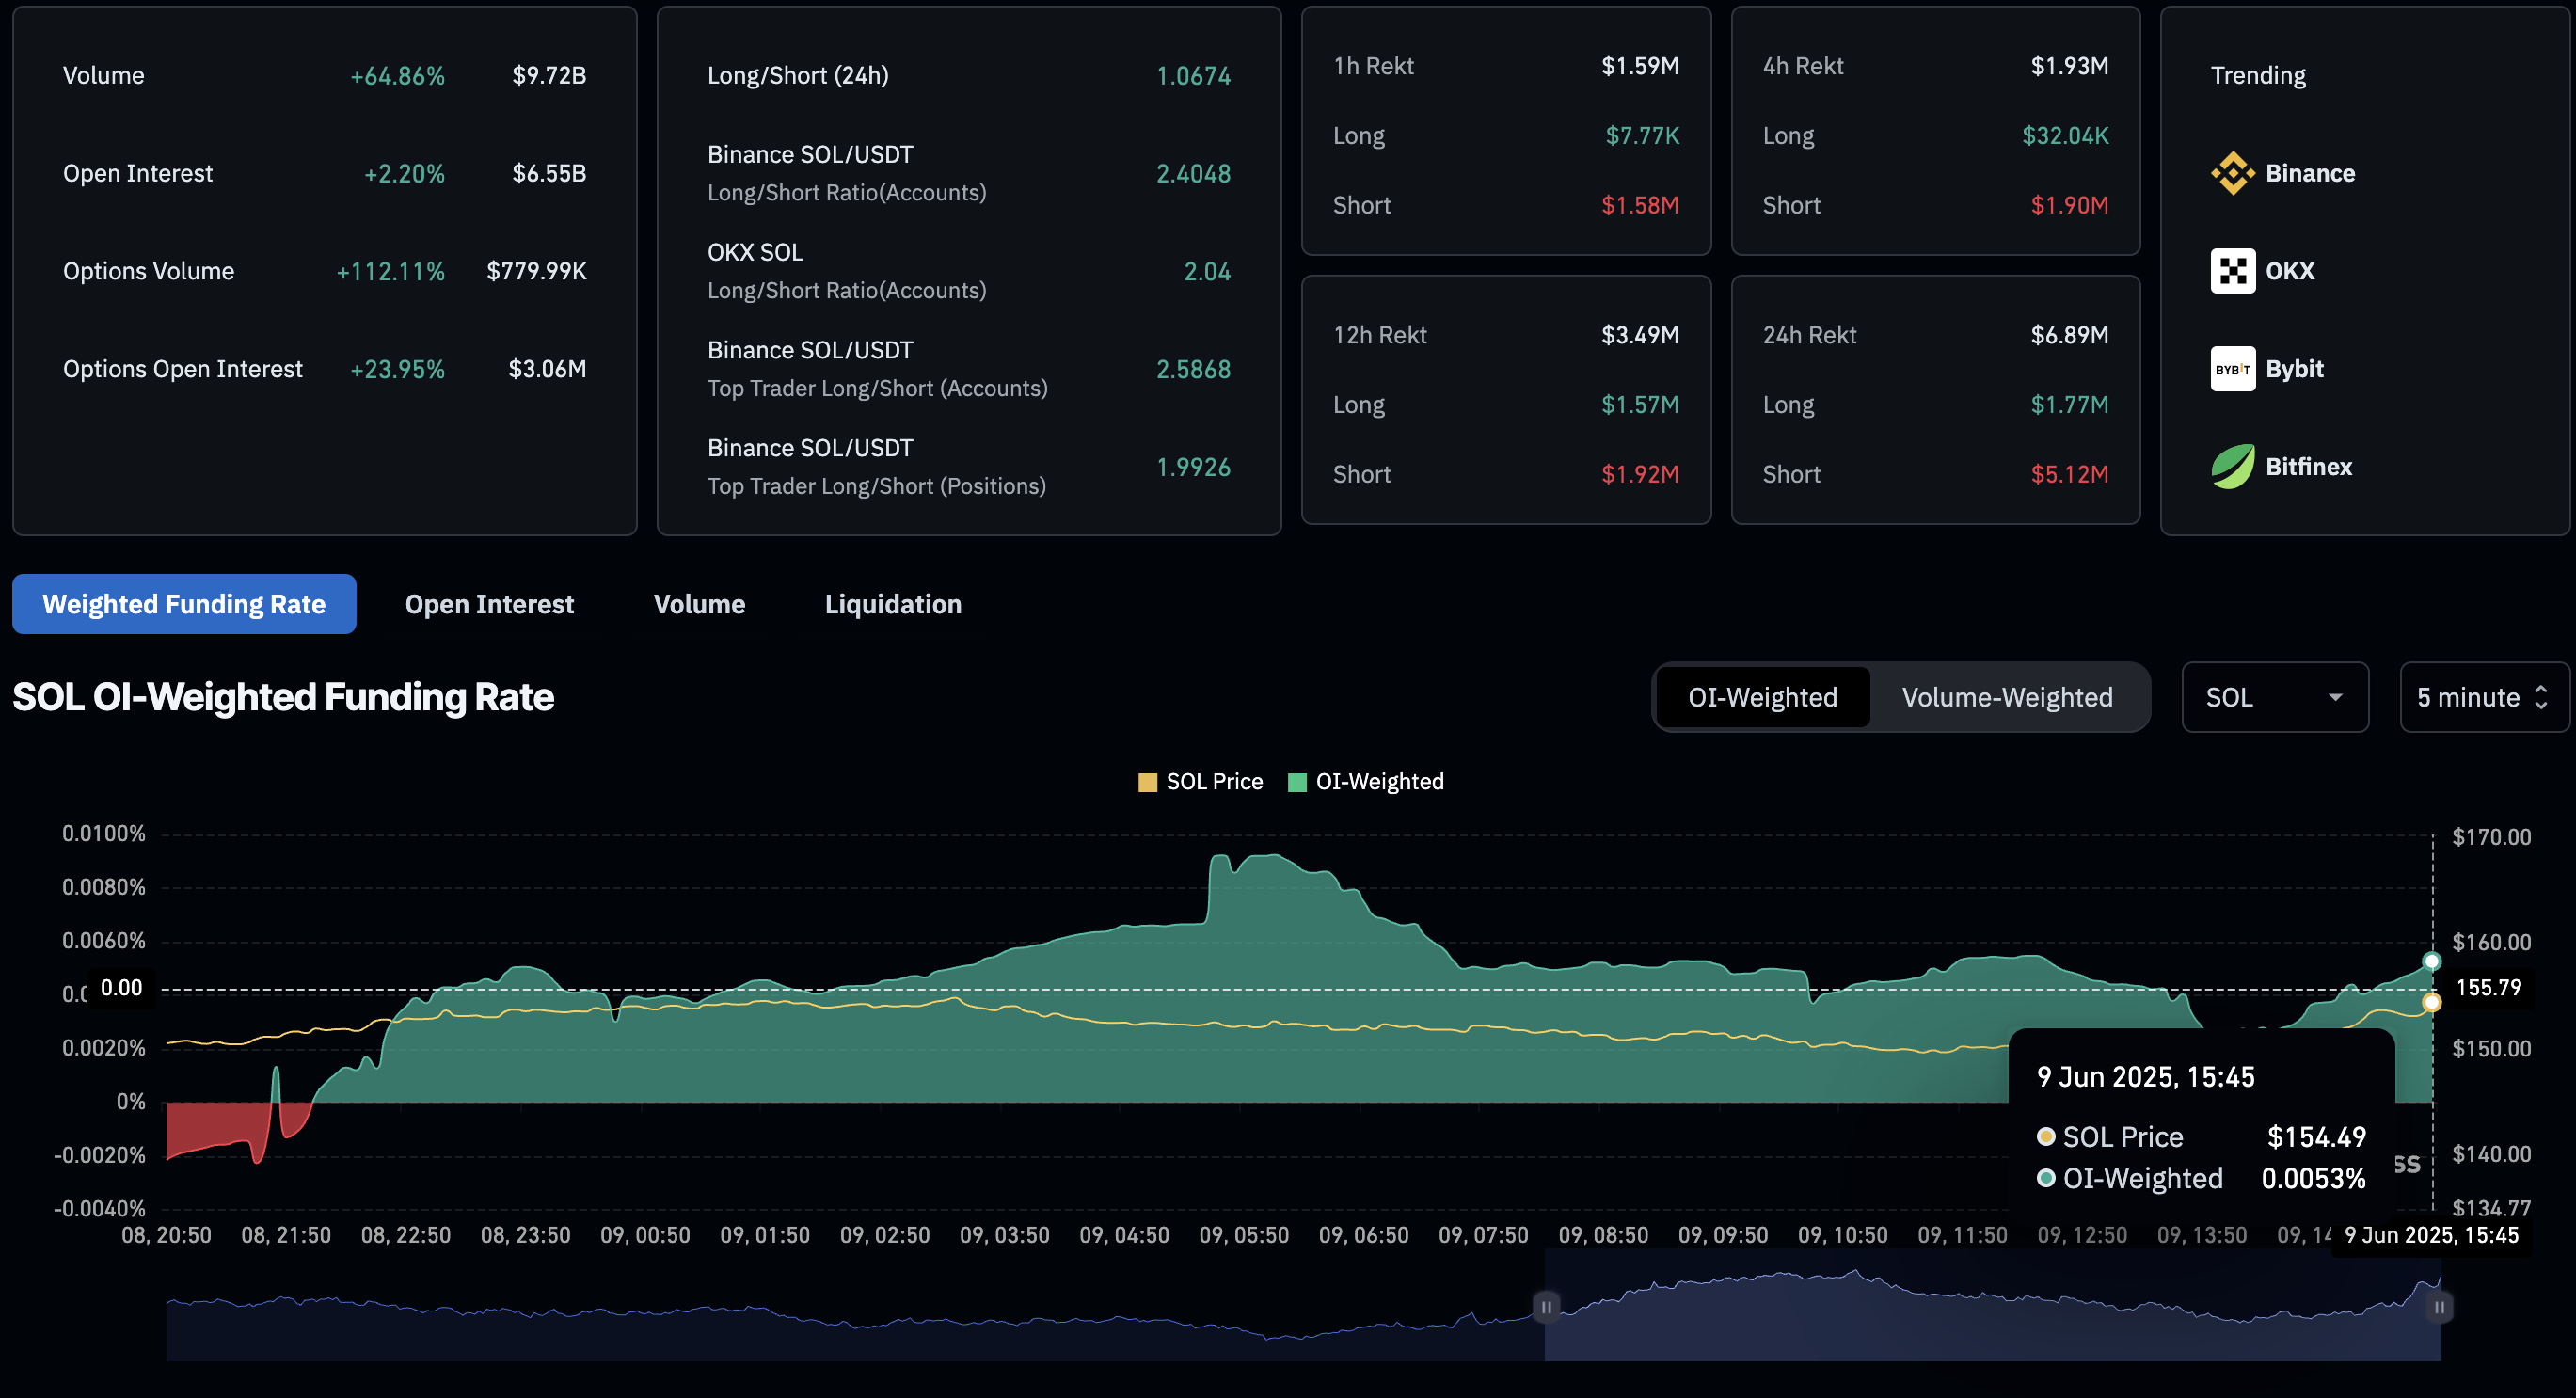
Solana Derivatives. Source: Coinglass
Finally, the SOL Long/Short Ratio, which uses the taker buy/sell volume, indicates a ratio of 1.3861 over the past 4 hours, cementing the bullish dominance. The indicator reflects 58.09% of the volume in the past 4 hours coming from long positions, signaling a rising bullish inclination among derivative traders.
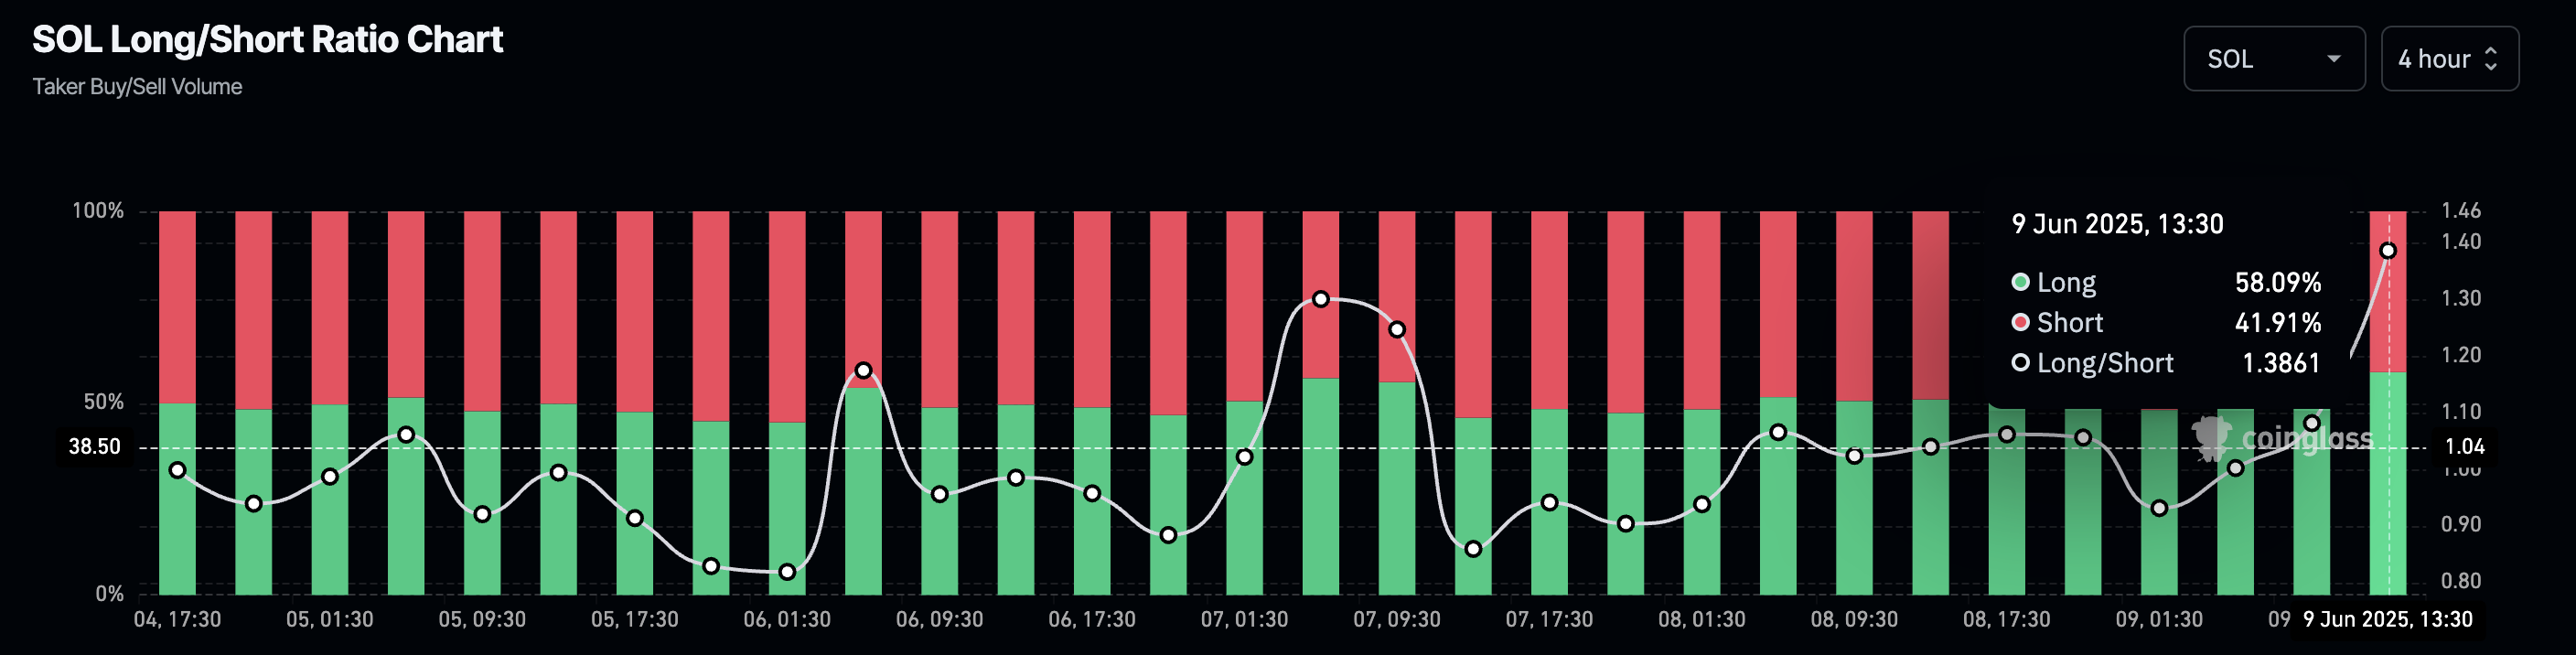
Solana Long/Short Ratio Chart. Source: Coinglass
추천 기사


