
AI coins to watch this week: AI16Z, FET, VIRTUAL show signs of bullish recovery
- Mild gains early in the week indicate an optimistic outlook for AI agent tokens such as FET and VIRTUAL.
- AI16Z records double-digit gains with the MACD indicator reflecting the bullishness.
- The technical outlook for AI agents suggests a prolonged recovery ahead this week.
The Artificial Intelligence (AI) agent tokens are likely to lead the next segment rally in the cryptocurrency market, driven by a 14% increase in AI16Z (ai16z) over the last 24 hours at press time. The Artificial Superintelligence Alliance (FET) and Virtuals Protocol (VIRTUAL) signal potential recovery despite a lower magnitude price surge, driving investors’ interest in this emerging next-gen segment.
AI16Z upholds bullish trend
With an over 12% surge on Sunday, the ai16z token trades at $0.2461 at press time on Monday, experiencing an almost 3% intraday pullback. However, the price action on the 4-hour timeframe reflects a quick V-shaped recovery in the AI agent token, signaling an extended rally.
The ai16z token rallied 275% from $0.1036 on April 9 to $0.3891 on May 12, before taking a sharp pullback to $0.1982. The ongoing rally concludes the short-term intense pullback with a 20% hike on the weekends.
Supporting the uptrend chances, the Moving Average Convergence/Divergence (MACD) crosses above its signal line, triggering a bullish crossover. This reflects a surge in trend momentum as the rally grows intense.
AI16Z’s recovery surpasses the 50% retracement level at $0.2464 highlighted by the Fibonacci retracement over the 275% rally. This marks a sustenance of the rally, putting the 23.6% Fibonacci level at $0.3217 on bullish radars. However, a short-term hurdle is present at the 50-period Exponential Moving Average (EMA) at $0.2613, followed by the 200-period EMA at $0.2749.
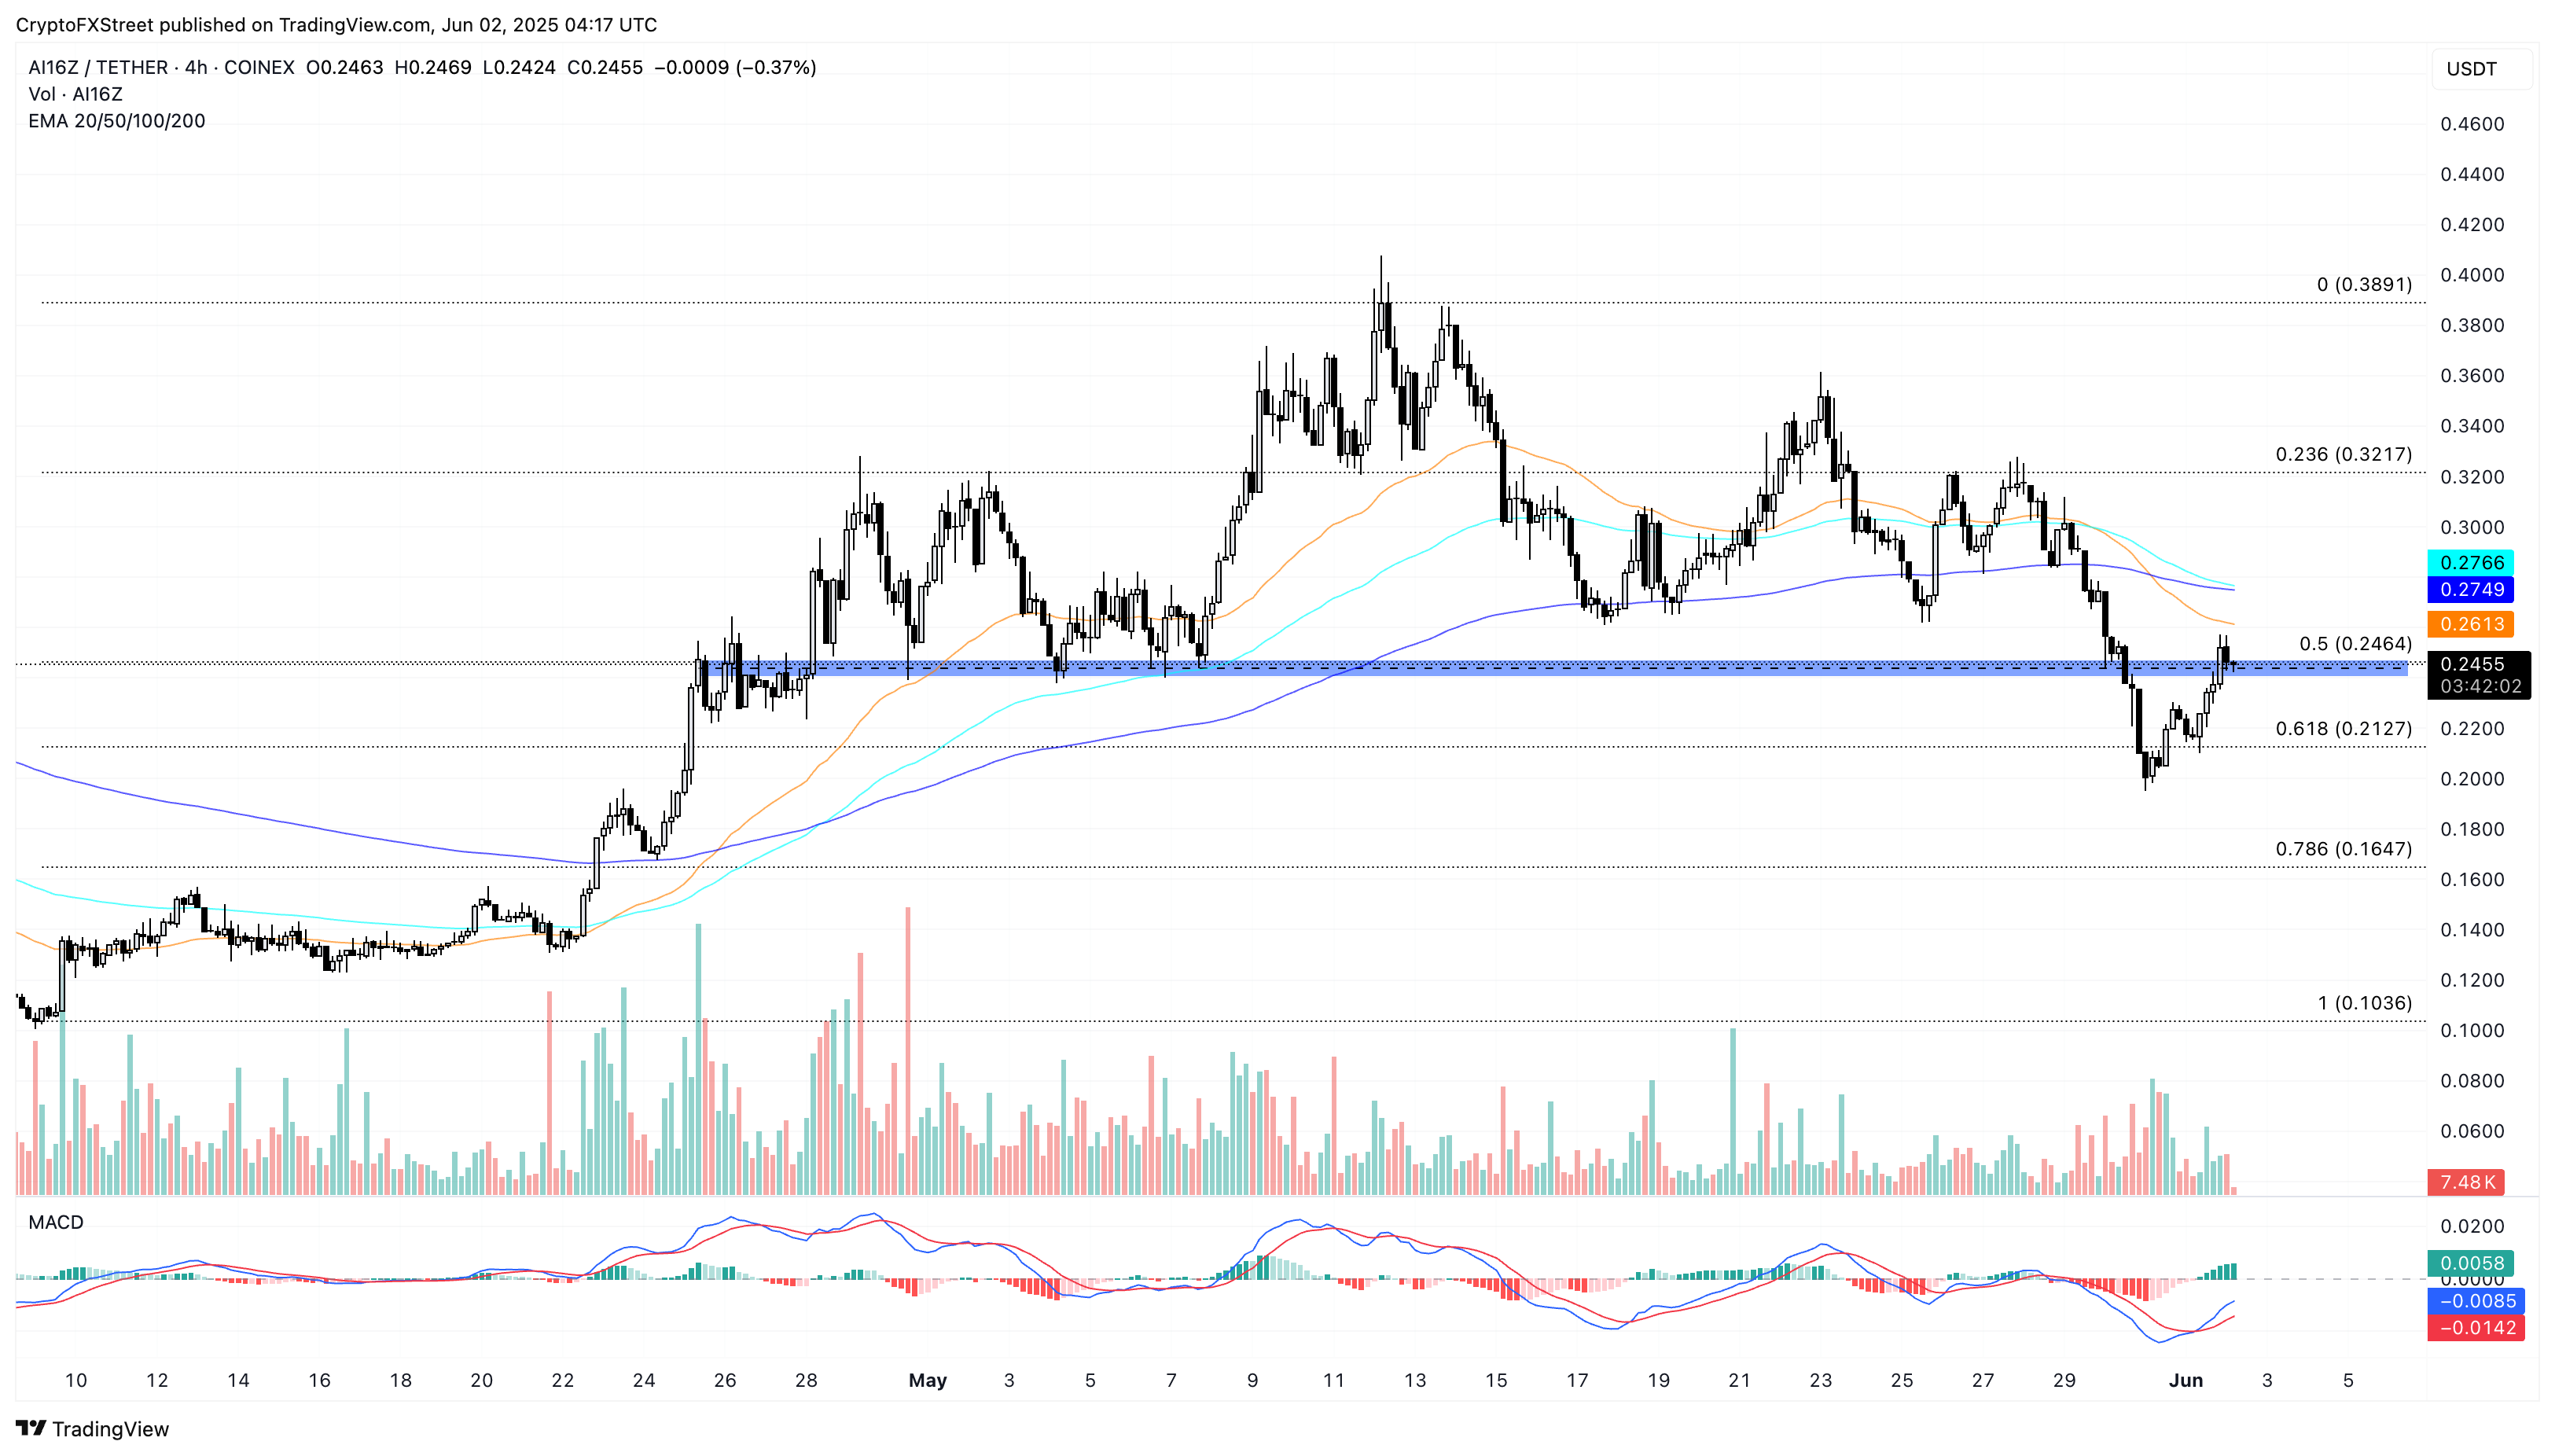
AI16Z/USDT 4-hour price chart. Source: Tradingview
On the other hand, crucial support for ai16z is present at $0.2127, aligning with the 61.8% Fibonacci level.
FET’s recovery aims to exceed a crucial dynamic resistance
FET trades at $0.767, experiencing a 4% surge in the last 24 hours at press time. The price action reveals a bounce back from the $0.717 support level, capitalizing on the broader market’s weekend recovery.
Despite the surge, the token consolidates under the 200-period EMA at $0.776, acting as a short-term hurdle. The price fell last week from $0.9130 to $0.717, resulting in a bearish crossover in the 50- and 100-period EMAs, a sign of declining bullish momentum in the short term.
However, the recent bounce-back results in a positive crossover between the MACD and signal lines. This suggests that the bulls are gradually regaining momentum to prolong the prevailing uptrend.
The immediate resistance lies at $0.797, a key level of resistance with multiple peaks formed since April 27. A potential breakout above $0.797 could propel FET to the $0.907 resistance level.
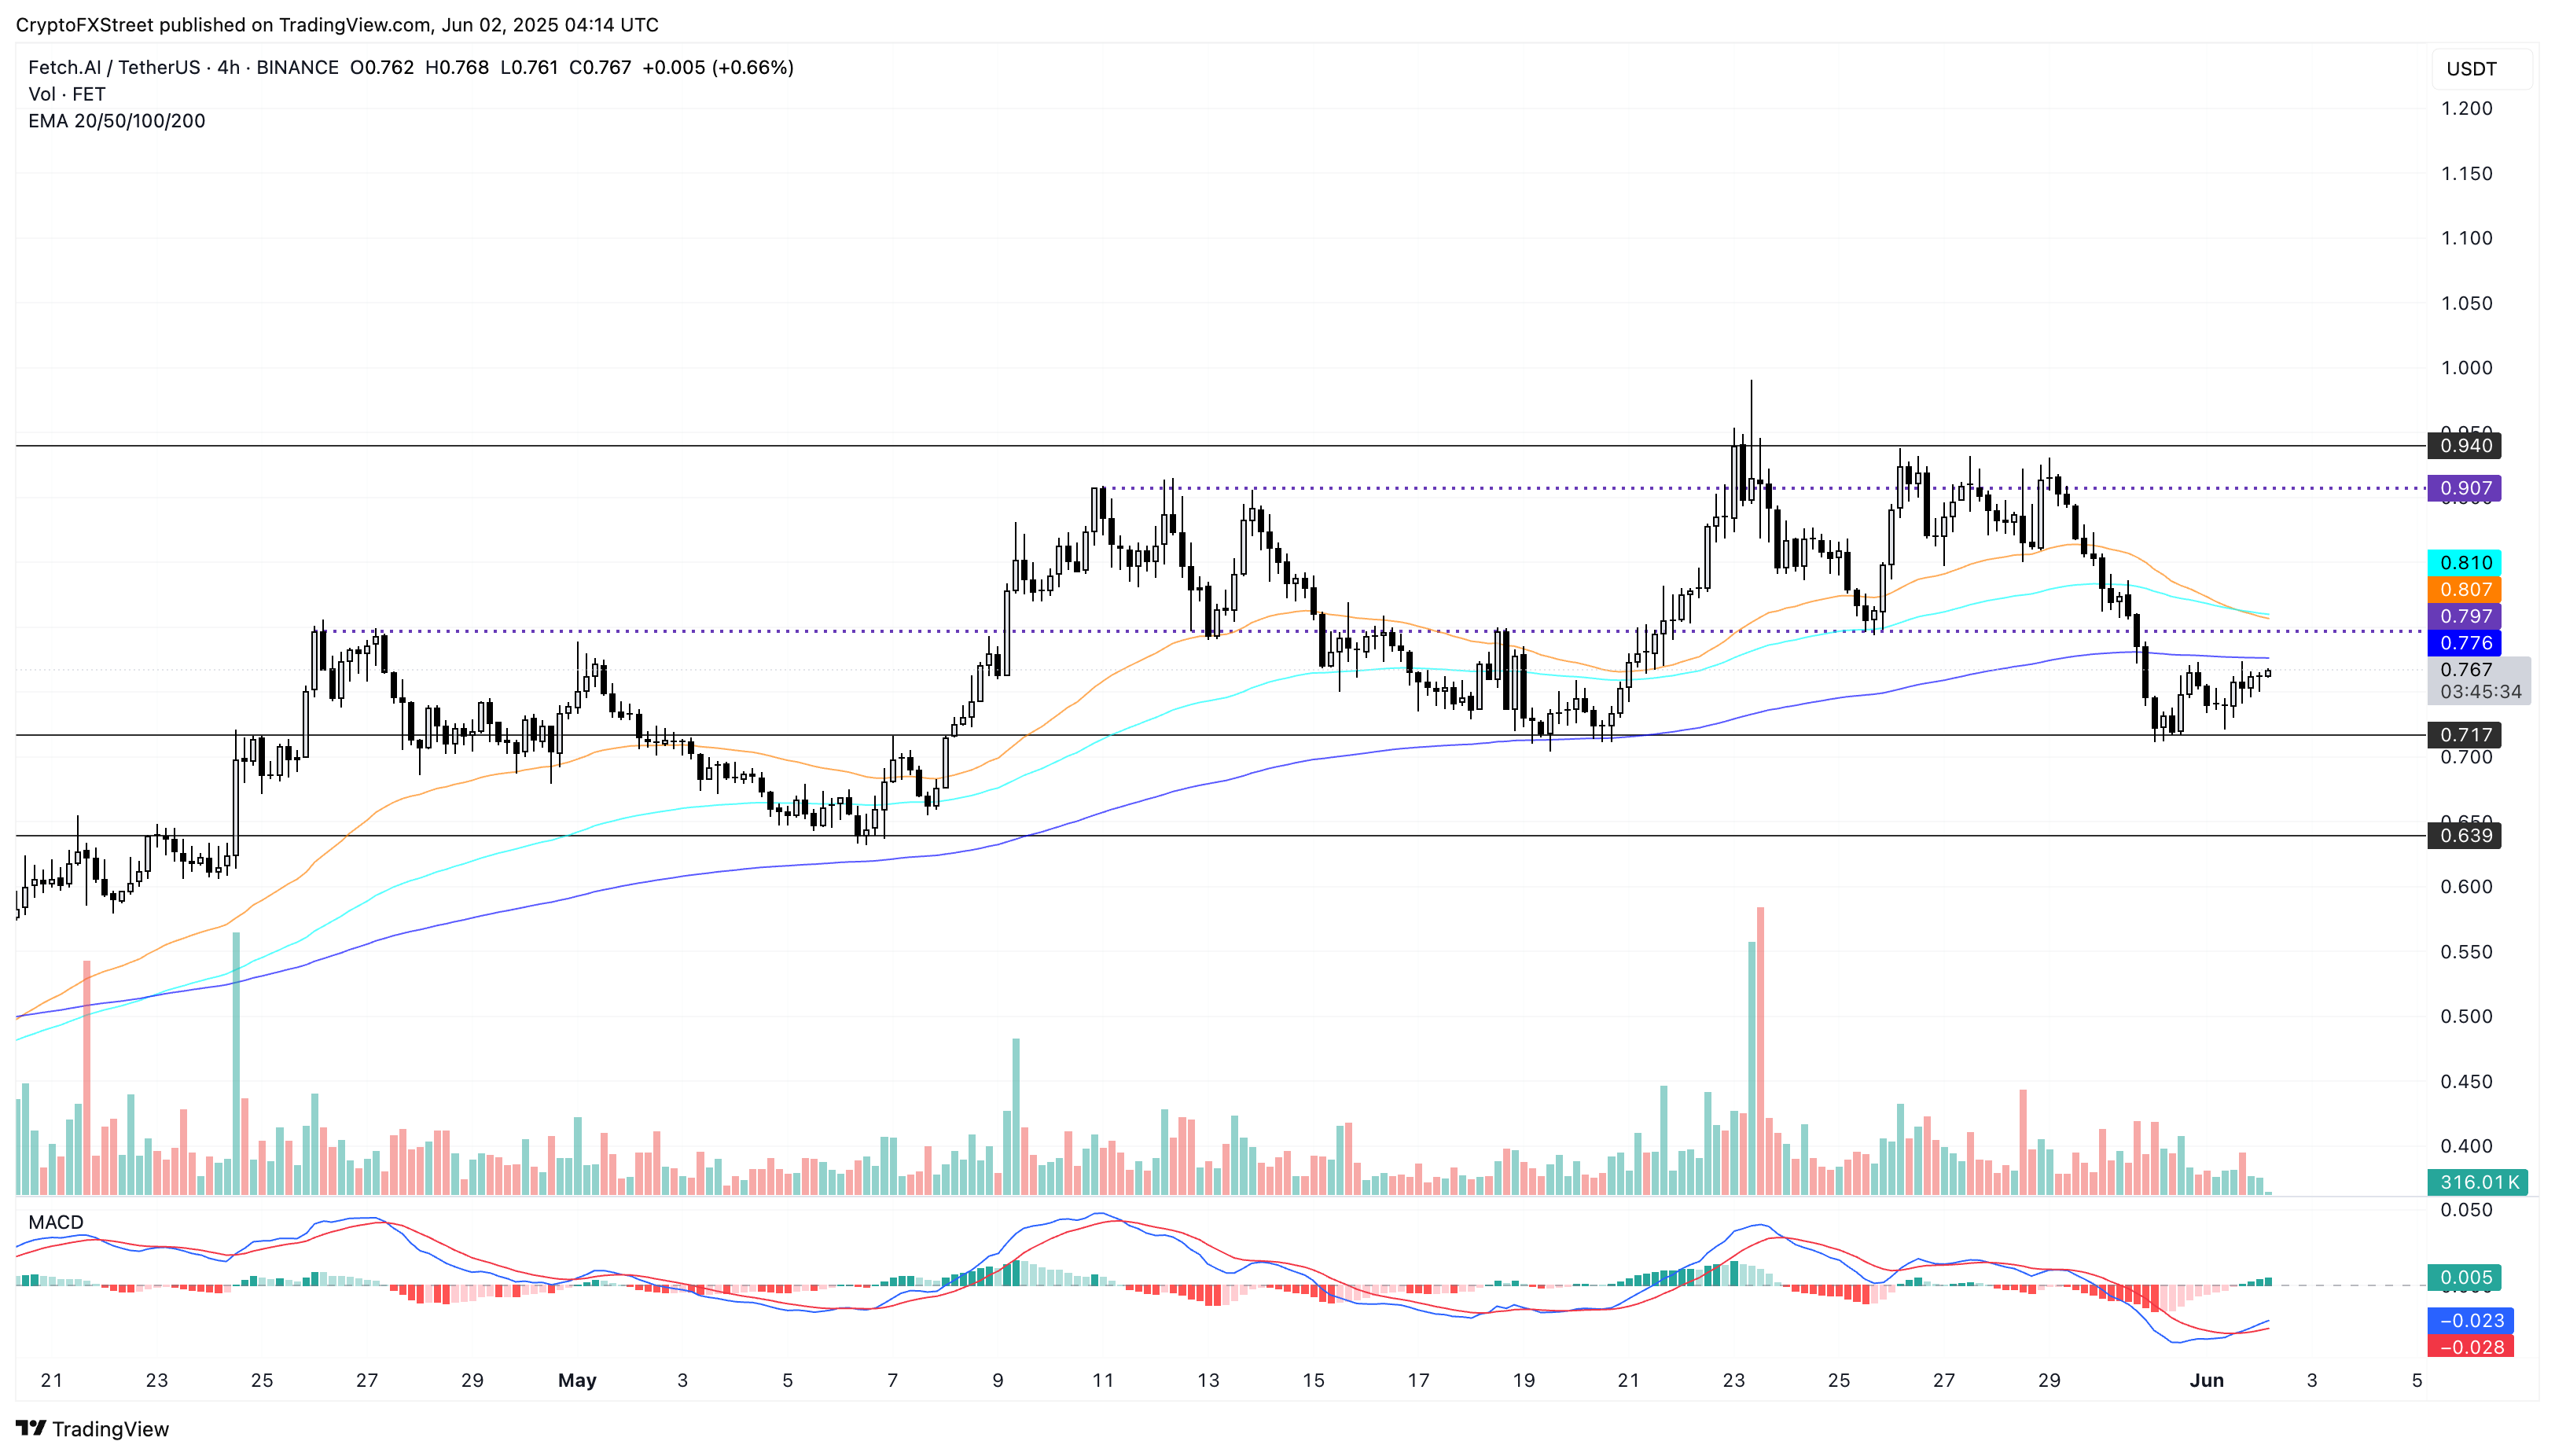
FET/USDT 4-hour price chart. Source: Tradingview
On the flip side, the $0.717 level remains a key support floor for the AI agent token, followed by the $0.639 level.
Virtuals Protocol’s bullish struggle within a channel
Virtuals Protocol trades within a rising channel pattern in the 4-hour timeframe, signaling a long-standing uptrend at play. The peaks on May 8 and May 27 connect to form the overhead trendline, while the lows on April 26, April, May 7, and May 31 complete the parallel support trendline.
The altcoin consolidates close to the lower boundary line while facing opposition from the 50-period EMA at $2.09. As the altcoin prepares to take off from the ascending trendline, the MACD crosses above the signal line in the negative territory, reflecting a revival in bullish momentum.
If the AI agent token exceeds the 50 EMA, it could face opposition at the $2.37 peak formed on May 29.
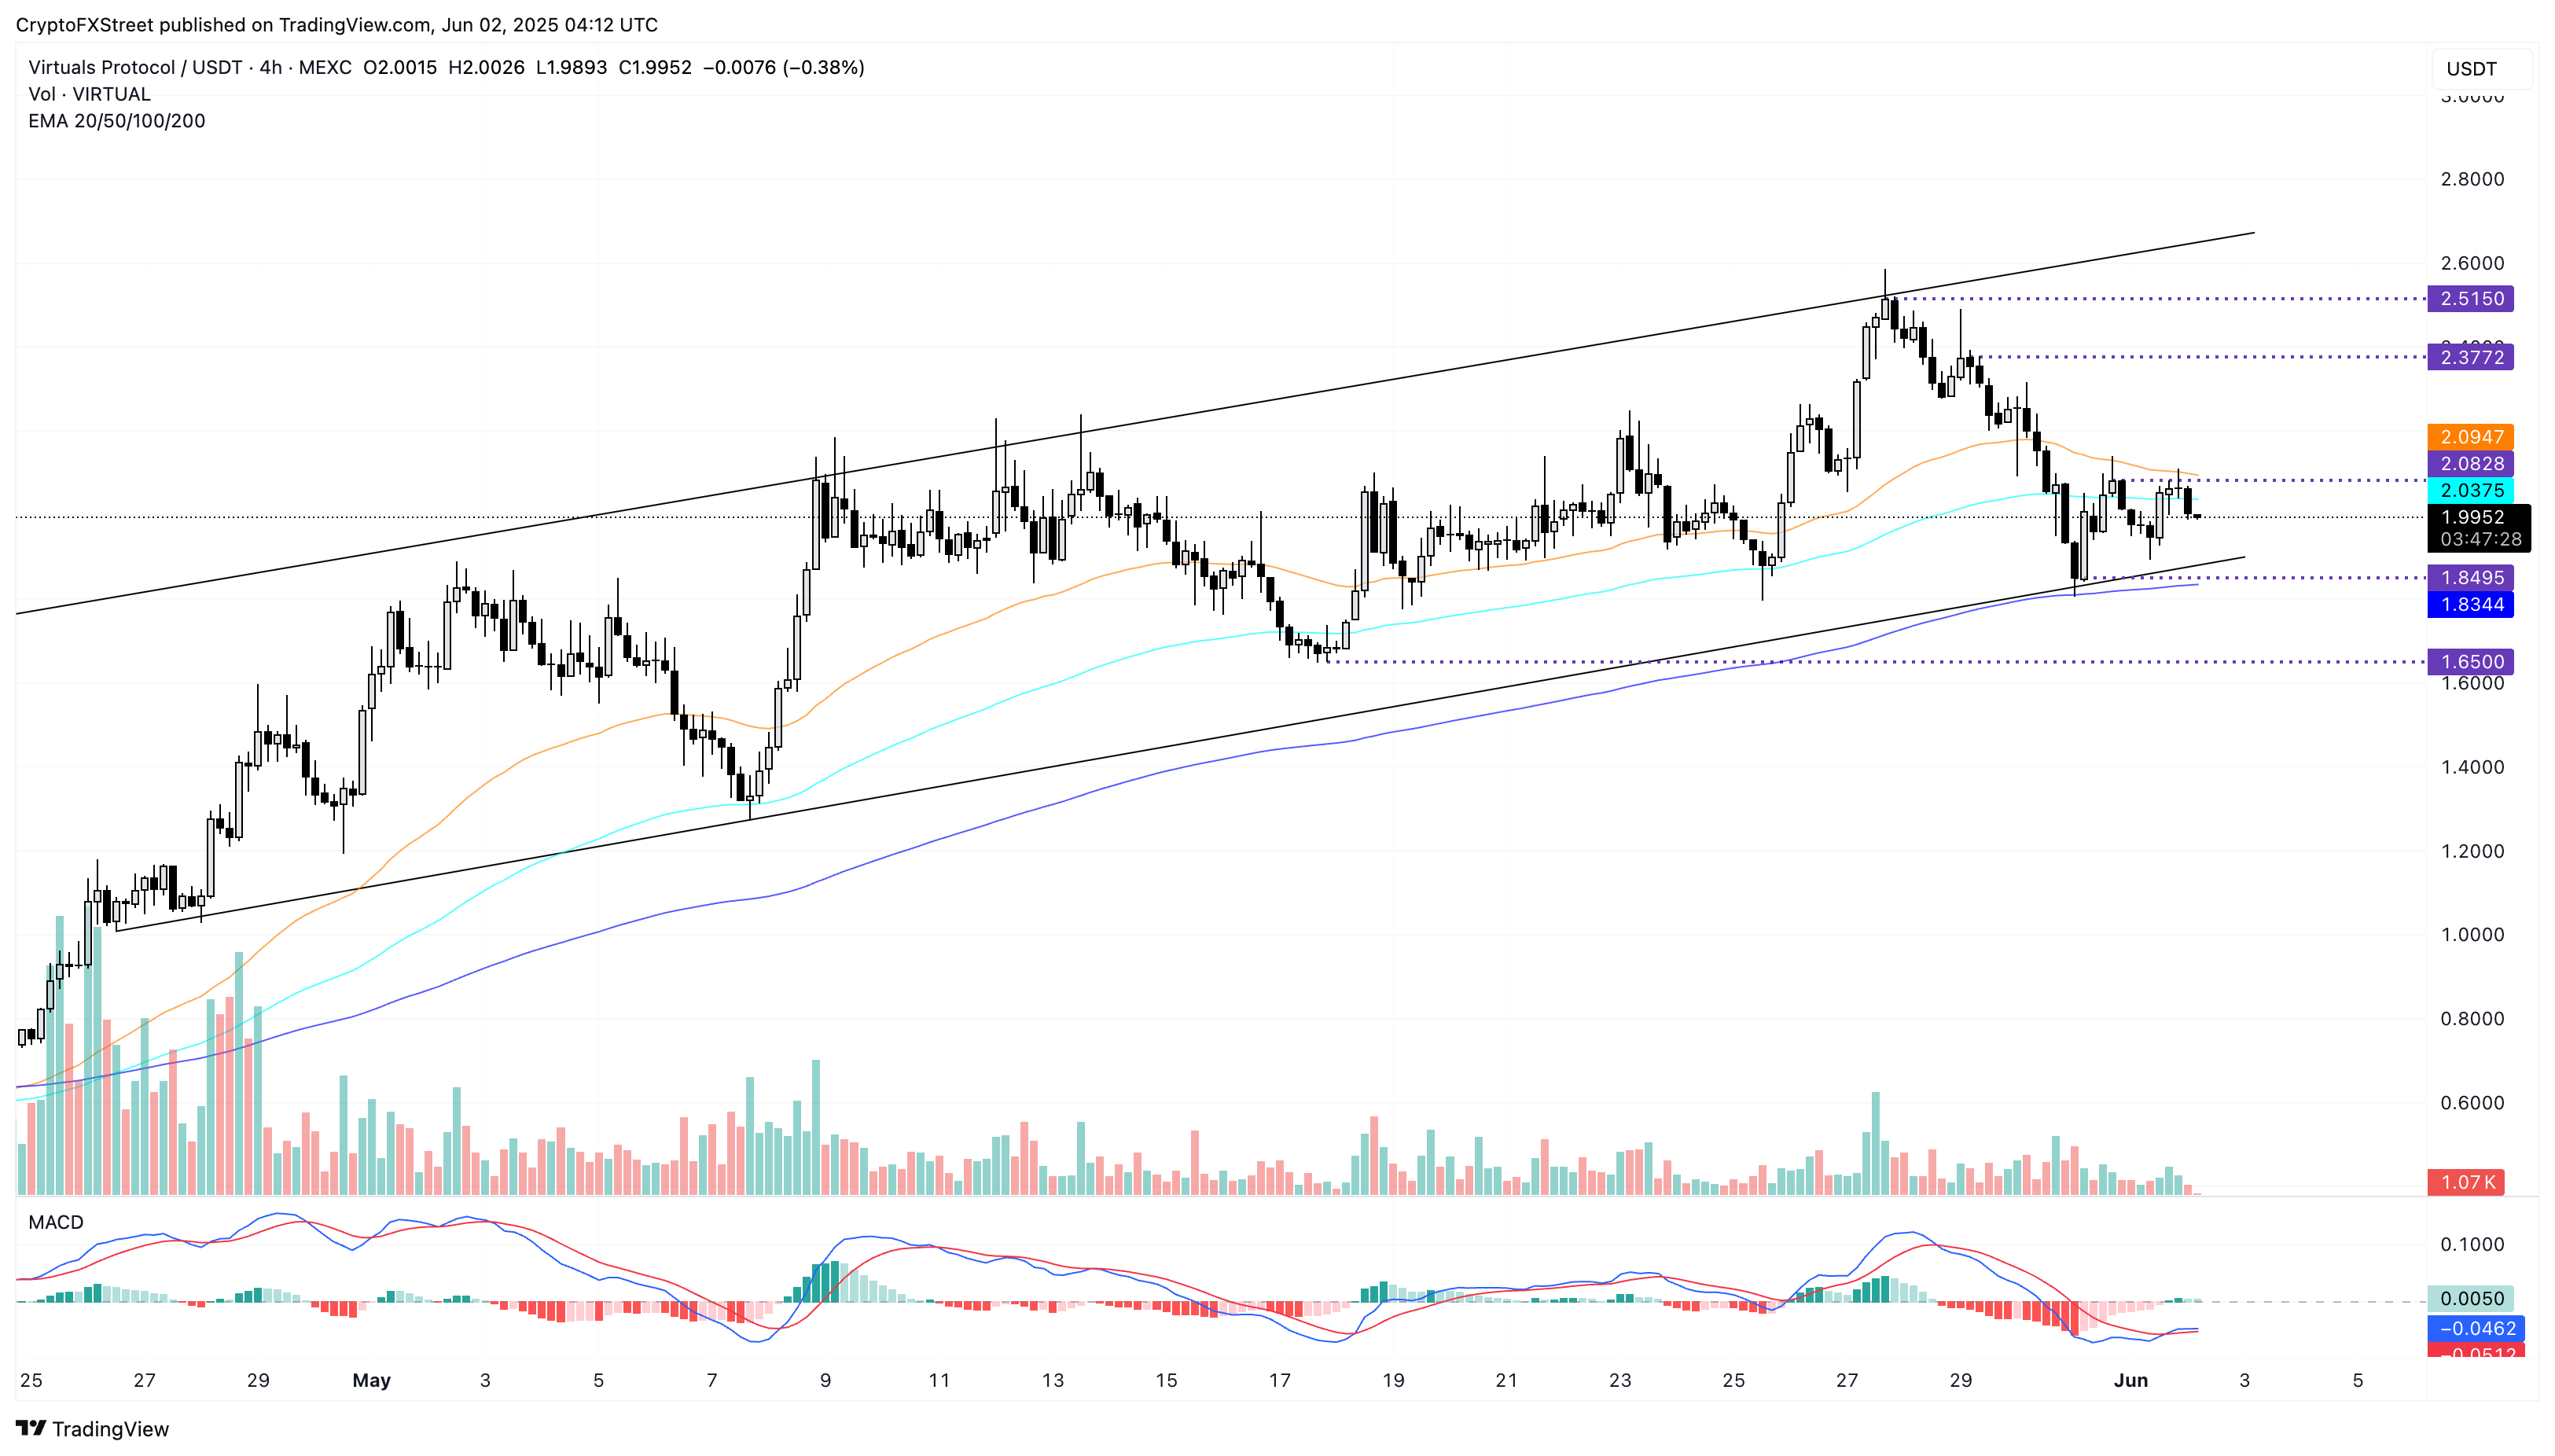
VIRTUAL/USDT 4-hour price chart. Source: Tradingview
On the flip side, the crucial support remains the 200-period EMA at $1.83, closely tracing the ascending trendline. A potential closing under $1.83 could extend the decline to $1.65, the swing low created on May 17.
추천 기사


