


Ripple and Stellar outlook: Weakening market signals put XRP and XLM at risk
- XRP extends its correction, trading below $0.965 on Thursday after facing rejection at the key $1 psychological mark.
- XLM trades below $0.136, heading toward last week’s low around $0.130 as selling pressure intensifies.
- Deteriorating derivatives metrics and cautious on-chain data suggest continued downside risk for both altcoins.
Ripple (XRP) and Stellar (XLM) extend their losses on Thursday, with both altcoins struggling to find support amid persistent selling pressure. In addition, weakening derivatives metrics and cautious on-chain signals suggest further downside risk for both altcoins.
XRP and XLM derivatives data show bearish bias
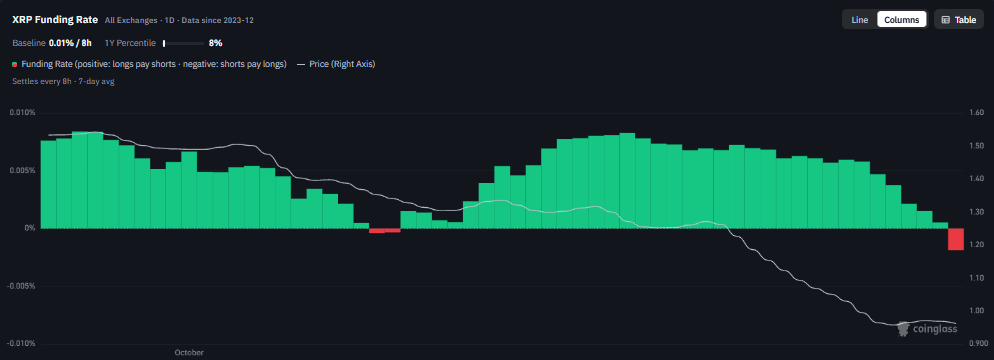
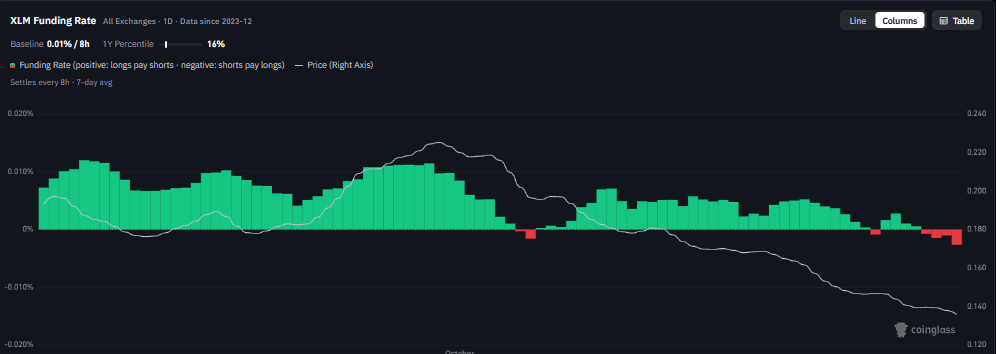
Ripple and Stellar derivatives data show a bearish bias. CoinGlass’ funding rates for both altcoins read -0.0068% for XRP and -0.0057% for XLM on Thursday. These negative rates indicate shorts are paying longs and suggest a bearish outlook.
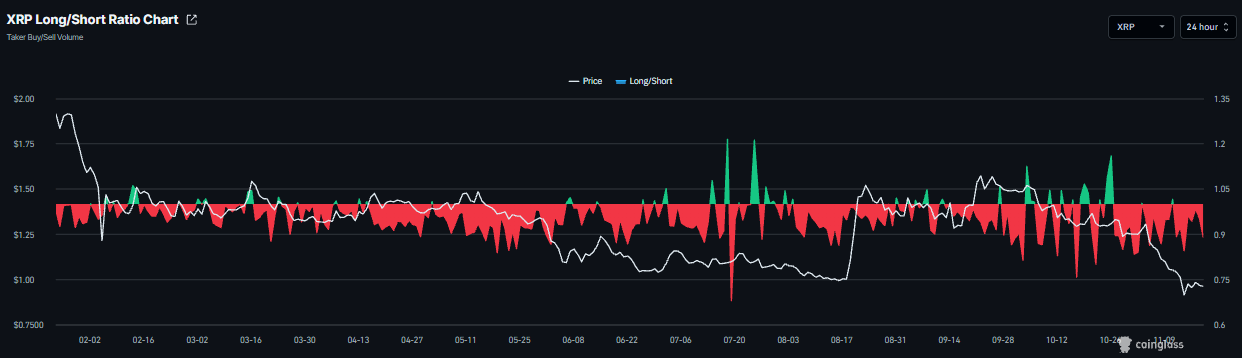
In addition, CoinGlass’ long-to-short ratio for XRP reads 0.88 on Thursday, nearing the lowest level over a month. A ratio below one indicates bearish sentiment, as traders bet that asset prices will fall.
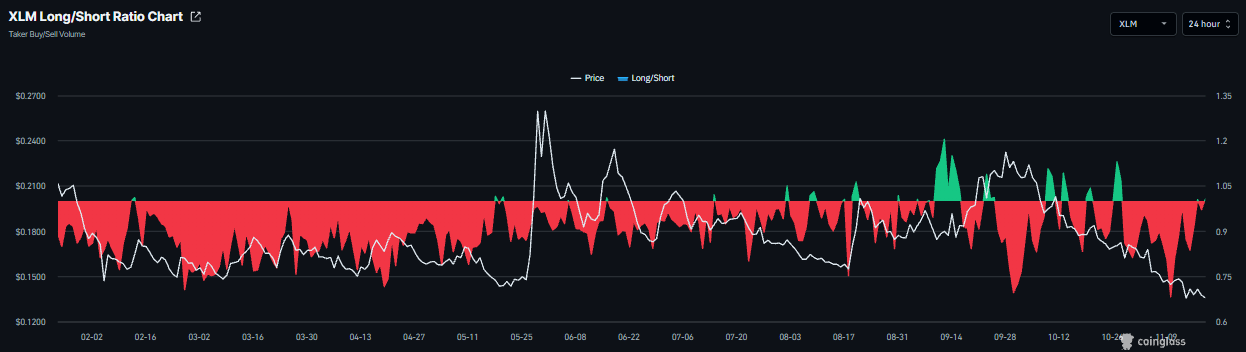
Meanwhile, XLM’s long-to-short ratio reads 1.01 on the same day, mildly in green territory and indicating a slight bullish bias among traders, although positioning remains broadly balanced.
On-chain data shows cautious signs
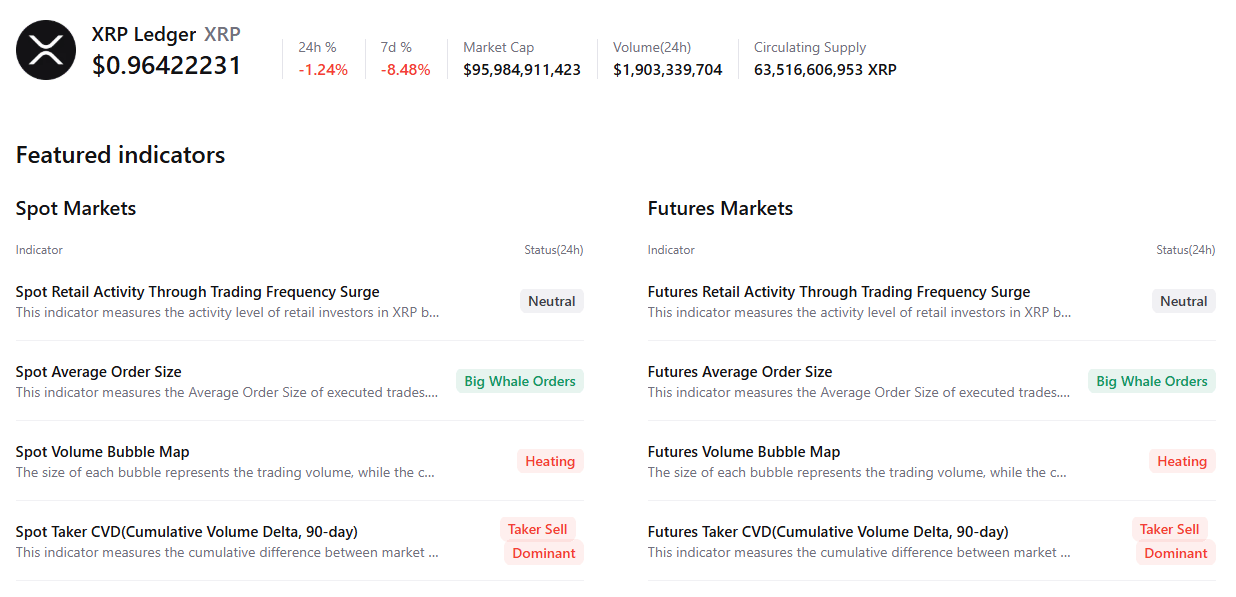
CryptoQuant’s summary data shows a bearish outlook for both altcoins. XRP’s spot and futures markets show large whale orders but with heating conditions. Both markets also show sell-side dominance, highlighting an overall bearish, cautious sentiment bias among Ripple traders.
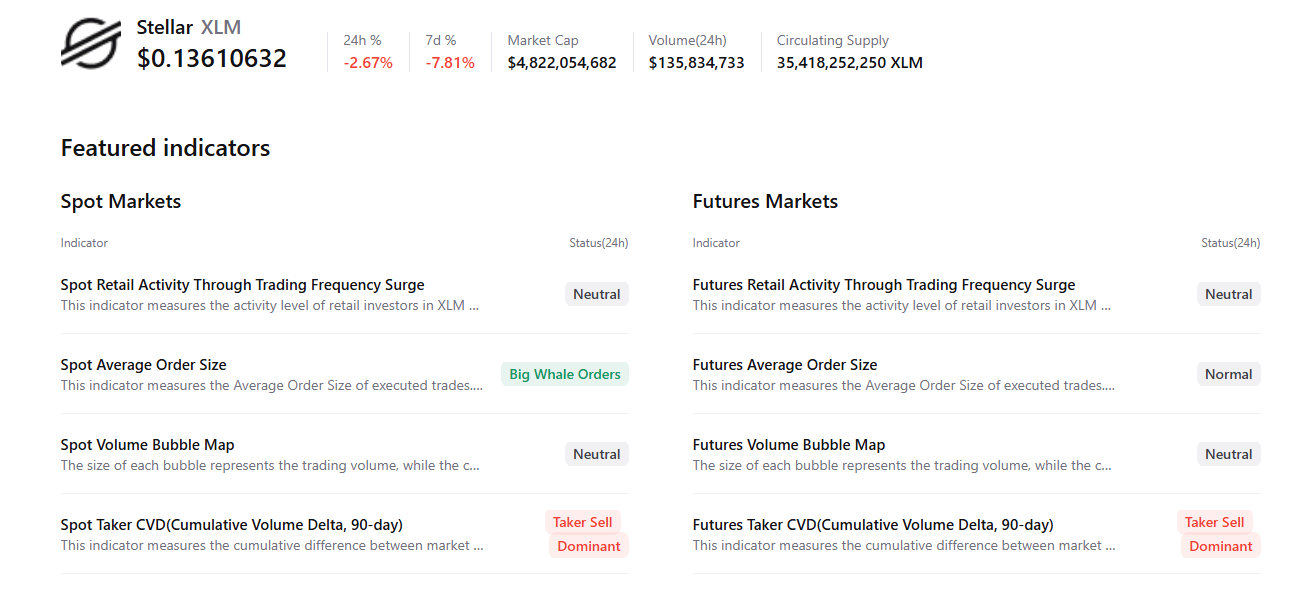
For XLM, spot and futures markets show sell-side dominance. Meanwhile, the spot market shows large whale sell orders, while other metrics remain neutral, highlighting a cautious-to-bearish outlook among XLM traders.
XRP technical outlook: Bears remain in control
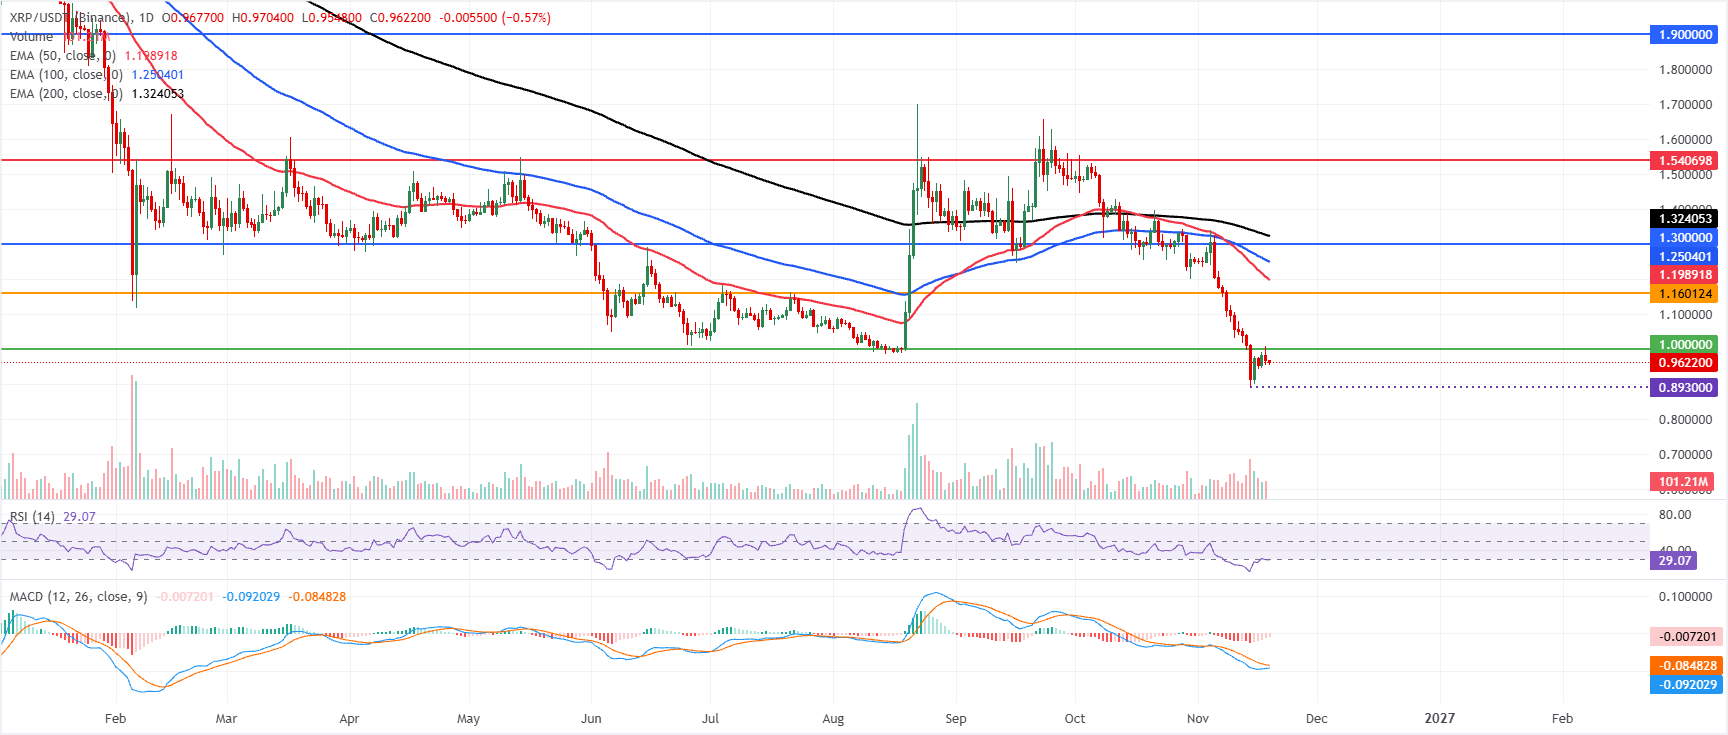
XRP price trades at $0.962 on Thursday, extending its decline well below the major Exponential Moving Averages (EMAs), which keeps the near-term bias firmly bearish. XRP holds under the 50-day EMA at $1.198, the 100-day EMA at $1.250 and the 200-day EMA at $1.324, suggesting rallies remain capped by a dense band of overhead supply.
The Relative Strength Index (RSI) at 29 hovers near oversold territory, while the Moving Average Convergence Divergence (MACD) indicator shows a negative reading but with shrinking downside momentum, hinting that any recovery attempts would likely be corrective within a broader downtrend.
On the topside, initial resistance emerges at the psychological $1.000 level, ahead of the horizontal barrier at $1.160 and the 50-day EMA clustered near $1.198. Higher up, the 100-day EMA at $1.250 and the $1.300 hurdle reinforce the bearish structure, followed by the longer-term 200-day EMA at $1.324 and higher resistance at $1.540 and $1.900. With no clear nearby support levels evident in the current setup, XRP would need to reclaim successive resistances to ease downside pressure and signal a more constructive shift in the daily trend.
XLM technical outlook: Heading toward new lows
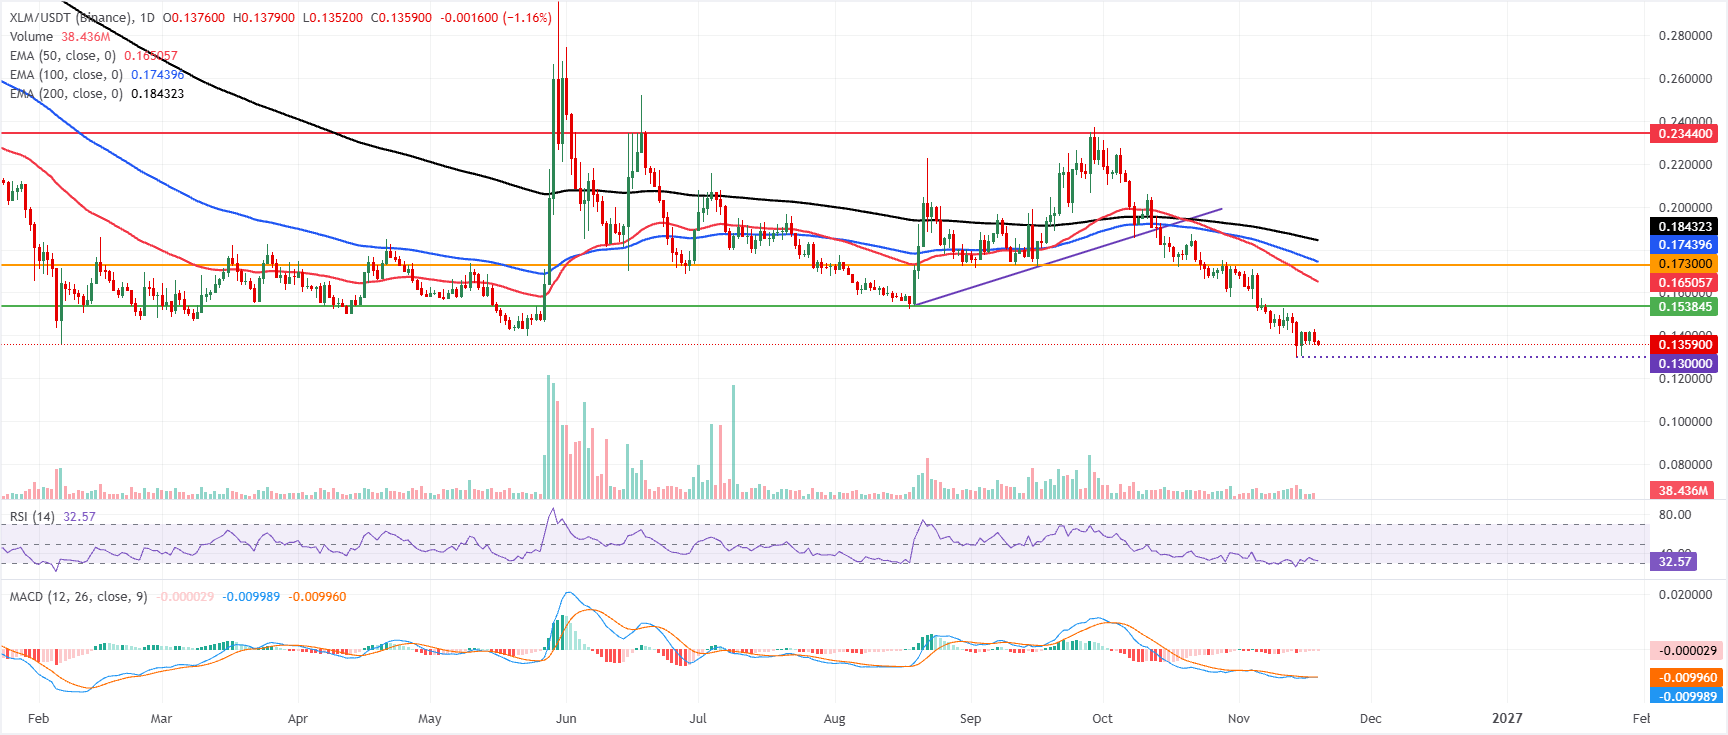
XLM price trades at $0.135 on Thursday, extending its slide well below the 50-day, 100-day and 200-day EMAs at $0.165, $0.174 and $0.184, which collectively cap the upside and reinforce a bearish near-term bias. The RSI at 32 hovers just above oversold territory, while the MACD indicator stays marginally negative around the zero line, suggesting weak downside momentum rather than a decisive reversal.
On the topside, initial resistance appears at $0.153, the former horizontal barrier now looming just overhead, ahead of the 50-day EMA at $0.165 and another horizontal level at $0.173. Higher up, the 100-day and 200-day EMAs at $0.174 and $0.184, together with the prior trendline break area near $0.213 and the distant horizontal cap at $0.234, define a broad supply zone that XLM would need to reclaim to alleviate the current bearish structure.
(The technical analysis of this story was written with the help of an AI tool. Know more.)
추천 기사


