


Crypto Today: Bitcoin, Ethereum and XRP struggle to find footing amid spot ETF outflows
- Bitcoin rebounds and trades near $74,000, with bulls still struggling to regain trend control.
- Ethereum holds firmly onto the critical $2,000 level, while declining moving averages and the SuperTrend line continue to cap upside.
- XRP downtrend slows near $1.00, but sellers remain broadly in control as spot ETFs record further outflows.
Cryptocurrency prices are broadly consolidating near key lower support levels on Wednesday, led by Bitcoin (BTC), hovering around $74,000. Ethereum (ETH), the largest smart contract token, sits above $2,000 while its upside remains structurally capped. Ripple (XRP), meanwhile, holds delicately above $1.00, with the path of least resistance largely downward.
Capital outflows weigh on the crypto market
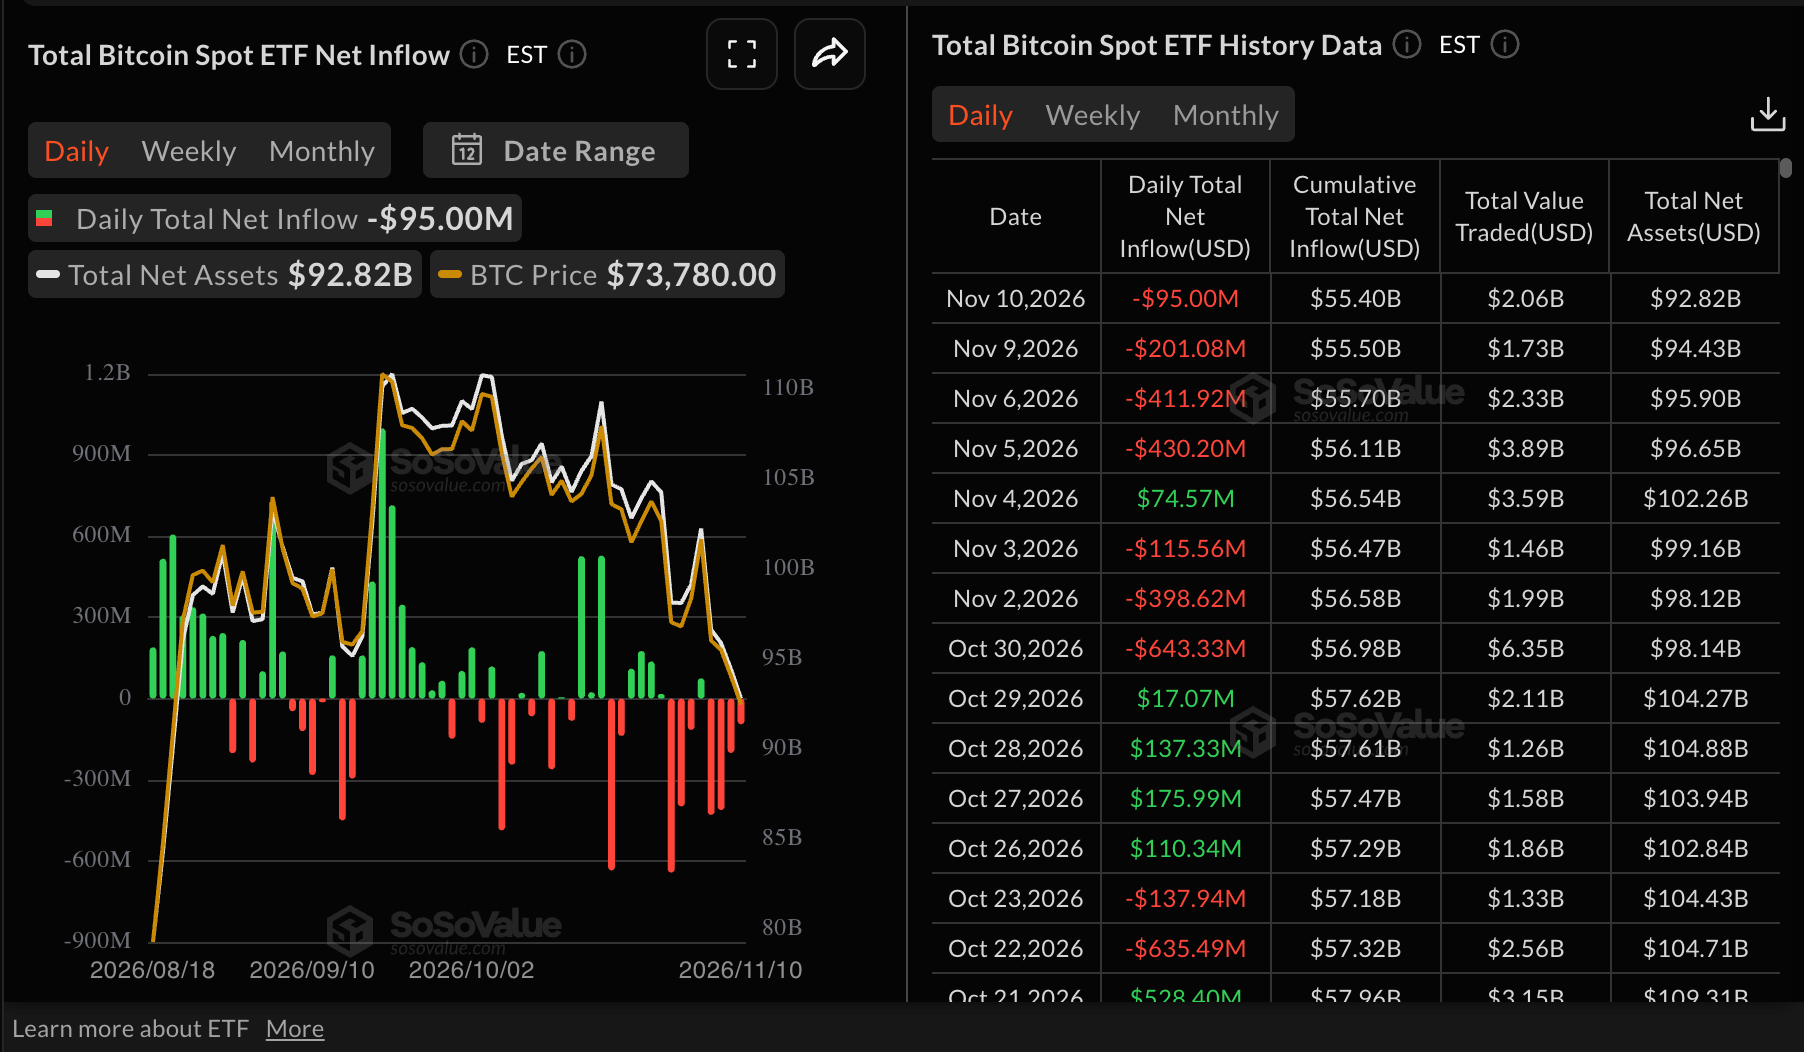
Interest in digital investment products continues to take a back seat, given Bitcoin spot Exchange-Traded Funds (ETFs) recorded $95 million in outflows on Tuesday, extending the bearish streak for the fourth consecutive day. So far this week through Tuesday, total outflows stand at $296 million.
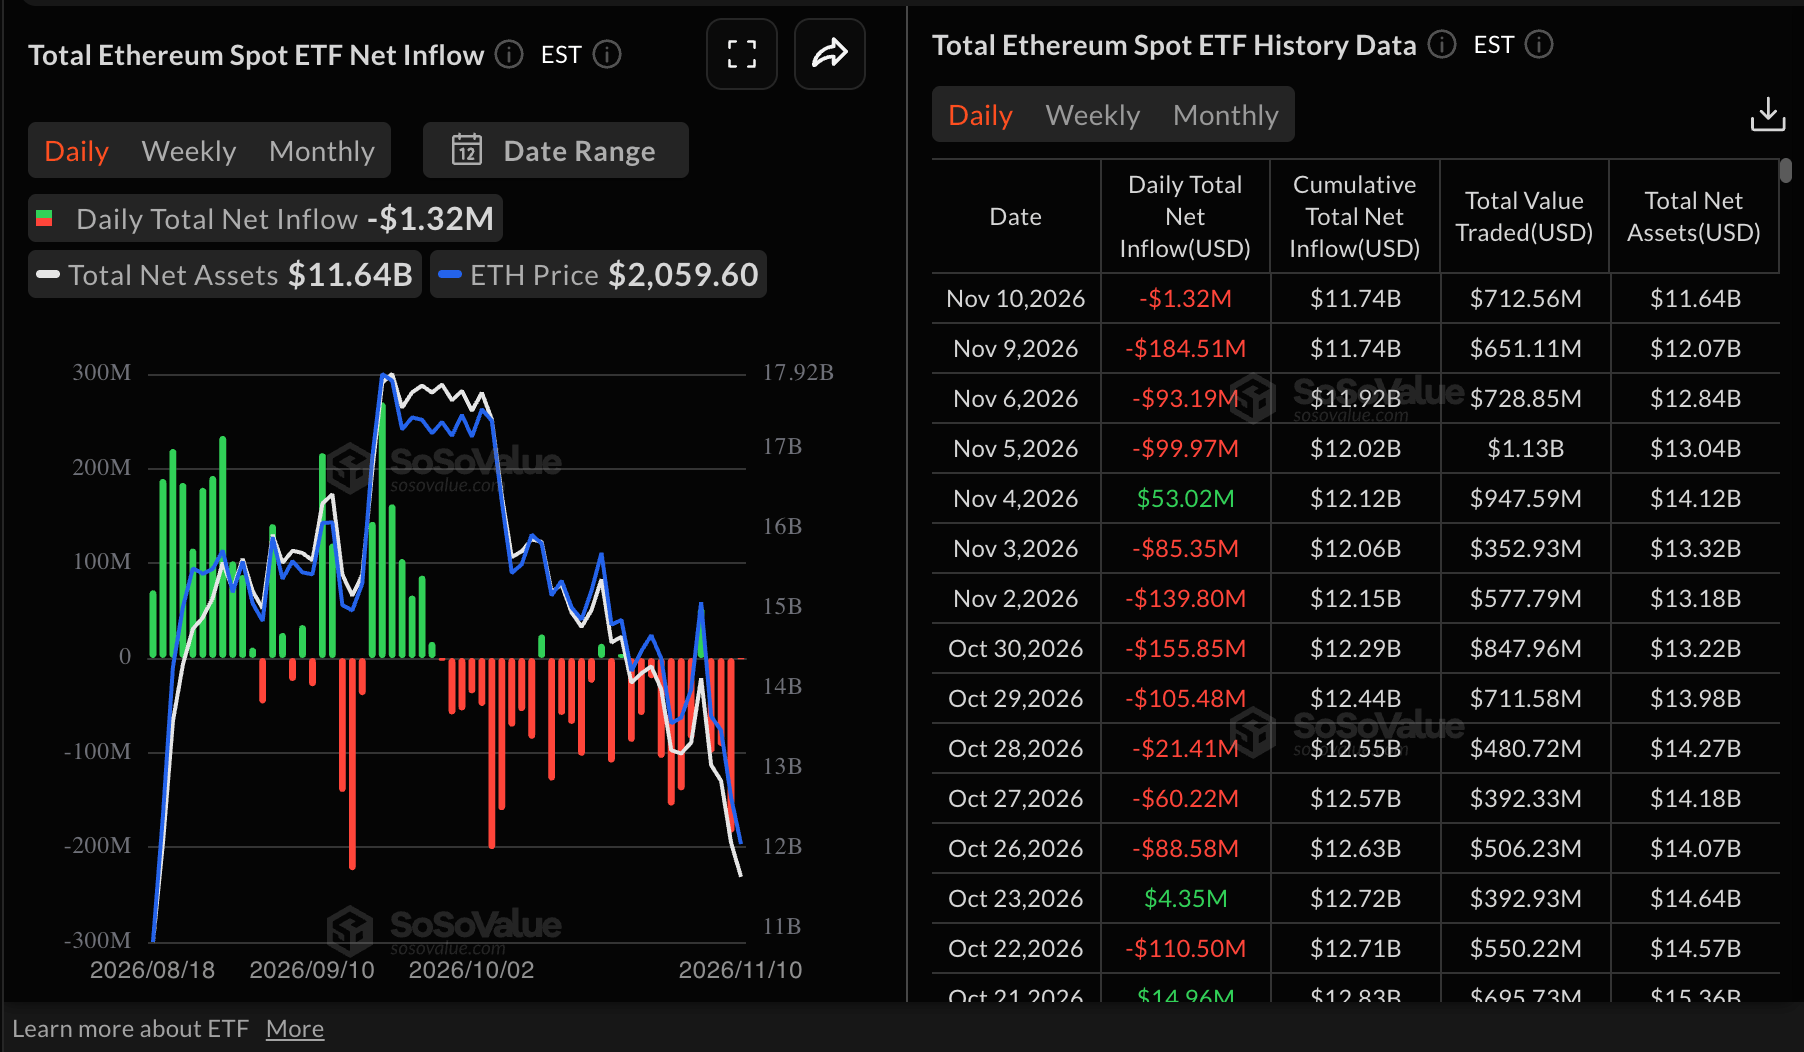
Ethereum spot ETFs saw mild outflows of $1.32 million on Tuesday, bringing cumulative inflows to $11.74 billion. Net assets under management average $11.64 billion, according to SoSoValue data, underscoring institutional investors' long-term positive outlook on the underlying token.
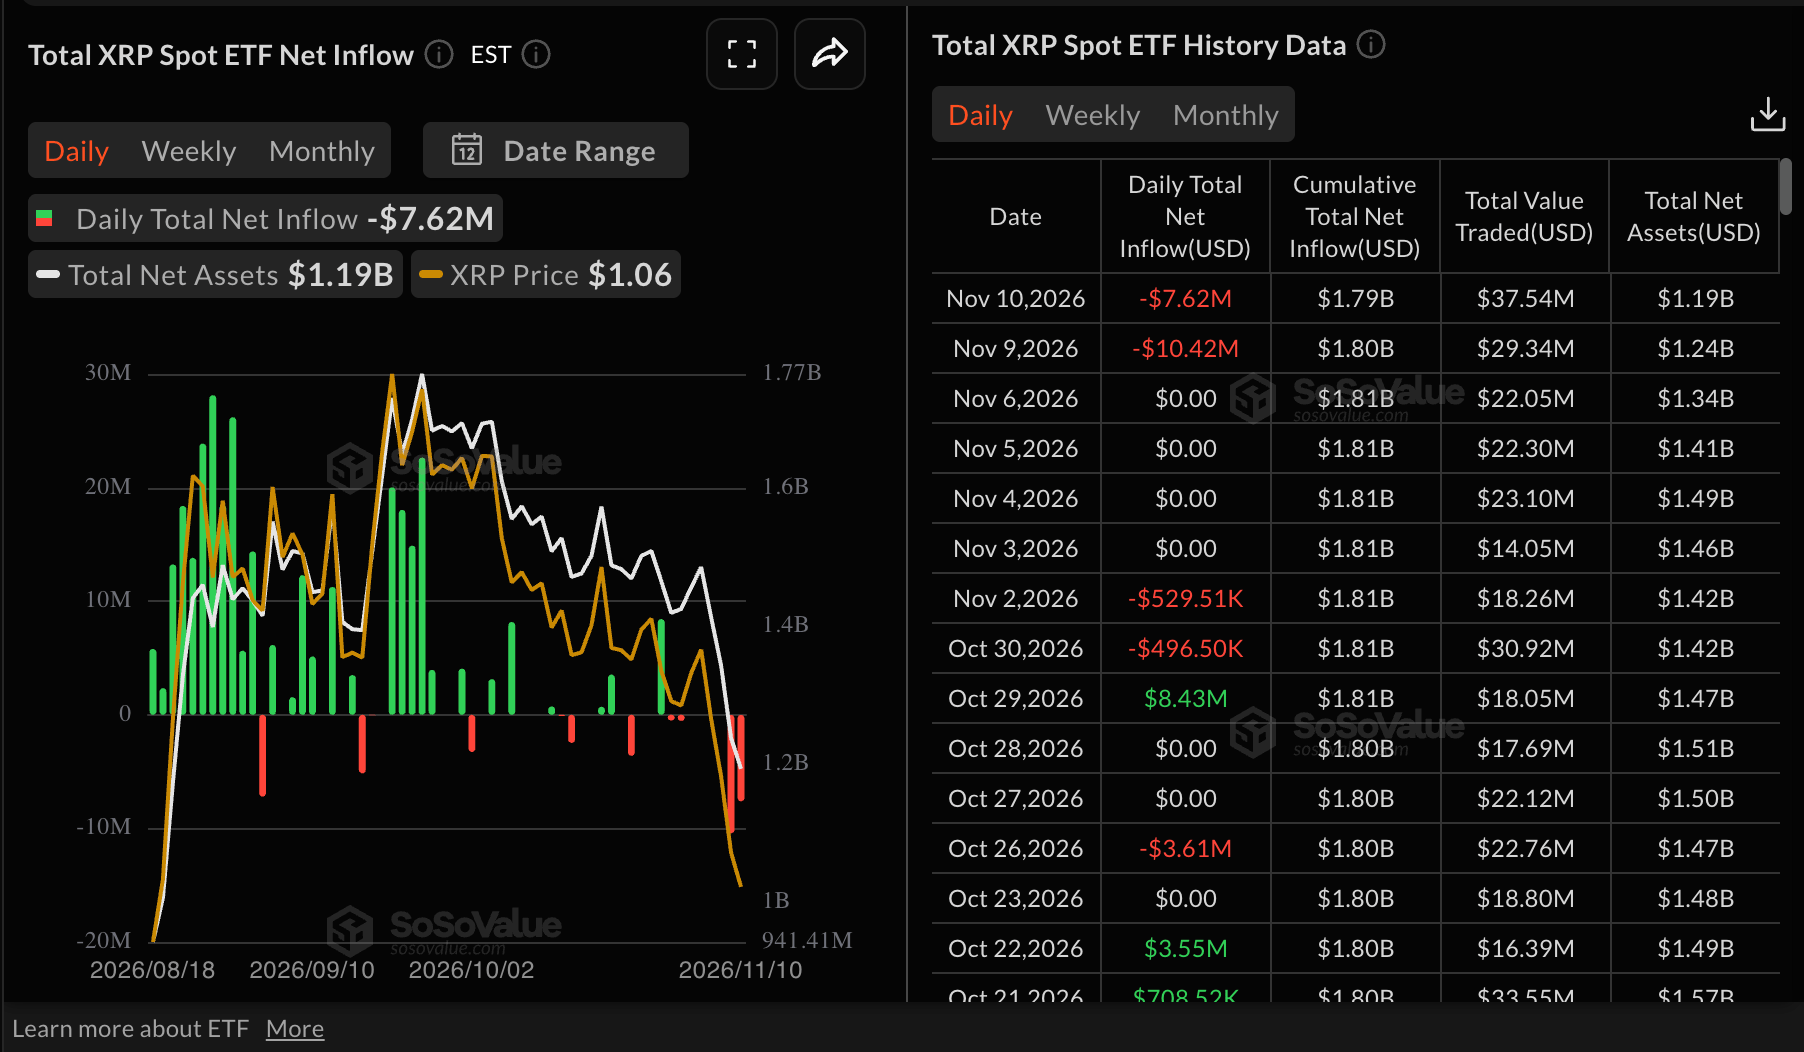
As for XRP spot ETFs, outflows totaled nearly $8 million on Tuesday. This marked the second consecutive day of outflows. Cumulative outflows stand at $1.8 billion, with net assets under management at $1.19 billion.
More broadly, the Fear & Greed Index mirrors subdued risk appetite, with market sentiment at 29 in the Fear territory on Wednesday, down from 32 the day before. Inflation pressure from the United States (US) is among other factors keeping investors on the sidelines. Furthermore, CME Group’s FedWatch Tool shows a higher probability that the Federal Reserve (Fed) will hike interest rates in December, further weighing on market sentiment.
Technical analysis: Bitcoin holds short-term support
Bitcoin trades at $74,061, holding a clear bearish near-term bias as price sits decisively below the 50-day, 100-day and 200-day Exponential Moving Averages (EMAs). The 200-day EMA at $76,412 is the first major dynamic barrier overhead, followed by the 100-day EMA at $77,487 and the 50-day EMA near $78,906, while the SuperTrend line at roughly $80,249 reinforces a broader capping zone.
Momentum readings remain fragile, with the Relative Strength Index (RSI) hovering just above oversold territory near 35 and the Moving Average Convergence Divergence (MACD) below zero, suggesting downside pressure persists even as the immediate selling impulse slows.
On the topside, any recovery would first need to reclaim the 200-day EMA at $76,412 to ease immediate pressure, with subsequent resistance emerging at the 100-day EMA around $77,487 and the 50-day EMA near $78,906 before the bearish structure defined by the SuperTrend at $80,249 is challenged. With no clear indicator-based support levels on the daily chart, downside remains exposed to further probing lower until buyers can force a daily close back above at least the 200-day EMA, the minimum step toward neutralizing the current bearish configuration.
Ethereum technical analysis: ETH tests $2,000 support level
Ethereum trades at $2,065, extending its slide well below the main moving averages, which keeps the near-term bias firmly bearish. Price holds under the 200-day EMA at $2,301 and the 100-day EMA at $2,327, while the SuperTrend line at $2,337 and the 50-day EMA at $2,347 add to the overhead supply.
Momentum is weak, with the RSI hovering just above the oversold band near 31 and the MACD line deep in negative territory, suggesting persistent downside pressure despite signs of fatigue.
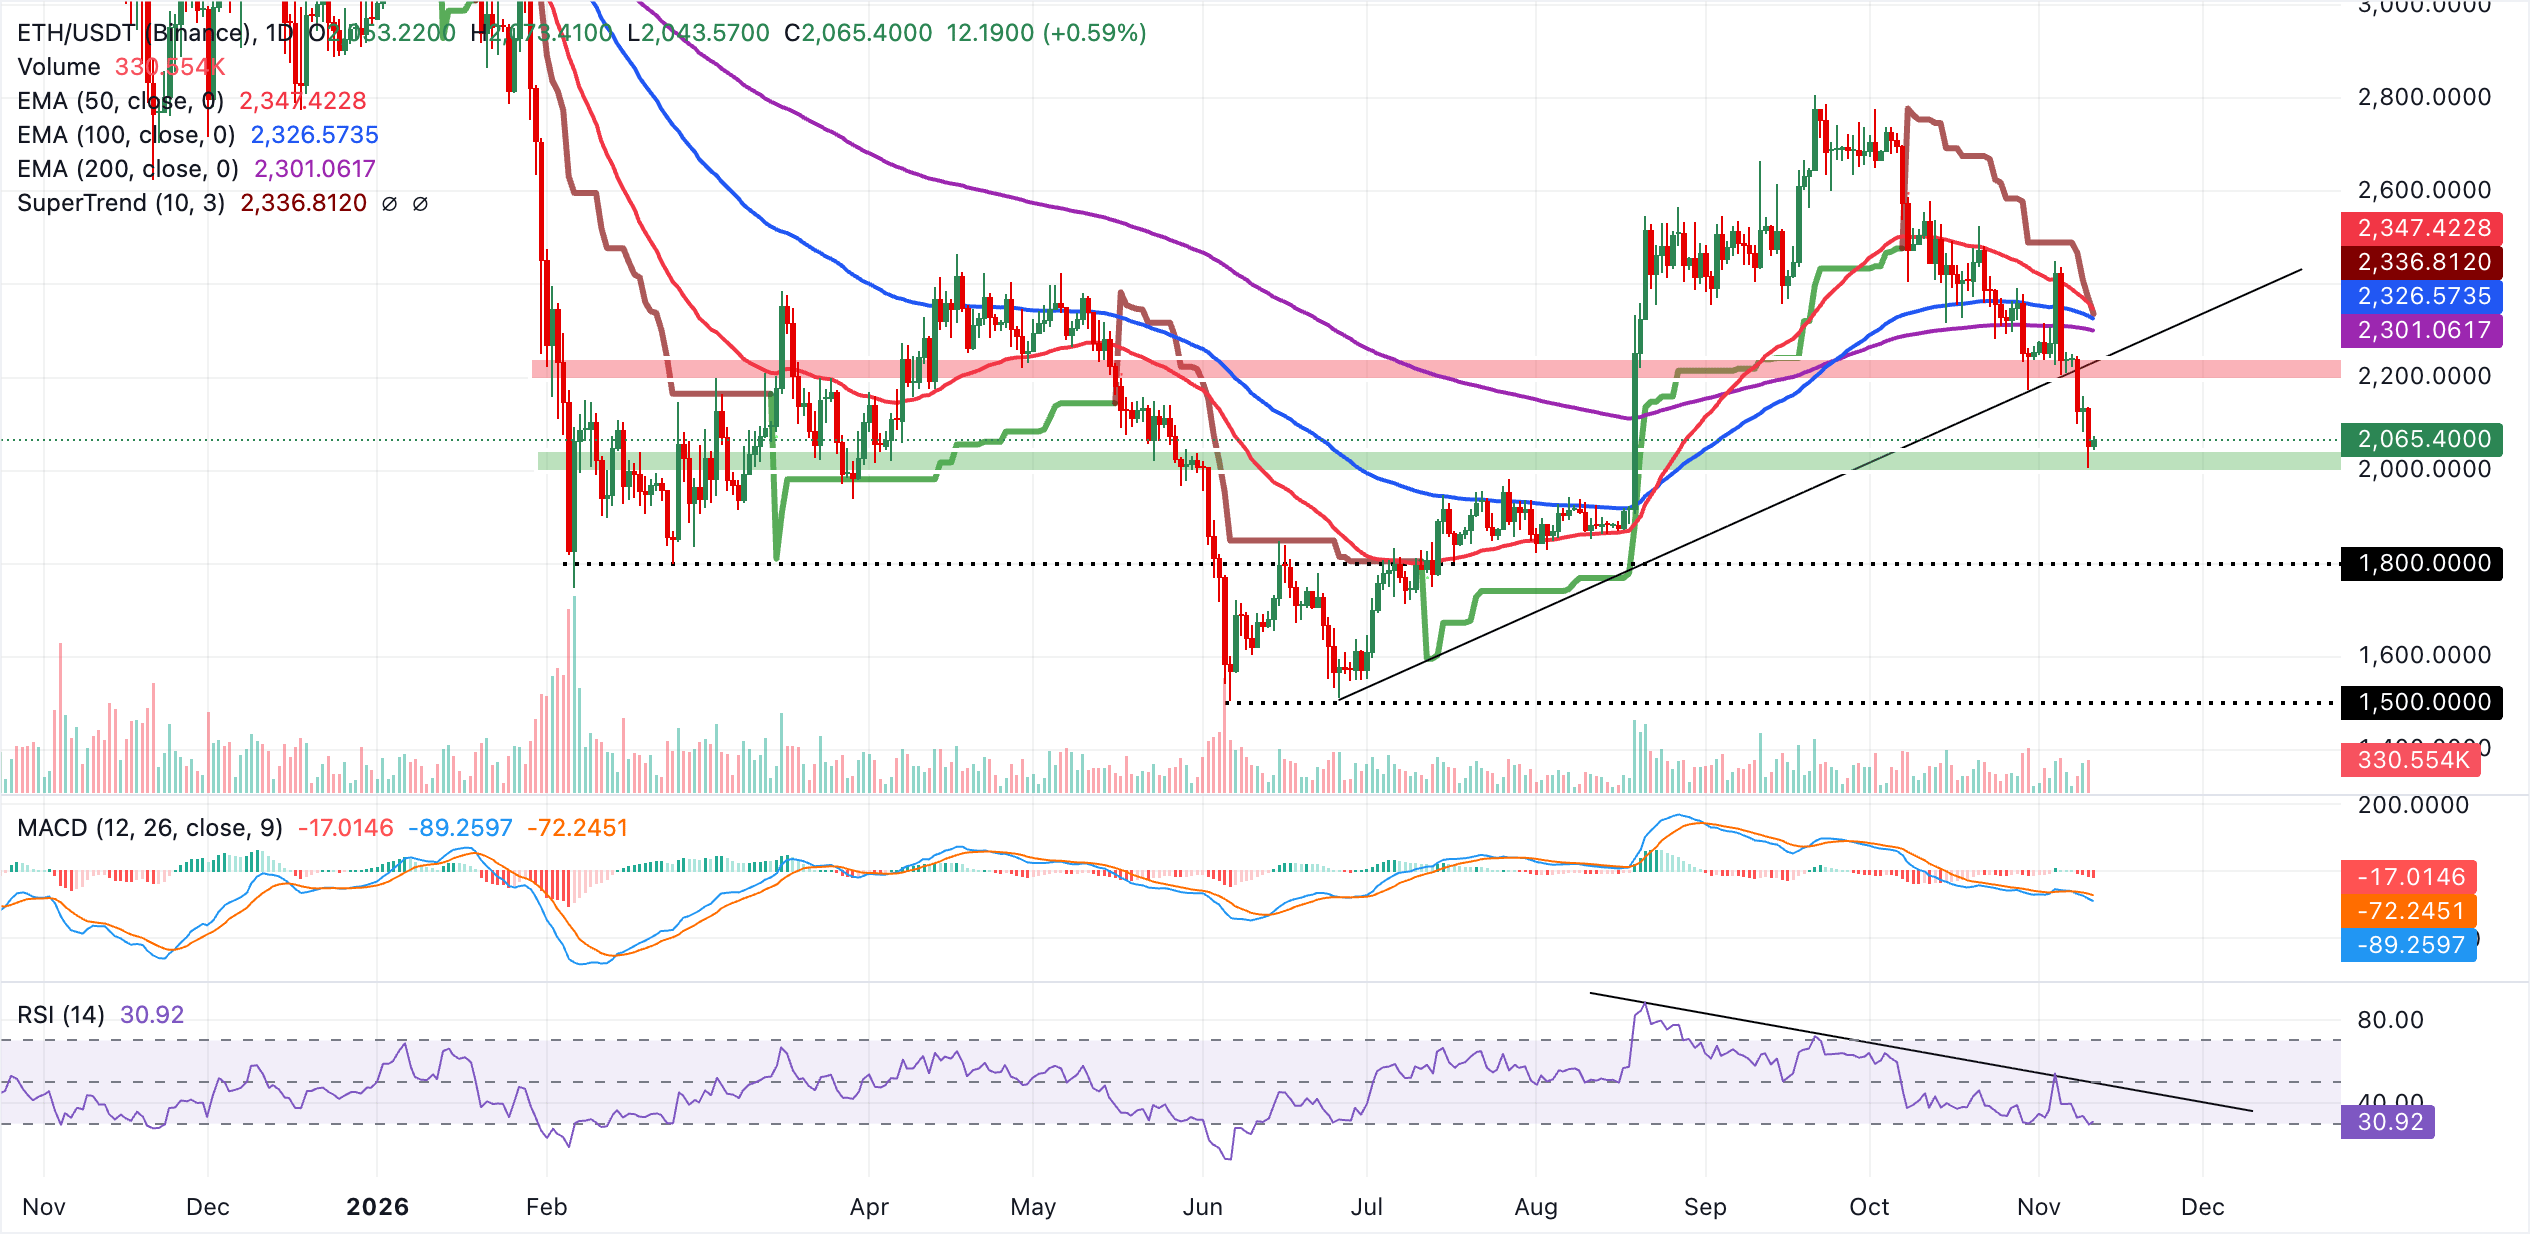
Initial resistance emerges at the broken rising trendline area around $2,234, where any rebound would first be tested. A sustained recovery above that level would then face a dense cluster of resistance formed by the 200-day EMA at $2,301 and the 100-day EMA at $2,327, followed by the SuperTrend barrier at $2,337 and the 50-day EMA near $2,347.
As long as ETH remains trapped beneath this layered ceiling, rallies are likely to be sold into, and the risk of a retest of lower psychological levels persists, even though no clear structural support is defined in the current dataset.
Technical analysis: XRP wobble as sellers tighten grip
XRP trades at $1.06, extending a bearish phase as price remains well below the 50-day, 100-day and 200-day EMAs clustered between roughly $1.28 and $1.35. The SuperTrend at $1.22 also sits overhead, reinforcing a capped tone.
Momentum is weak, with the MACD below zero, hinting at persistent negative pressure, while the RSI at 24 shows oversold conditions that could slow the downside but have yet to trigger a meaningful rebound.
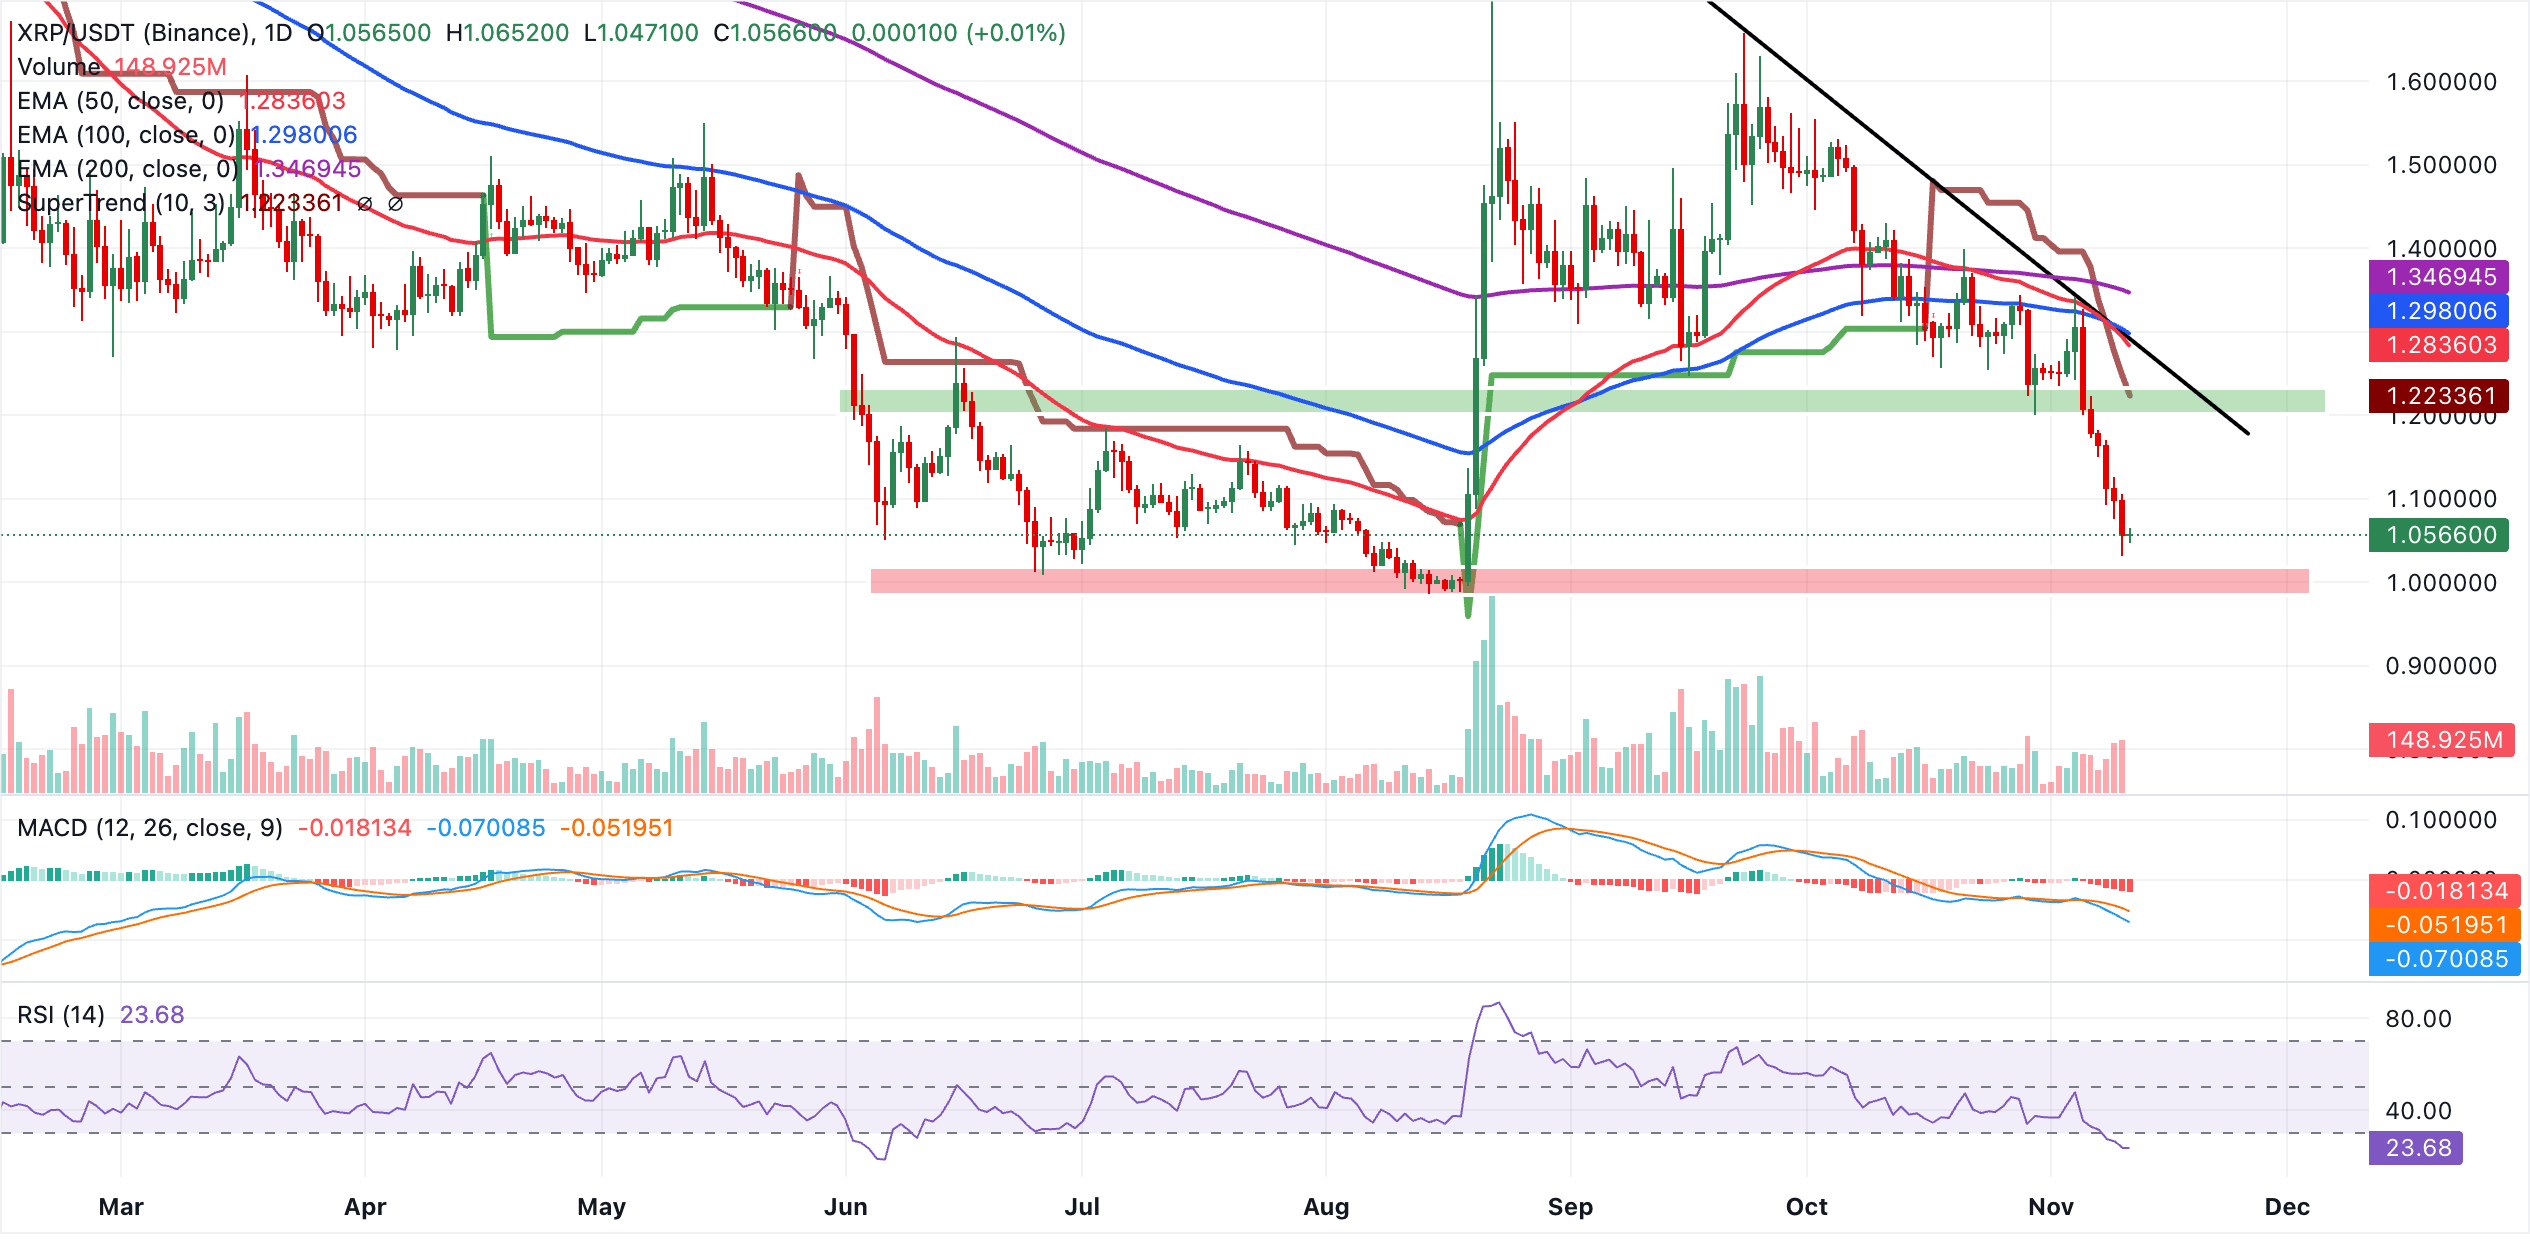
Initial resistance appears at the SuperTrend level near $1.22, ahead of a dense EMA cluster where the 50-day EMA at $1.28 aligns closely with the broken downward trendline reference around $1.29, and the 100-day EMA at $1.30. Higher up, the 200-day EMA at $1.35 marks a more strategic barrier that would need to be reclaimed to ease the broader bearish bias.
With no clear technical support levels below the spot price on the daily chart, the pair remains vulnerable to further downside while it trades under this stacked resistance zone, and only a daily close back above the $1.22-$1.30 area would start to suggest stabilization.
(The technical analysis of this story was written with the help of an AI tool. Know more.)
Crypto ETF FAQs
An Exchange-Traded Fund (ETF) is an investment vehicle or an index that tracks the price of an underlying asset. ETFs can not only track a single asset, but a group of assets and sectors. For example, a Bitcoin ETF tracks Bitcoin’s price. ETF is a tool used by investors to gain exposure to a certain asset.
Yes. The first Bitcoin futures ETF in the US was approved by the US Securities & Exchange Commission in October 2021. A total of seven Bitcoin futures ETFs have been approved, with more than 20 still waiting for the regulator’s permission. The SEC says that the cryptocurrency industry is new and subject to manipulation, which is why it has been delaying crypto-related futures ETFs for the last few years.
Yes. The SEC approved in January 2024 the listing and trading of several Bitcoin spot Exchange-Traded Funds, opening the door to institutional capital and mainstream investors to trade the main crypto currency. The decision was hailed by the industry as a game changer.
The main advantage of crypto ETFs is the possibility of gaining exposure to a cryptocurrency without ownership, reducing the risk and cost of holding the asset. Other pros are a lower learning curve and higher security for investors since ETFs take charge of securing the underlying asset holdings. As for the main drawbacks, the main one is that as an investor you can’t have direct ownership of the asset, or, as they say in crypto, “not your keys, not your coins.” Other disadvantages are higher costs associated with holding crypto since ETFs charge fees for active management. Finally, even though investing in ETFs reduces the risk of holding an asset, price swings in the underlying cryptocurrency are likely to be reflected in the investment vehicle too.
추천 기사


