


Bitcoin Price Forecast: BTC at risk of sharp moves as leverage builds in derivatives markets
- Bitcoin trades around $73,800 on Wednesday after falling to a low of $72,727 following the previous day’s hot US inflation figures.
- US-listed BTC spot ETF recorded an outflow of $95 million on Tuesday, marking the fourth straight day of withdrawals.
- Reports highlight that BTC’s derivatives market is heavily leveraged, increasing the risk of a sharp price move in either direction.
Bitcoin (BTC) remains in a capped tone, trading around $73,800 on Wednesday after slipping to a low of $72,727 following the previous day’s hot US inflation figures. Institutional demand continues to weaken, with BTC spot Exchange Traded Funds (ETFs) recording a $95 million outflow on Tuesday, marking the fourth straight day of withdrawals. Traders should be cautious as a K33 Research report highlights that BTC is at risk of sharp moves as leverage builds in derivatives markets.
Hotter-than-expected inflation lifts yields and US Dollar while weighing on BTC
The much-anticipated US October Consumer Price Index (CPI) data was released on Tuesday. Headline CPI rose 0.4% in October, above market expectations of 0.3%. Moreover, the core gauge, which excludes volatile energy and food prices, was up 0.3%, matching September’s increase and surpassing estimates of 0.2%.
The report didn't include annual inflation figures in this release because it lacks October 2025 monthly data due to the government shutdown from October 1, 2025, to November 12, 2025.
Hotter-than-expected US CPI figures are weighing on risk appetite, while growing expectations of further monetary tightening by the Federal Reserve (Fed) are supporting the US Dollar (USD) and US Treasuries.
Tuesday’s inflation report has strengthened concerns that the Federal Reserve (Fed) could raise interest rates in December. Fed Governor Christopher Waller warned that a stronger-than-expected core CPI reading of 0.3% could prompt him to consider a larger 50-basis-point (bps) rate hike at the December 8–9 policy meeting. He added that limiting the increase to 25 bps could put the Fed’s credibility at risk.
Furthermore, Philadelphia Fed President Anna Paulson noted that ongoing restrictive policy is needed to push inflation back down to 2%, while Dallas Fed President Lorie Logan suggested that rate hikes may need to happen at a faster pace than previously anticipated.
This hawkish stance strengthens the USD and pushes Treasury yields higher, with the 10-year yield moving above 5% and weighing on risky assets such as Bitcoin.
Liquidations sweep the crypto market
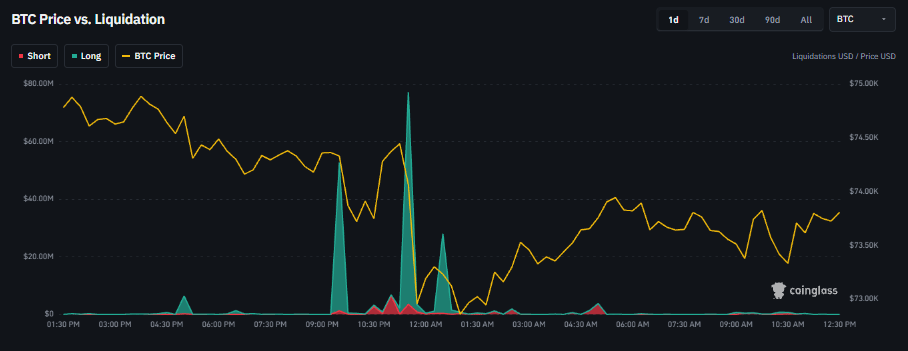
The CoinGlass liquidation chart below shows that after the hotter-than-expected US CPI data, BTC corrected sharply, hitting a low of $72,727 on Tuesday, a level not seen since August 20.
This sharp move triggered a wave of liquidations across the crypto market, with mostly leveraged long positions being wiped out, highlighting the excessive bullish positioning.
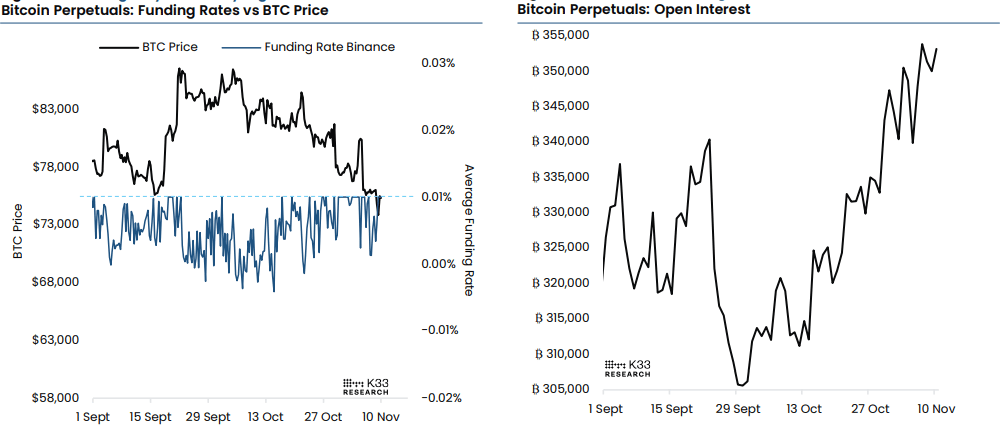
In addition, the risk of sharp price moves remains elevated for the Crypto King as leverage continues to build in derivatives markets.
According to a K33 Research report, Open Interest (OI) in BTC perpetual futures stands at 353,000 BTC, ranking in the 99th percentile of observations over the past two years. Meanwhile, annualized funding rates have averaged 8.4% over the past week, indicating sustained demand for long exposure as BTC tests key support levels.
“Historically, similarly elevated open interest has coincided with price extremes and periods of substantial volatility, often preceding sharp reversals. While elevated leverage provided fuel for upside moves in June and August, current positioning appears less directional, leaving considerable scope for volatility in either direction. A breakdown could trigger substantial long liquidations, while a recovery could fuel short covering, amplifying price moves as leveraged positions unwind,” the analyst concluded.
ETFs outflows continues
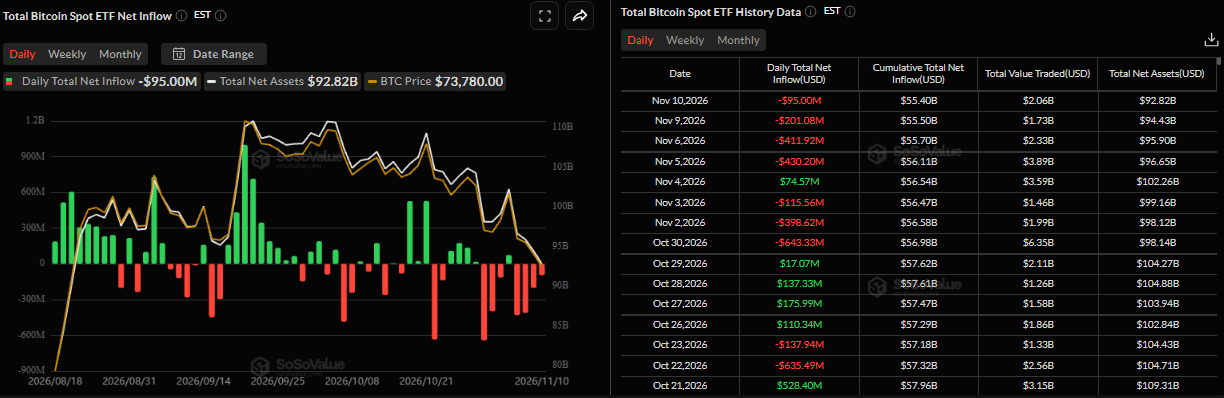
Institutional demand for Bitcoin has continued to weaken so far this week. SoSoValue data shows BTC spot ETFs recorded net outflows of $95 million on Tuesday, marking the fourth straight day of withdrawals since last week. If this outflow trend continues and intensifies throughout this week, it could put additional pressure on BTC, pushing its price into a deeper correction.
Some signs of optimism
Some signs of optimism could offer near-term support for BTC. On Tuesday, US Secretary of State Marco Rubio said following a meeting of G7 foreign ministers in Paris that the economic campaign against Iran had been so damaging that major combat operations were not currently necessary.
This comes as US President Donald Trump played down escalation concerns after the midterm elections. In fact, Trump told reporters that renewed US attacks on Iran were "highly unlikely" and added that there is positive momentum behind negotiations to end the Middle East conflict. Meanwhile, Iran urged the US to meet its demands in a plan to reopen the Strait of Hormuz.
This fuels optimism about a potential diplomatic breakthrough to end the US-Iran war, easing geopolitical risk concerns and potentially providing near-term support for Bitcoin.
Bitcoin technical outlook: Price action suggests rallies are likely to be sold
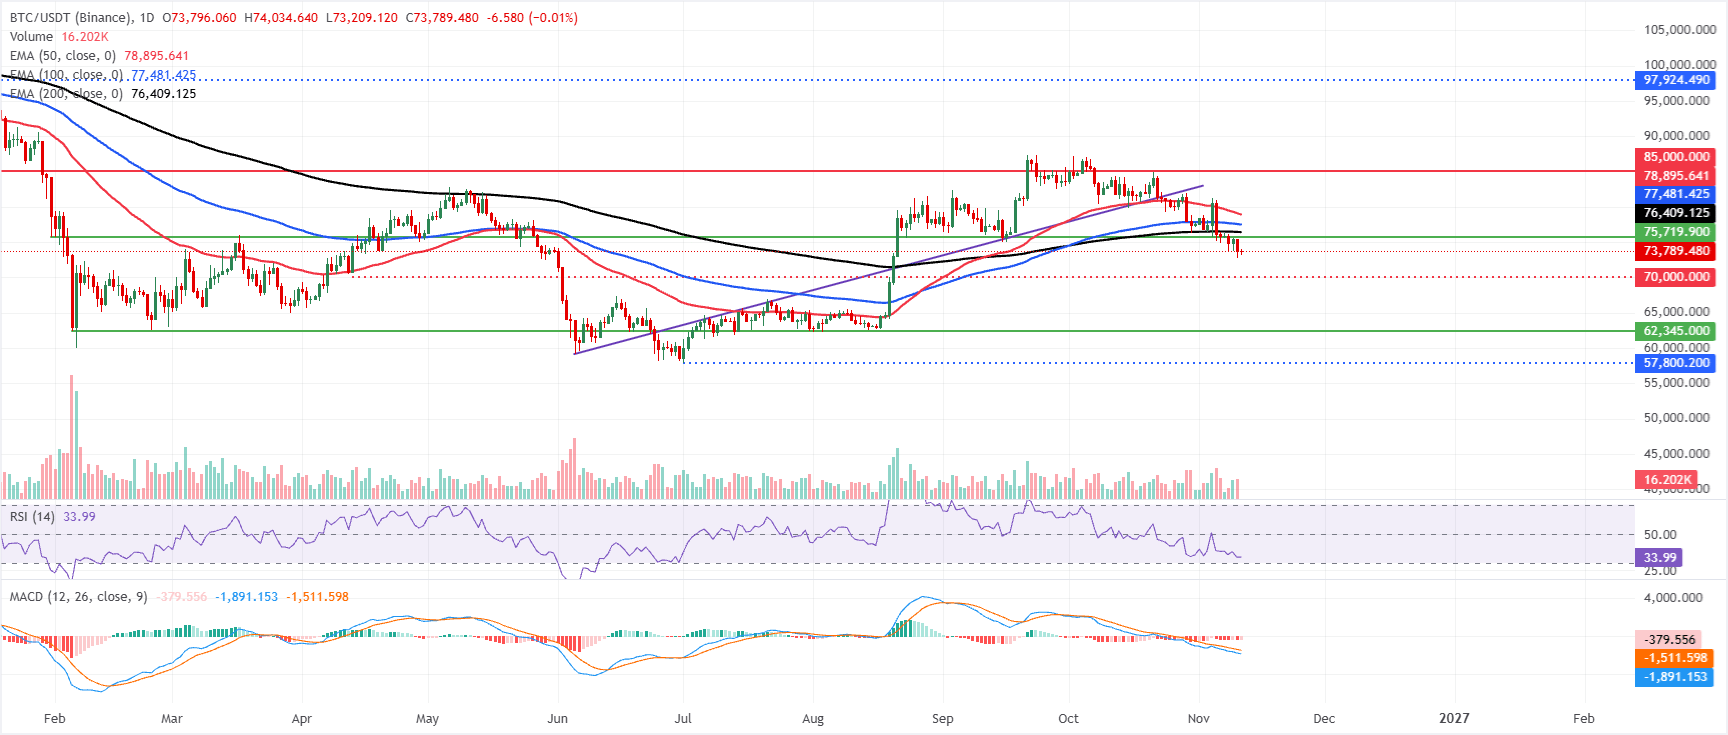
Bitcoin price trades at $73,789 at the time of writing on Wednesday, extending a bearish corrective phase as it holds below the 50-day, 100-day and 200-day Exponential Moving Averages (EMAs) clustered between roughly $76,400 and $78,900.
This setup suggests rallies are likely to be sold while the Relative Strength Index (RSI) hovers just above oversold territory near 33 on the daily chart and the Moving Average Convergence Divergence (MACD) histogram remains negative, reinforcing persistent downside pressure despite stretched short-term conditions.
On the topside, initial resistance emerges at the 200-day EMA around $76,409, followed by the 100-day EMA near $77,481 and then the 50-day EMA close to $78,895, which collectively define a dense supply band that bulls would need to reclaim to ease the bearish bias. A more substantial barrier is horizontal resistance around $85,000, where a daily close above would be required to signal a more durable shift back to a constructive medium-term trend.
On the downside, the lack of nearby mapped support suggests that any break below current levels would send BTC toward the psychological support zone around $70,000 before stabilizing.
(The technical analysis of this story was written with the help of an AI tool. Know more.)
Bitcoin, altcoins, stablecoins FAQs
Bitcoin is the largest cryptocurrency by market capitalization, a virtual currency designed to serve as money. This form of payment cannot be controlled by any one person, group, or entity, which eliminates the need for third-party participation during financial transactions.
Altcoins are any cryptocurrency apart from Bitcoin, but some also regard Ethereum as a non-altcoin because it is from these two cryptocurrencies that forking happens. If this is true, then Litecoin is the first altcoin, forked from the Bitcoin protocol and, therefore, an “improved” version of it.
Stablecoins are cryptocurrencies designed to have a stable price, with their value backed by a reserve of the asset it represents. To achieve this, the value of any one stablecoin is pegged to a commodity or financial instrument, such as the US Dollar (USD), with its supply regulated by an algorithm or demand. The main goal of stablecoins is to provide an on/off-ramp for investors willing to trade and invest in cryptocurrencies. Stablecoins also allow investors to store value since cryptocurrencies, in general, are subject to volatility.
Bitcoin dominance is the ratio of Bitcoin's market capitalization to the total market capitalization of all cryptocurrencies combined. It provides a clear picture of Bitcoin’s interest among investors. A high BTC dominance typically happens before and during a bull run, in which investors resort to investing in relatively stable and high market capitalization cryptocurrency like Bitcoin. A drop in BTC dominance usually means that investors are moving their capital and/or profits to altcoins in a quest for higher returns, which usually triggers an explosion of altcoin rallies.
추천 기사


