


Bitcoin Price Forecast: BTC faces pressure as weekly ETF outflows hit $1.28 billion
- Bitcoin hovers below the 50-week SMA around $75,222 on Monday after closing below it last week, marking five straight week of losses.
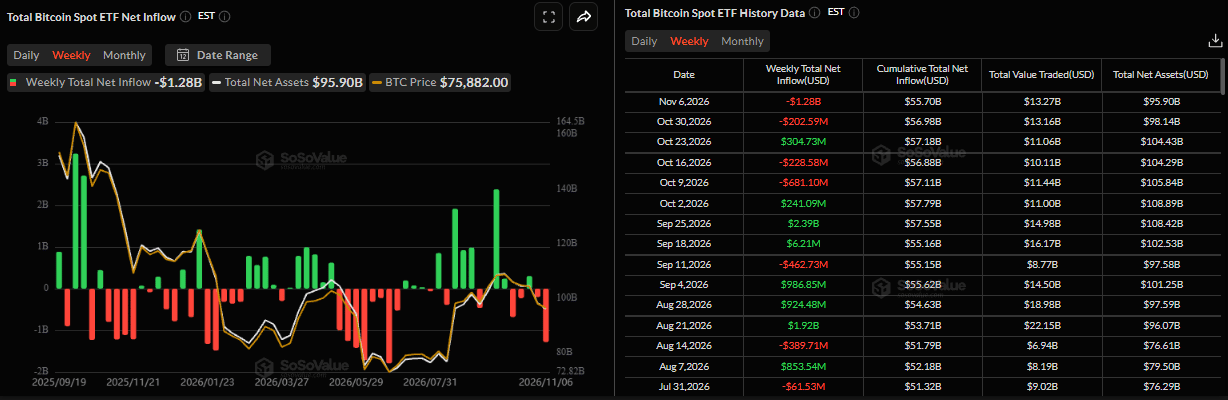
- US-listed spot ETFs recorded net outflows of $1.28 billion last week, the highest weekly withdrawal since the end of June.
- Hotter-than-expected jobs data reinforced expectations that the Fed could keep interest rates higher for longer, weighing on risk assets such as BTC.
Bitcoin (BTC) remains under pressure on Monday, trading below the 50-week Simple Moving Average (SMA) at $75,222 after extending its losing streak to five consecutive weeks. Bearish sentiment strengthened as $1.28 billion in net outflows from spot BTC Exchange-Traded Funds (ETFs) last week marked the largest weekly withdrawal since late June. Meanwhile, hotter-than-expected jobs data has strengthened expectations that the Federal Reserve (Fed) could keep interest rates higher for longer, weighing on Crypto King.
Highest weekly outflow since late June
Institutional demand for Bitcoin weakened last week. SoSoValue data shows BTC spot ETFs recorded net outflows of $1.28 billion last week, the highest weekly withdrawal since the end of June. Moreover, last week’s outflow marked the second straight week of withdrawals, indicating weakening investor demand. If this outflow trend continues and intensifies throughout this week, it could put additional pressure on BTC, pushing its price into a deeper correction.
Macroeconomic conditions cap BTC
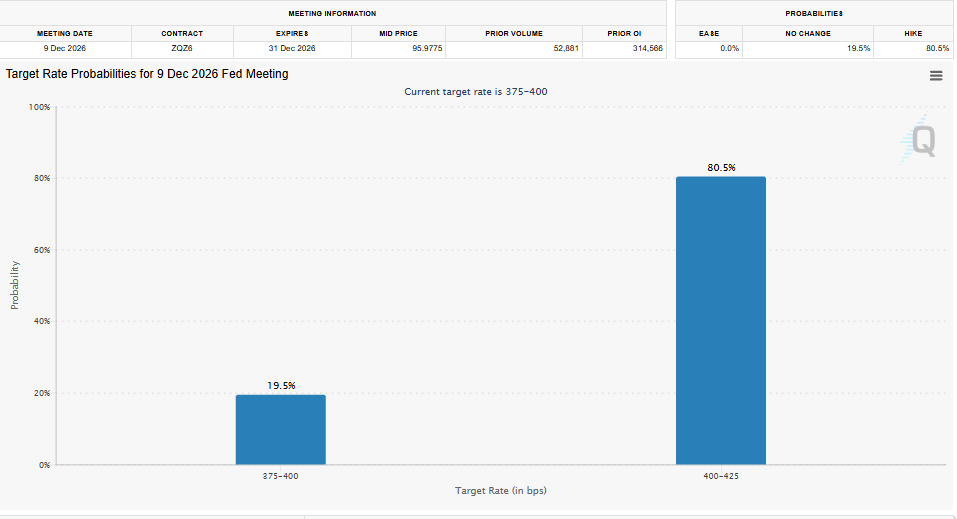
On the macroeconomic front, Nonfarm Payrolls (NFP) data weighed on risk assets. Stronger-than-expected US payrolls reinforced expectations that the Fed could keep interest rates higher for longer. Higher interest rates increase the opportunity cost of holding non-yielding assets such as Bitcoin, while potentially tightening financial conditions and reducing investor appetite for riskier investments.
According to the CME FedWatch tool chart, traders are currently pricing in about 80.5% odds that the Fed will raise rates in December, up from 72.8% before the US jobs report. This macroeconomic backdrop could continue to weigh on BTC’s recovery prospects.
Bitcoin technical outlook: BTC loses key support
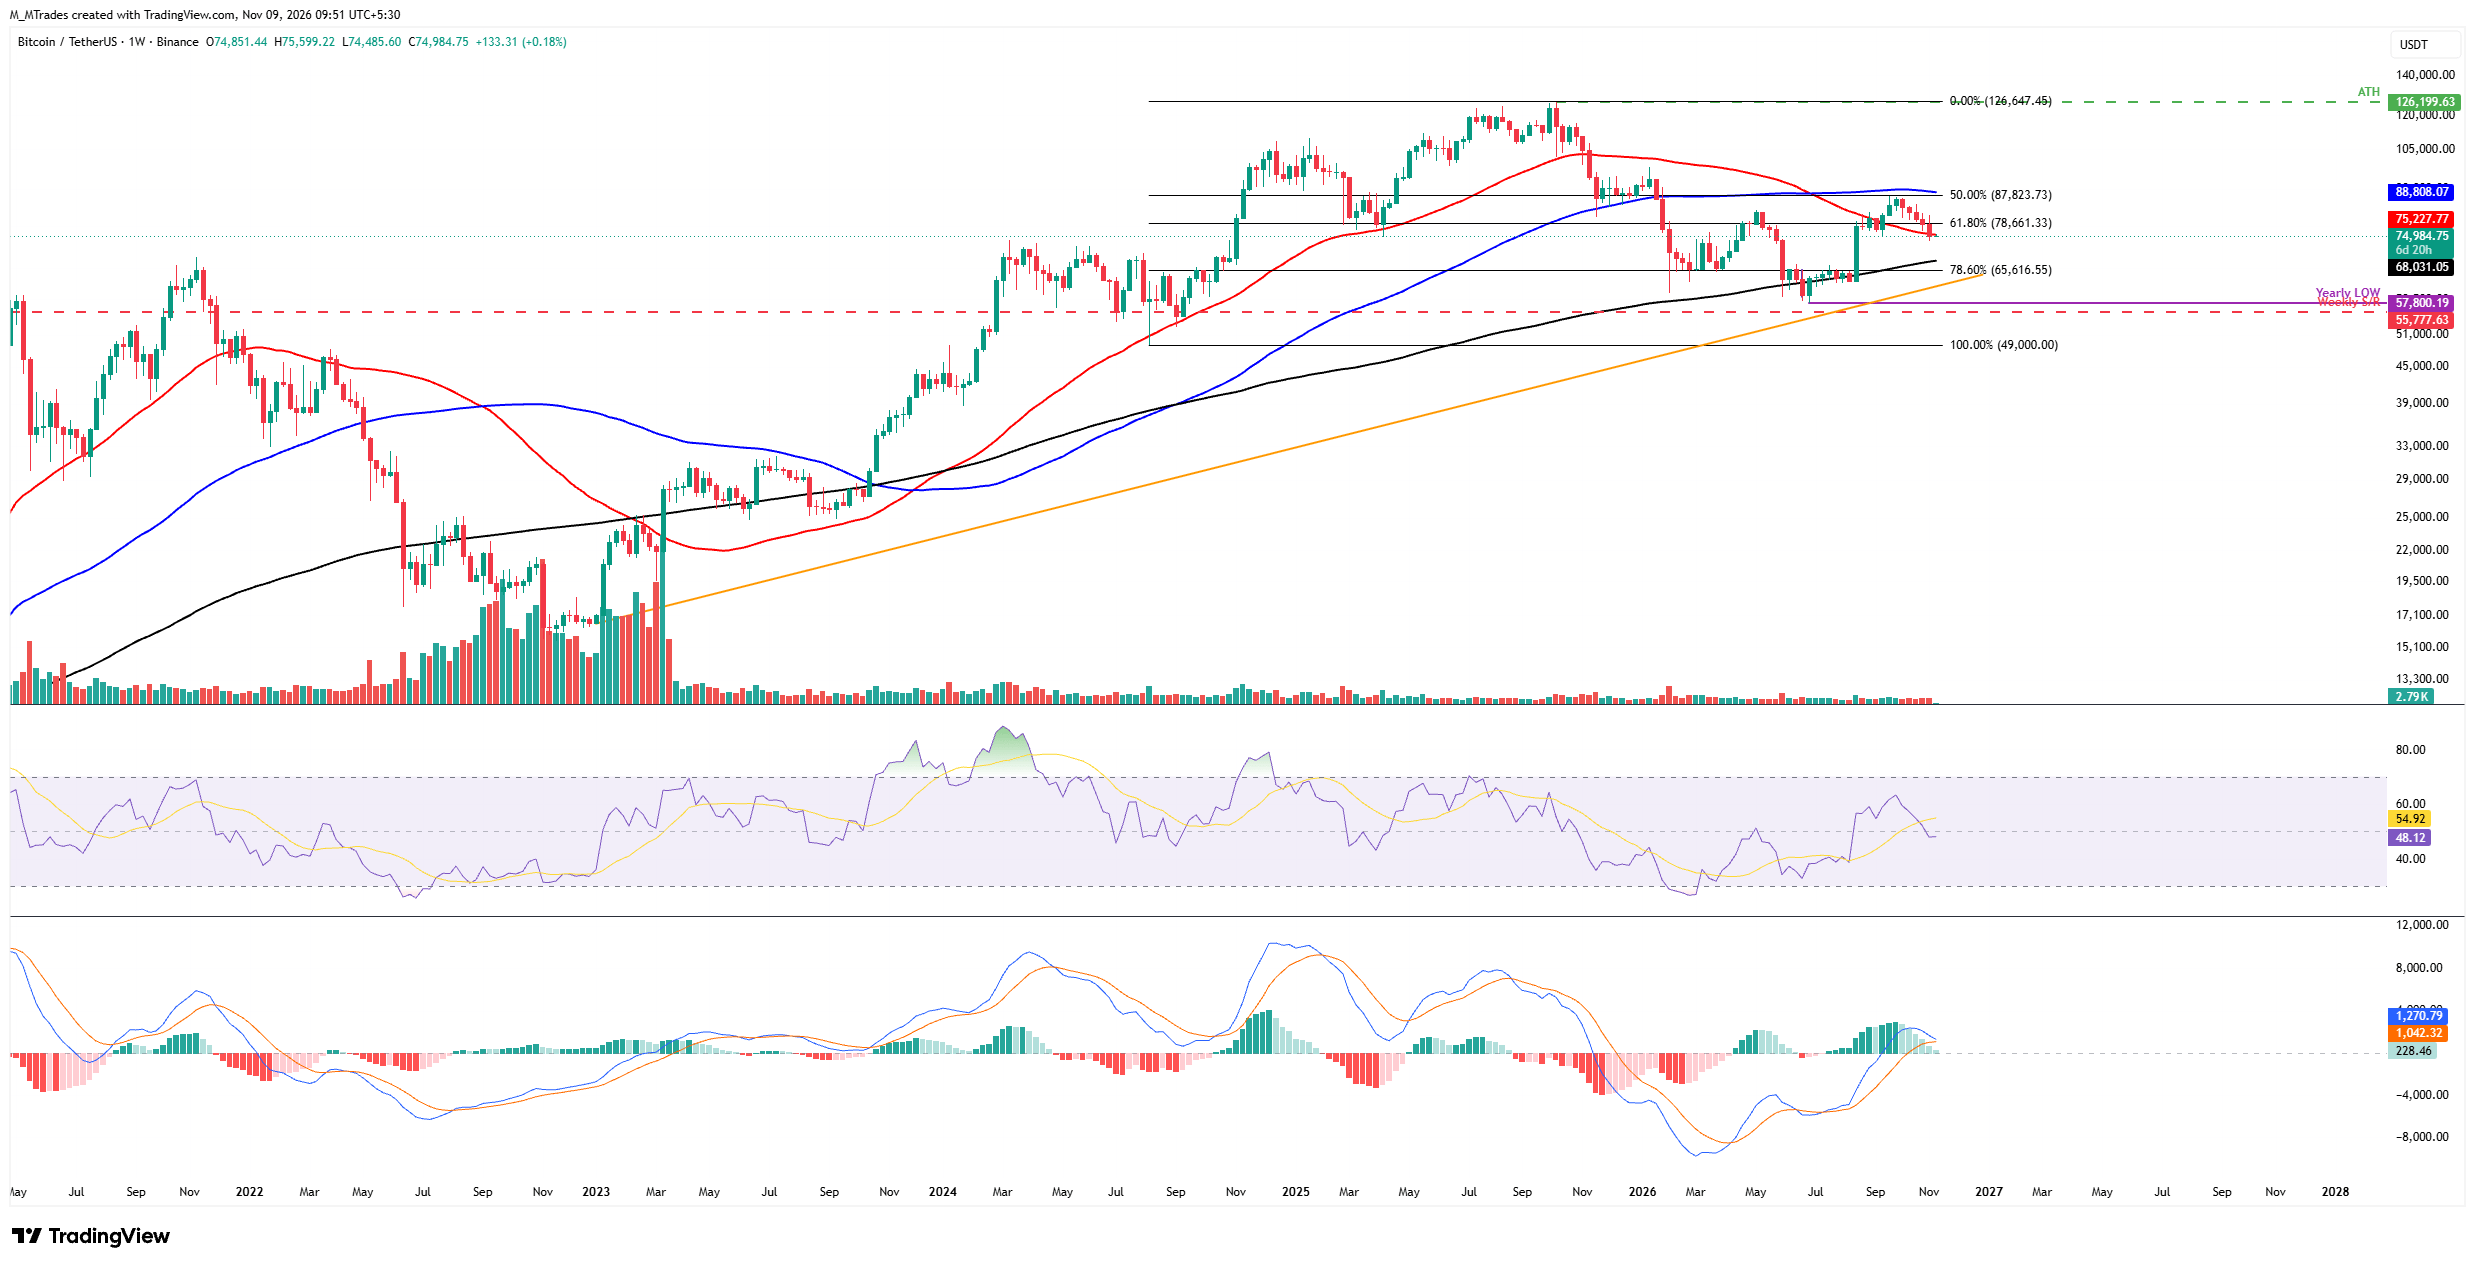
The Crypto King lost 4.47% last week and closed below the 50-week Simple Moving Average (SMA) at $75,222, marking its fifth straight negative week. As of the start of this week on Monday, BTC continues to trade below this 50-week SMA around $74,984.
If BTC continues its correction, it could fall toward the 200-week SMA at $68,031.
The Relative Strength Index (RSI) on the weekly chart stands at 48, below the neutral 50 level, suggesting fading bullish momentum. Meanwhile, the Moving Average Convergence Divergence (MACD) histogram remains positive, although its bars are weakening. This suggests broader upside momentum remains intact but is losing strength amid nearby resistance and the ongoing correction.
On the other hand, if BTC recovers, it could extend the advance toward the 50-week SMA at $75,222. A successful close and hold of this level could extend the recovery toward the 61.8% Fibonacci retracement level of $78,661 (drawn from the August 2024 low of $49,000 to the October 2025 record high of $126,199).
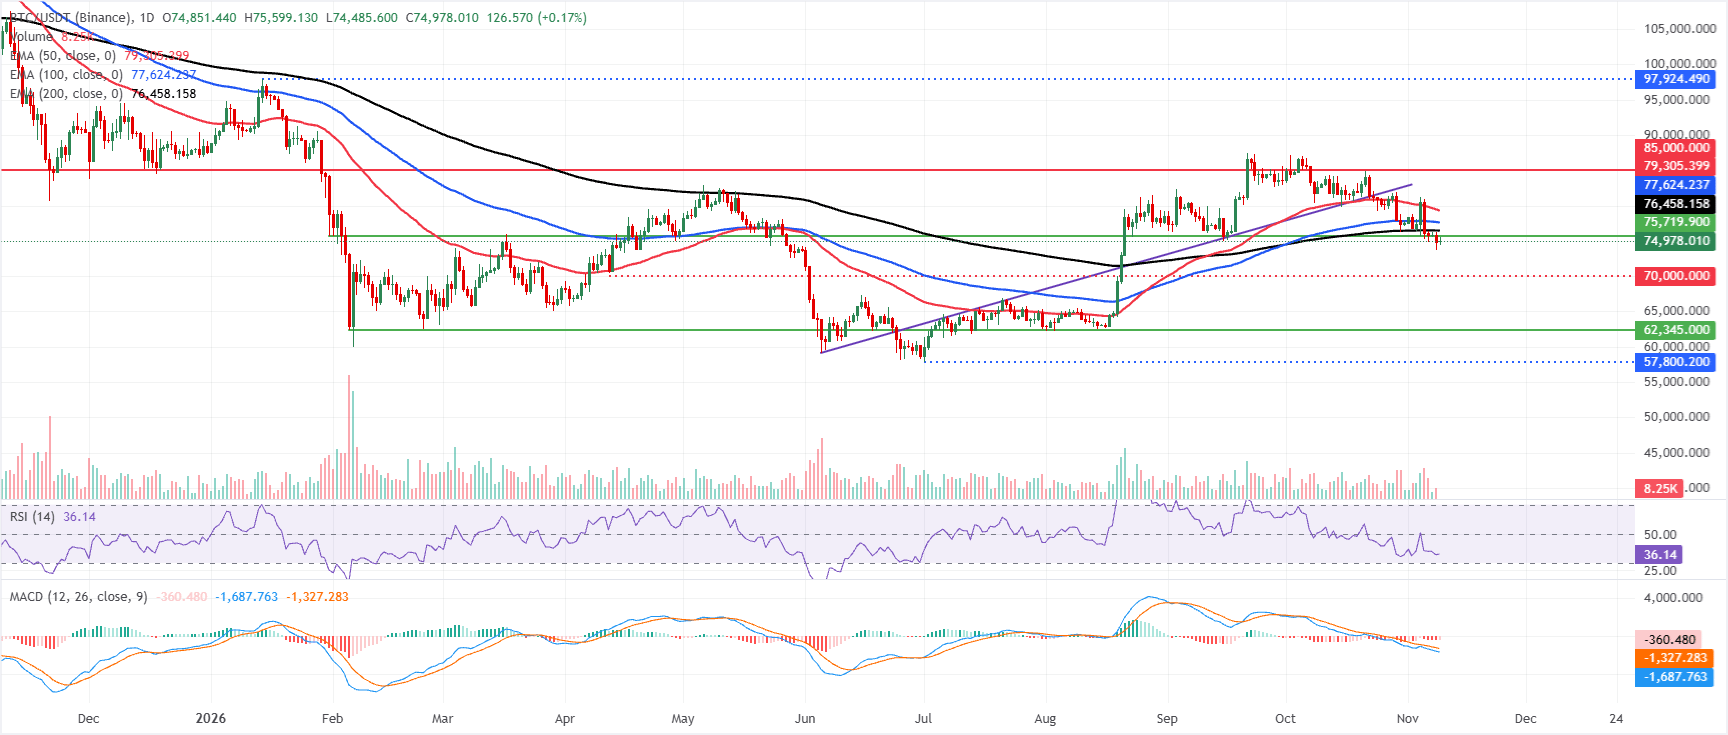
On the daily chart, BTC maintains a bearish near-term bias as it holds beneath the major Exponential Moving Averages (EMAs). The 200-day EMA at $76,458 is the nearest cap, with the 100-day EMA at $77,624 and the 50-day EMA at $79,305 stacked higher and reinforcing a heavy topside structure.
Daily momentum also leans lower, with the RSI hovering near 36. At the same time, the MACD remains negative and below zero, hinting that rallies are likely to face selling pressure into these overhead levels.
On the topside, initial resistance is located at the 200-day EMA around $76,458, followed by the 100-day EMA at $77,624. A stronger recovery would then target the 50-day EMA at $79,307, ahead of the horizontal barrier near $85,000.
On the downside, the absence of nearby mapped support suggests that any break lower from current levels would send BTC toward the psychological support zone around $70,000 before stabilizing.
(The technical analysis of this story was written with the help of an AI tool. Know more.)
Bitcoin, altcoins, stablecoins FAQs
Bitcoin is the largest cryptocurrency by market capitalization, a virtual currency designed to serve as money. This form of payment cannot be controlled by any one person, group, or entity, which eliminates the need for third-party participation during financial transactions.
Altcoins are any cryptocurrency apart from Bitcoin, but some also regard Ethereum as a non-altcoin because it is from these two cryptocurrencies that forking happens. If this is true, then Litecoin is the first altcoin, forked from the Bitcoin protocol and, therefore, an “improved” version of it.
Stablecoins are cryptocurrencies designed to have a stable price, with their value backed by a reserve of the asset it represents. To achieve this, the value of any one stablecoin is pegged to a commodity or financial instrument, such as the US Dollar (USD), with its supply regulated by an algorithm or demand. The main goal of stablecoins is to provide an on/off-ramp for investors willing to trade and invest in cryptocurrencies. Stablecoins also allow investors to store value since cryptocurrencies, in general, are subject to volatility.
Bitcoin dominance is the ratio of Bitcoin's market capitalization to the total market capitalization of all cryptocurrencies combined. It provides a clear picture of Bitcoin’s interest among investors. A high BTC dominance typically happens before and during a bull run, in which investors resort to investing in relatively stable and high market capitalization cryptocurrency like Bitcoin. A drop in BTC dominance usually means that investors are moving their capital and/or profits to altcoins in a quest for higher returns, which usually triggers an explosion of altcoin rallies.
추천 기사


