Solana Price Forecast: SOL risks $100 breakdown as ETF outflows mount

출처 Fxstreet
  • Solana extends losses on Thursday after retreating over 2% from its 50-day EMA at $107.13 the previous day.
  • SOL-focused ETFs recorded over $1 million in redemptions, marking their eighth consecutive day of outflows.
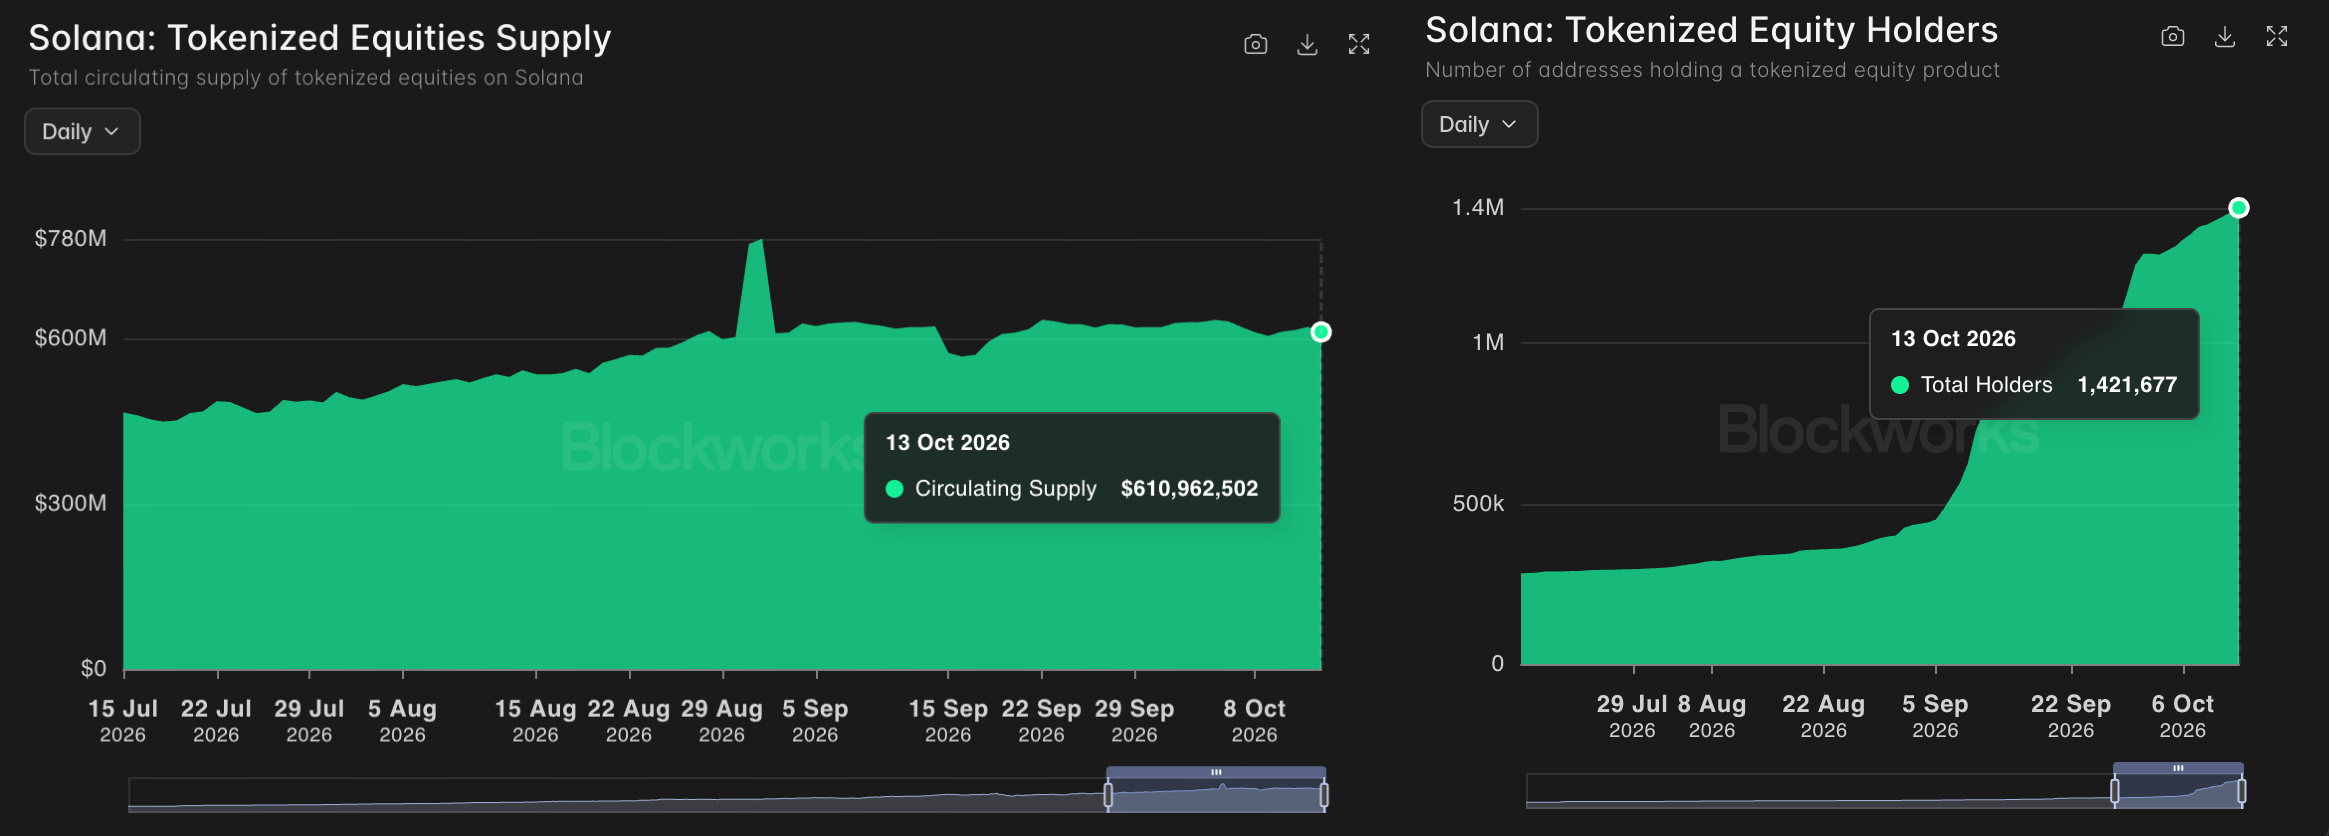
  • Solana sees steady growth in tokenized assets, with over $600 million in tokenized equity supply across 1.4 million holders.

Solana (SOL) price extends losses on Thursday, inching lower to the $100 mark after a 2% retreat from the 50-day Exponential Moving Average (EMA) at $107.13 the previous day. The institutional demand remains weak, with eight consecutive days of outflows from SOL-focused Exchange Traded Funds (ETFs). Tokenized assets rise on Solana, with over $600 million in tokenized equity supply across 1.4 million holders.

The technical outlook for Solana indicates a downside bias as bearish pressure mounts.

Solana ETFs face consistent selling pressure

Solana-focused ETFs are experiencing an extended selloff, driven by consistent investor redemptions over the last week. SoSoValue data shows SOL ETFs marked their eighth consecutive day of outflows, with $1.29 million on Wednesday and extending last week’s $24.81 million.

On the other hand, the tokenized assets on Solana are rising. Blockworks data shows tokenized equity supply rising to nearly $611 million on Tuesday, distributed across 1.42 million holders. 
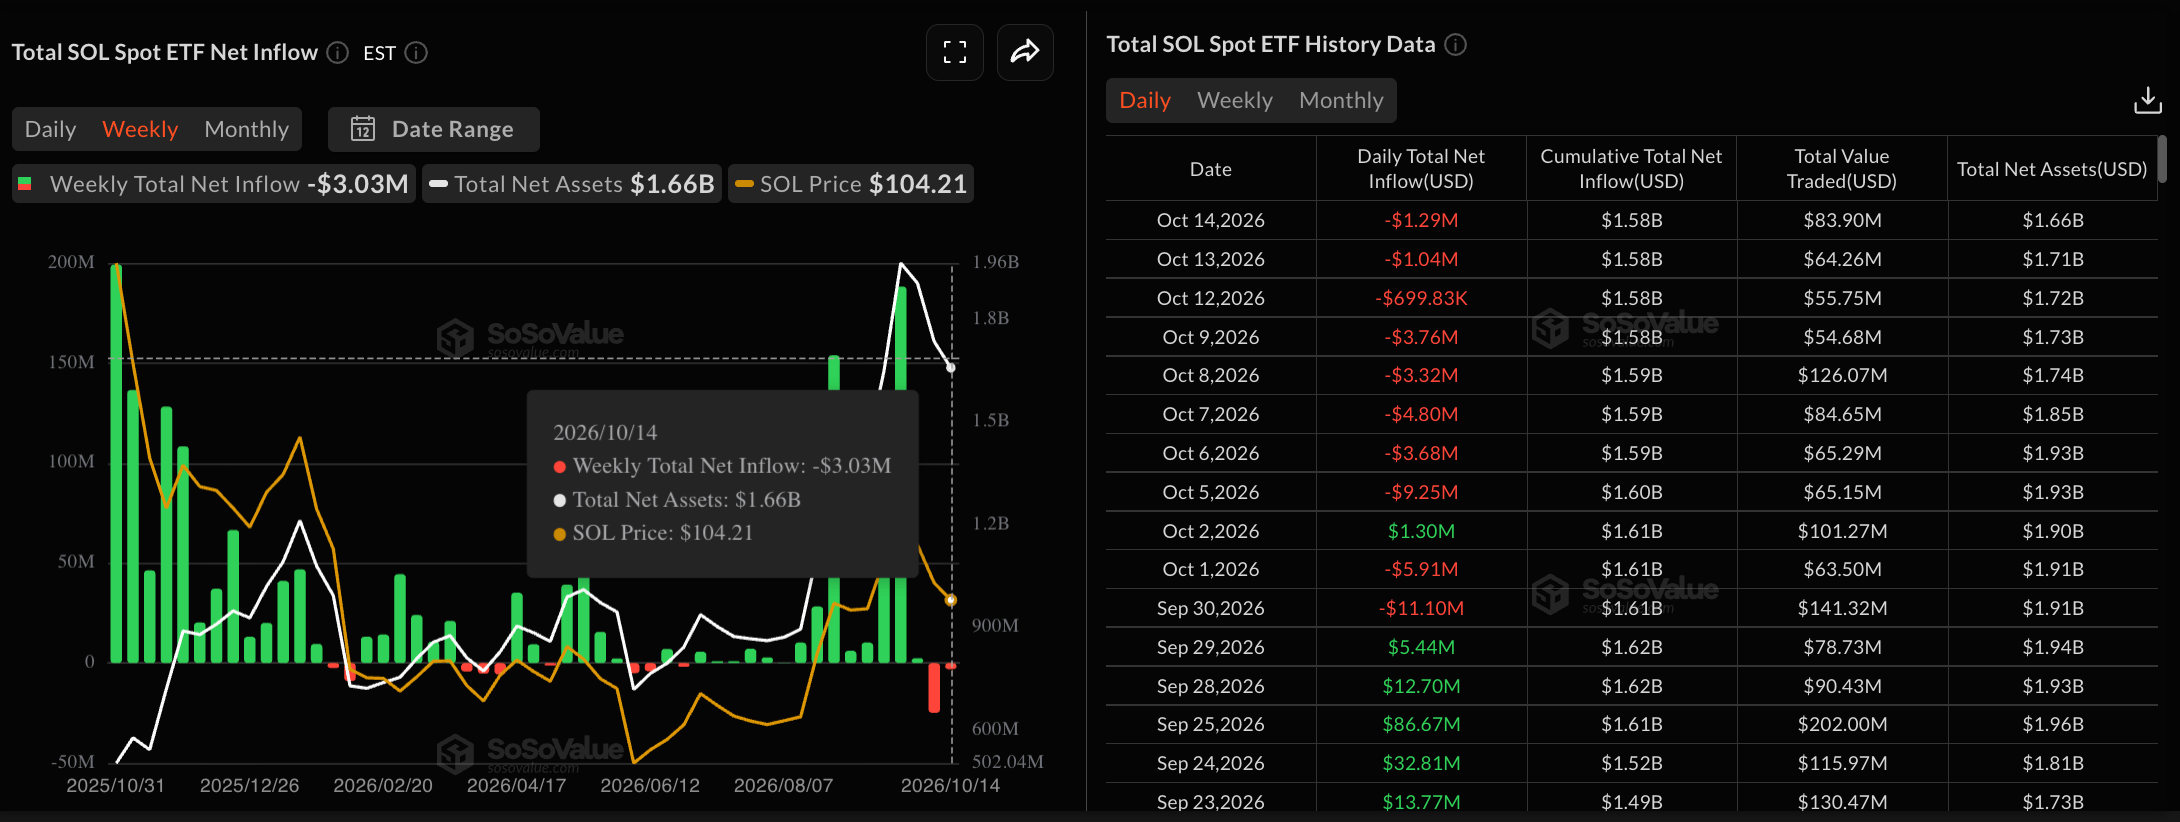
SOL ETFs data. Source: Sosovalue
Solana tokenized assets data. Source: Blockworks

Technical outlook: Could Solana's price fall below $100?

Solana trades around $102.50 at press time on Thursday, maintaining a bearish near-term bias after a double-top reversal from $122 in early October. The SOL price is down over 13% so far in October, crossing below the 50-day EMA at $107.13. Still, SOL remains above the 200-day EMA at $97.95, suggesting a corrective phase within a broader uptrend.

Downside pressure remains firm on the daily chart, with the Moving Average Convergence Divergence (MACD) below its signal and zero line, while the Relative Strength Index (RSI) near 35 suggests that sellers remain in control.

Looking down, the 200-day EMA at $97.95 offers the first meaningful support zone. A clear drop through this level would likely expose deeper losses, aligning with the May 17 high at $83.50.

Chart Analysis SOL/USDT (Binance)
SOL/USDT daily price chart.

On the flip side, initial resistance is located at the 50-day EMA around $107.13. A sustained break above this barrier would be needed to ease the current bearish tone before the more distant horizontal cap near the September 25 high at $122.94 comes into view.

(The technical analysis of this story was written with the help of an AI tool. Know more.)

면책 조항: 정보 제공 목적으로만 사용됩니다. 과거 성과가 미래 결과를 보장하지 않습니다.
placeholder
금 가격 전망: 9월 PPI가 거의 4년 만에 최대 폭으로 상승한 후 금 가격이 반등한 이유는?TradingKey - 10월 16일 유럽 세션 기준, 금 가격(XAUUSD)은 반등세를 이어가며 현재 전일 대비 약 0.4% 상승한 4,185달러 부근에서 거래되고 있다. 금 가격은 앞서 4,073달러 부근까지 하락한 후 지속적인 회복세를 보였다. 어제 발표된 미국의 생산자물가지수(PPI)와 소매판매 지표가 모두 시장 예상치를 상회했으나, 미 달러화와 국
저자  Mitrade팀
10 월 16 일 금요일
TradingKey - 10월 16일 유럽 세션 기준, 금 가격(XAUUSD)은 반등세를 이어가며 현재 전일 대비 약 0.4% 상승한 4,185달러 부근에서 거래되고 있다. 금 가격은 앞서 4,073달러 부근까지 하락한 후 지속적인 회복세를 보였다. 어제 발표된 미국의 생산자물가지수(PPI)와 소매판매 지표가 모두 시장 예상치를 상회했으나, 미 달러화와 국
placeholder
일본, 한국 증시 개장 직후 반등; 코스피 1.8% 상승, 삼성전자, SK하이닉스 1% 이상 상승TradingKey - 10월 16일 장 초반 한국과 일본 증시가 반등했으며, 양국 주가 모두 소폭 상승 출발했다. 코스피 지수(KOSPI)는 1.8% 오른 5,653.99포인트로 개장한 뒤 1.77% 상승한 5,652.51포인트를 기록했으며, 일본 닛케이 225 지수는 0.78% 상승한 64,925.29포인트로 출발해 이후 상승 폭을 0.94%로 확대하며
저자  Mitrade팀
10 월 16 일 금요일
TradingKey - 10월 16일 장 초반 한국과 일본 증시가 반등했으며, 양국 주가 모두 소폭 상승 출발했다. 코스피 지수(KOSPI)는 1.8% 오른 5,653.99포인트로 개장한 뒤 1.77% 상승한 5,652.51포인트를 기록했으며, 일본 닛케이 225 지수는 0.78% 상승한 64,925.29포인트로 출발해 이후 상승 폭을 0.94%로 확대하며
placeholder
미국 9월 PPI 전망: 인플레이션 또다시 시장을 놀라게 할까? 미국 증시, 달러, 금 주요 시험대 직면TradingKey - 미국 동부시간 기준 10월 15일, 미국은 9월 생산자물가지수(PPI)를 발표할 예정이다. 이번 수요일 발표된 9월 CPI가 시장 예상치를 눈에 띄게 상회한 가운데, PPI는 생산 단계(상류)의 물가 압력이 가열되고 있는지 여부를 추가로 확인해 줄 것이다. 이는 연방준비제도(Fed)의 10월 및 12월 금리 결정에 대한 시장 기대에
저자  Mitrade팀
10 월 15 일 목요일
TradingKey - 미국 동부시간 기준 10월 15일, 미국은 9월 생산자물가지수(PPI)를 발표할 예정이다. 이번 수요일 발표된 9월 CPI가 시장 예상치를 눈에 띄게 상회한 가운데, PPI는 생산 단계(상류)의 물가 압력이 가열되고 있는지 여부를 추가로 확인해 줄 것이다. 이는 연방준비제도(Fed)의 10월 및 12월 금리 결정에 대한 시장 기대에
placeholder
오늘의 증시 요약: 9월 CPI 예상치 상회로 금리 인상 우려 고조; 미 증시 전반 하락, 오라클 8% 이상 하락, SK하이닉스 6% 넘게 하락시장 동향 추적TradingKey - 미 동부시간 10월 14일, 미국의 9월 소비자물가지수(CPI) 데이터가 시장 예상치를 상회하면서 10월 연준의 금리 인상 기대감을 자극하고 투자 심리를 위축시켜 미국 증시 하락을 이끌었다. AI 하드웨어, 기술주, 은행주가 하락세를 주도했다.마감 수치 기준 다우존스 산업평균지수는 0.09% 하락한 51,621.48에
저자  Mitrade팀
10 월 15 일 목요일
시장 동향 추적TradingKey - 미 동부시간 10월 14일, 미국의 9월 소비자물가지수(CPI) 데이터가 시장 예상치를 상회하면서 10월 연준의 금리 인상 기대감을 자극하고 투자 심리를 위축시켜 미국 증시 하락을 이끌었다. AI 하드웨어, 기술주, 은행주가 하락세를 주도했다.마감 수치 기준 다우존스 산업평균지수는 0.09% 하락한 51,621.48에
placeholder
미국 9월 CPI 발표를 앞두고 비트코인이 전 고점인 8만 7,000달러를 돌파할 수 있을까?TradingKey - 미국 9월 CPI 발표 임박: 비트코인 강세론자들은 8만 7,000달러를 돌파할 수 있을까?10월 14일 비트코인(BTC) 가격은 장중 0.5% 하락한 8만 3,362달러를 기록하며 8만 4,000달러 아래에서 박스권 흐름을 이어갔다. 다가오는 미국 9월 CPI 데이터 발표가 비트코인 가격을 밀어올려 전고점인 8만 7,000달러를 돌
저자  Mitrade팀
10 월 14 일 수요일
TradingKey - 미국 9월 CPI 발표 임박: 비트코인 강세론자들은 8만 7,000달러를 돌파할 수 있을까?10월 14일 비트코인(BTC) 가격은 장중 0.5% 하락한 8만 3,362달러를 기록하며 8만 4,000달러 아래에서 박스권 흐름을 이어갔다. 다가오는 미국 9월 CPI 데이터 발표가 비트코인 가격을 밀어올려 전고점인 8만 7,000달러를 돌
goTop
quote